

2
WeRcome!
Welcome to my journey through the world of R!
✔
Become familiar with the lingua franca of statistics
✔
Discover applications of R in Evidence-Based Medicine
✔
Rock, squeeze and explore your data deeply - for free
✔
Find 13 reasons why you will love R!
cannot wait? jump now!
✔
Enhance your skills...
...and start using R today!
...and start using R today!

3
...befoRe we start...
DISCLAIMER
DISCLAIMER
All trademarks, logos of companies and names of products
used in this document
are the sole property of their respective owners
and are included here
for informational, illustrative purposes only
nominative fair use
•••
This presentation is based exclusively on information
publicly available on the Internet under provided hyperlinks.
•••
If you think I violate your rights, please email me: r.clin.res@gmail.com
5
Agenda: 13 reasons why you will love GNU R
I R is (extremely) cheap. In fact - it's free :)
II R has (extremely) wide range of capabilities
II 1/3 :) R is easy to maintain!
II 2/3 :) R is not resource consuming!
III R is supported by the world of science
IV R is supported by the community
IV ½ :) Books
V R is supported by the business
V ½ :) R and SAS
VI R is able to read data in many formats
VI 1/3 :) R and relational databases
VI 2/3 :) Advanced data manipulation
VII Interoperability is easy to achieve
VIII R is truly cross-platform
IX R offers numerous ways of presenting data. Reproducible Research
IX 1/3 :) Tables. Clinical Tables.
IX 2/3 :) Graphics – all have waited for this moment :)
X There are many options to optimize the code
XI R is able to handle large amount of data
XII R has a set of fancy tools and IDEs
XIII FDA: R is OK for drug trials! - it should start from this slide :)

7
IntRoduction
8
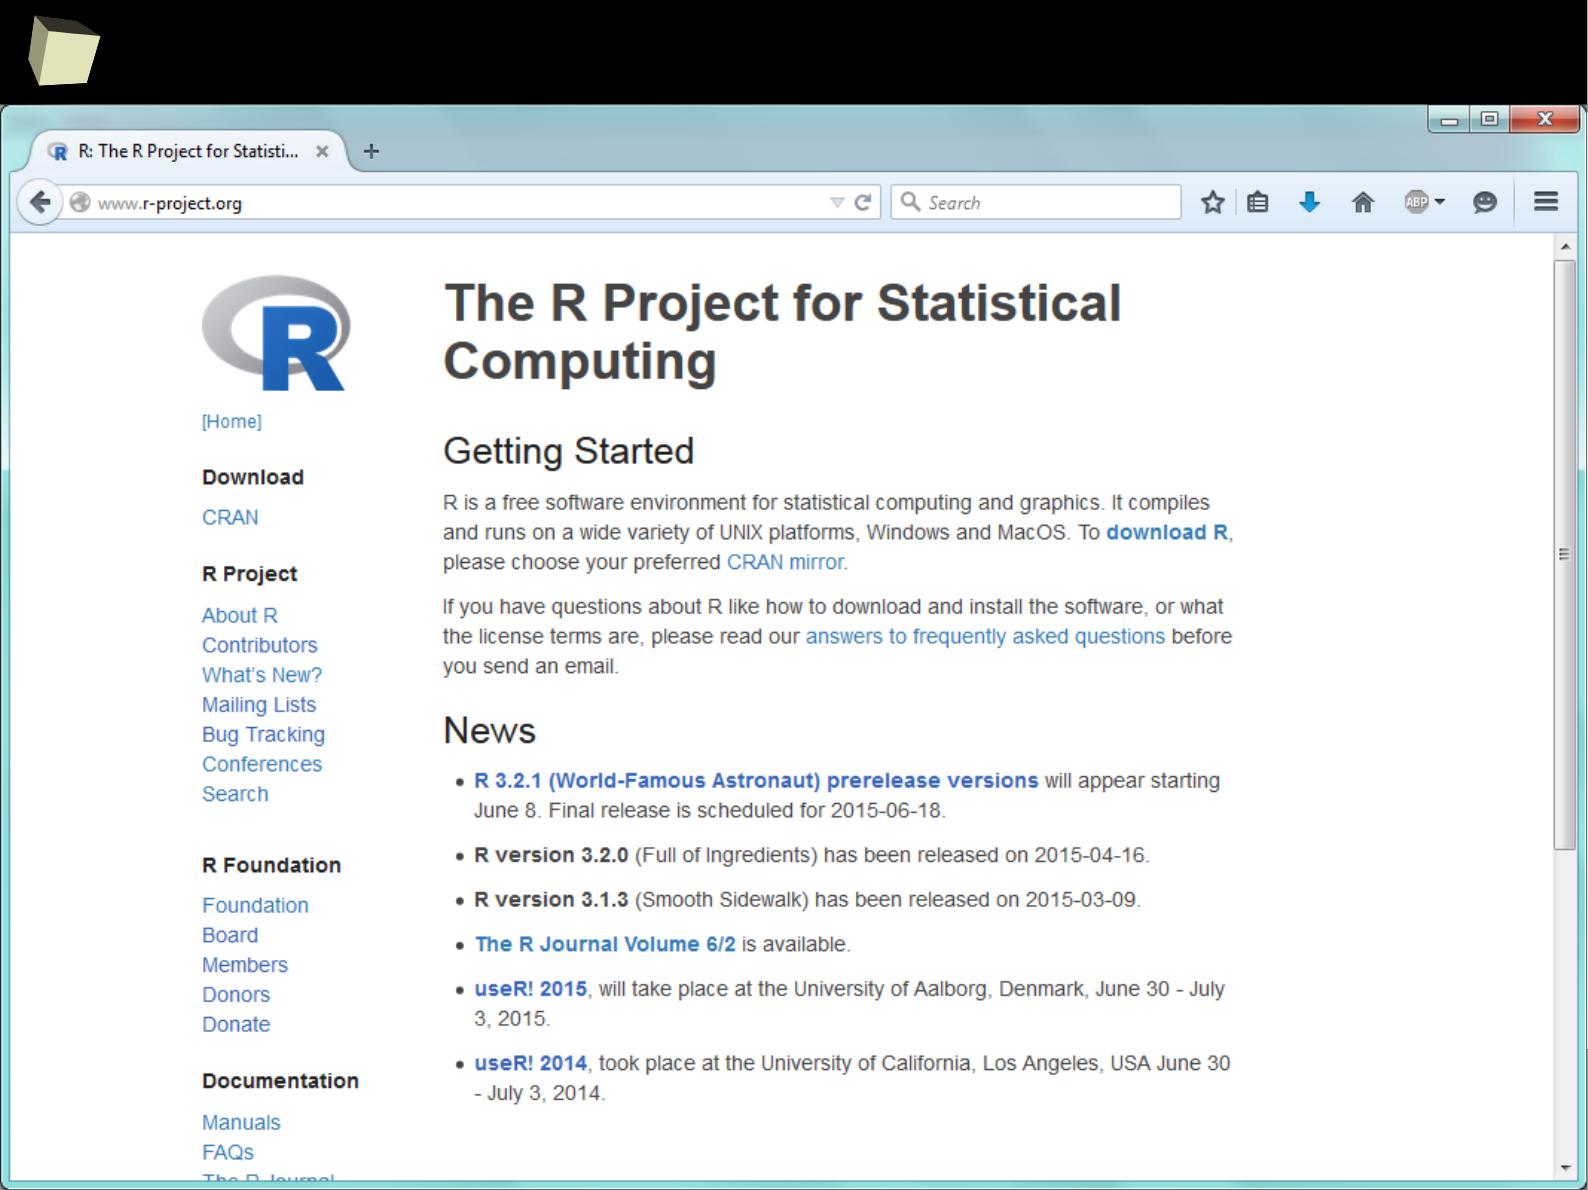
...so, what is “R”?
In simply words, R is a free software environment for statistical computing, data
manipulation and charting, widely used in the scientific world. It is also the
name of a high-level, interpreted programming language.
R
(the successor of S)
was created in 1992 by Ross Ihaka and Robert Gentleman at
University of Auckland. Now it is developed by the R Development Core Team.
http://www.r-project.org
9
is it a popular softwaRe ?
[…] R is also the name of a popular programming language used by
a growing number of data analysts inside corporations and
academia. It is becoming their lingua franca partly because data
mining has entered a golden age, whether being used to set ad
prices, find new drugs more quickly or fine-tune financial models.
Companies as diverse as Google, Pfizer, Merck, Bank of America,
the InterContinental Hotels Group and Shell use it.
Data Analysts Captivated by R’s Power (The New York Times)
http://tinyurl.com/captivated-by-r

1
0
...so, what is “R”?
Short characteristics:
●
Description: computational environment + programming language
●
Developer: R Development Core Team
●
Operating systems: cross-platform: Windows, Unix, Linux, Linux-based “mobile“ OS:
(Android, Maemo, Raspbian), Mac OS X
●
Form: command line + third-party IDEs and editors
RStudio, RCommander, etc.
●
Infrastructure: R core library + shell + libraries (base and third-party)
●
Model of work: 1) standalone application, 2) standalone server, 3) server process
●
Programming lang.: interpreted, high-level with dynamic typing; debugger onboard
●
Paradigm: 1) array, 2) object-oriented, 3) imperative, 4) functional,
5) procedural, 6) reflective
●
Source of libraries: central, mirrored repository – CRAN; users' private repositories,
third-party repositories (Github, Rforge), other sources
●
License of the core: GNU General Public License ver. 2
●
License of libraries: 99.9% open-source, rest – licensed (free for non-commercial use)
http://www.r-project.org
1
2
The R family
S
S
Spotfire S+
Spotfire S+
formerly S-PLUS
GNU R
GNU R
REVO
REVO
lution
lution
(bought by Microsoft in 2015)
Commercial + Free (GPL v2)
http://www.revolutionanalytics.com
AT&T/ Bell Laboratories
Date of foundation: 1976, 1998
John Chambers, Rick Becker, Allan Wilks
http://ect.bell-labs.com/sl/S
TIBCO Software Inc.
Date of foundation: 2010
License: Commercial
http://spotfire.tibco.com
What's new in version 8.1
University of Auckland
Date of foundation: 1993
Robert Gentleman, Ross Ihaka
License: GNU GPL v2
http://www.r-project.org
In 1998, S became the first statistical system
to receive the Software System Award, the
top software award from the ACM
RStudio
RStudio
Commercial
+ Free (AGPL v3)
http://www.rstudio.com
Oracle R
Oracle R
Commercial + Free
http://www.oracle.com...

1
3
did you know, that...
http://blog.revolutionanalytics.com/2014/04/seven-quick-facts-about-r.html
Seven quick (and cool) facts about R
April 2014
(1) R is the highest paid IT skill
1
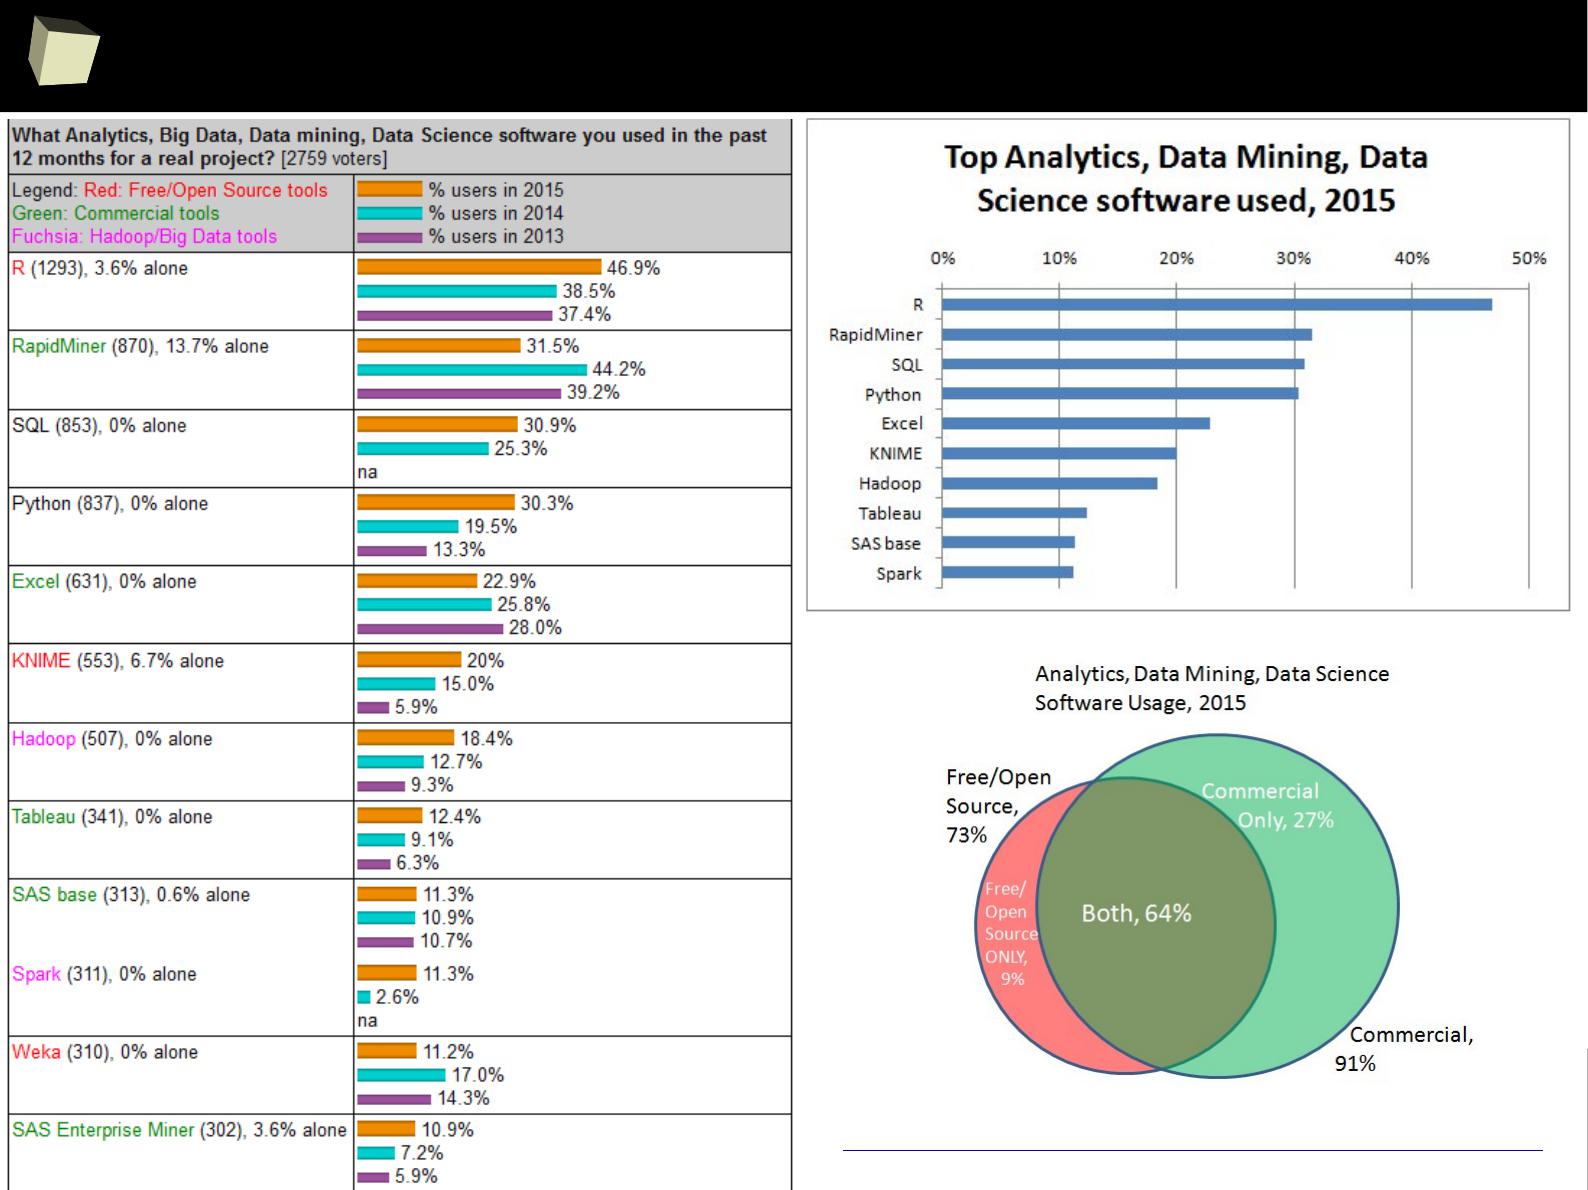
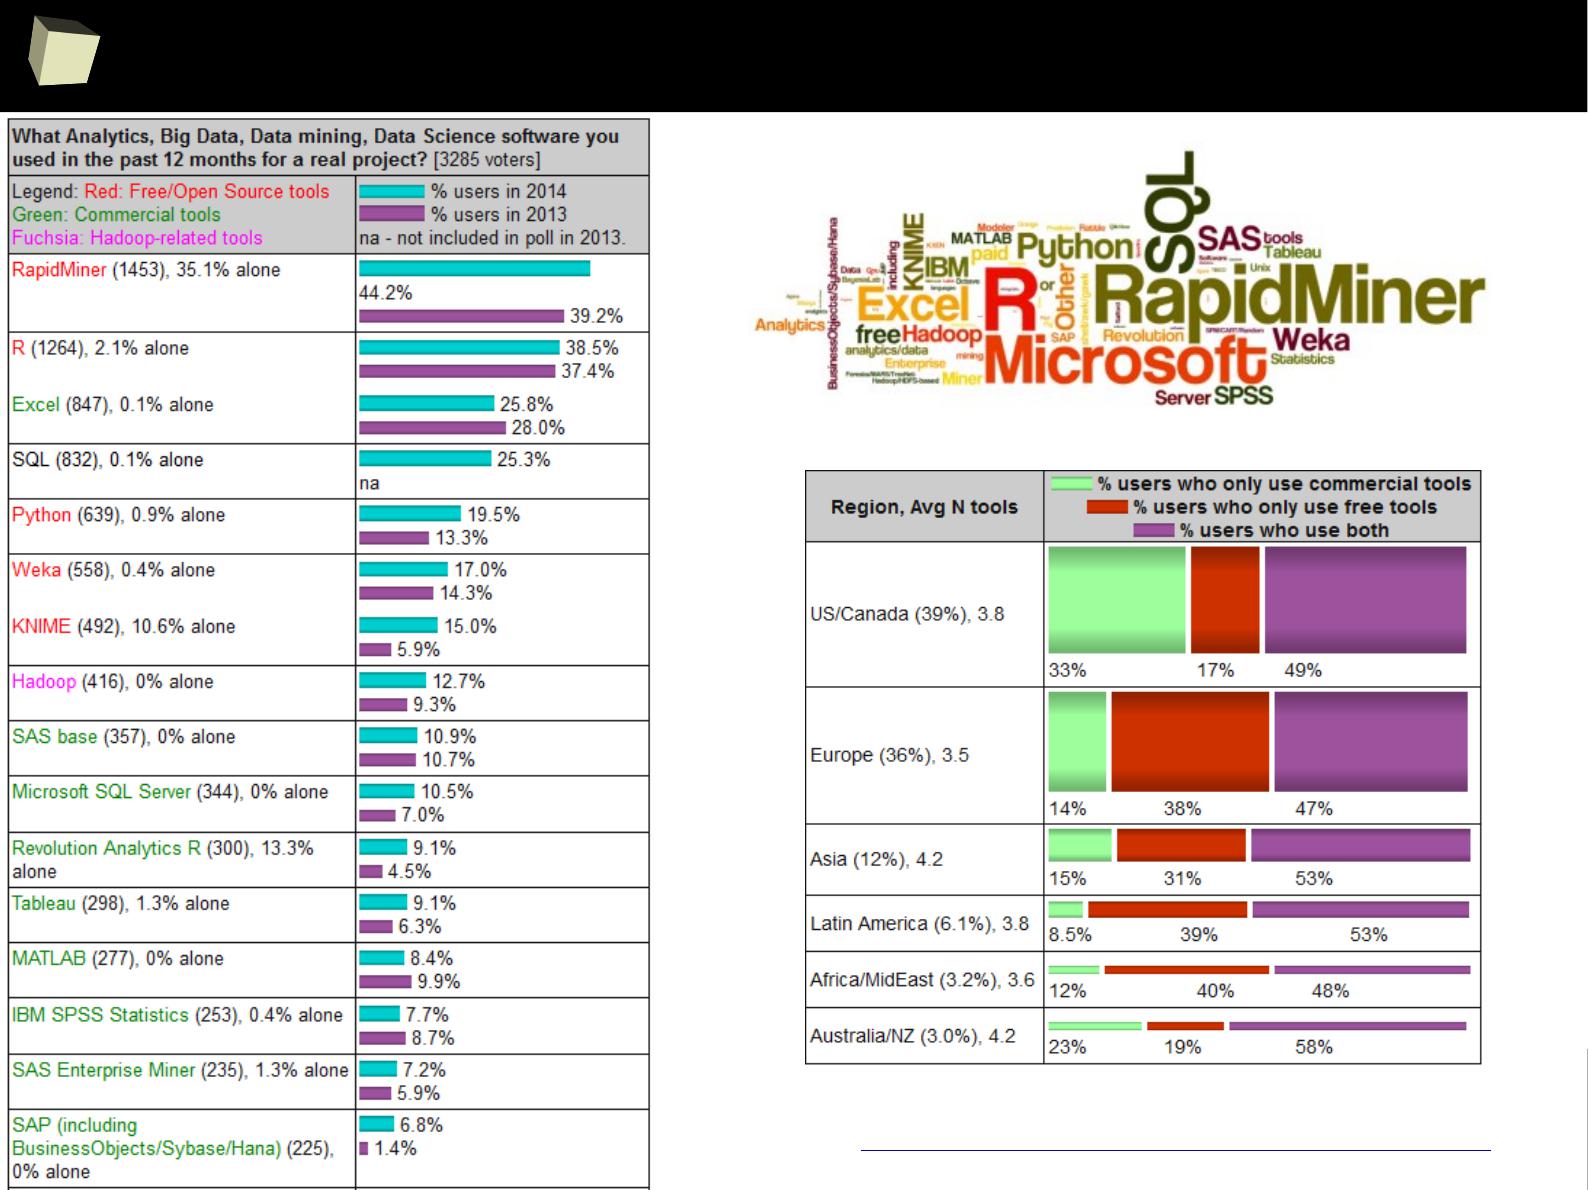
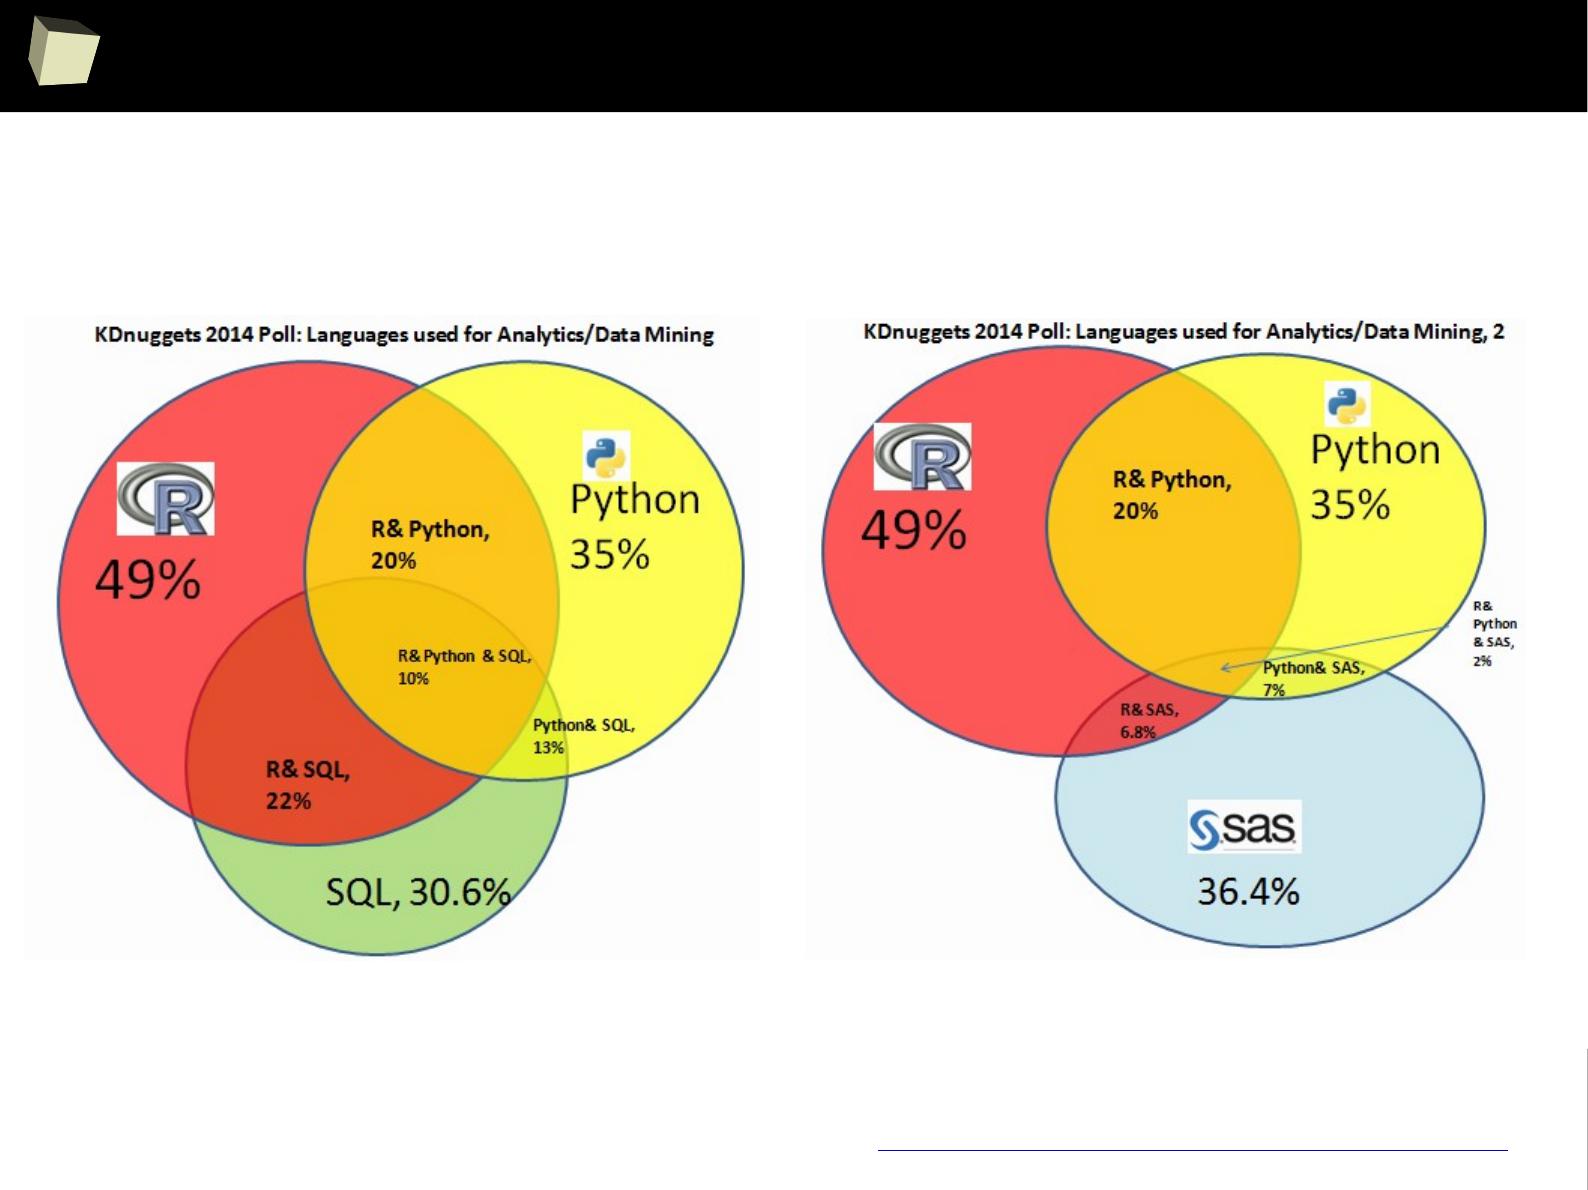
(2) R is most-used data science language after SQL
2
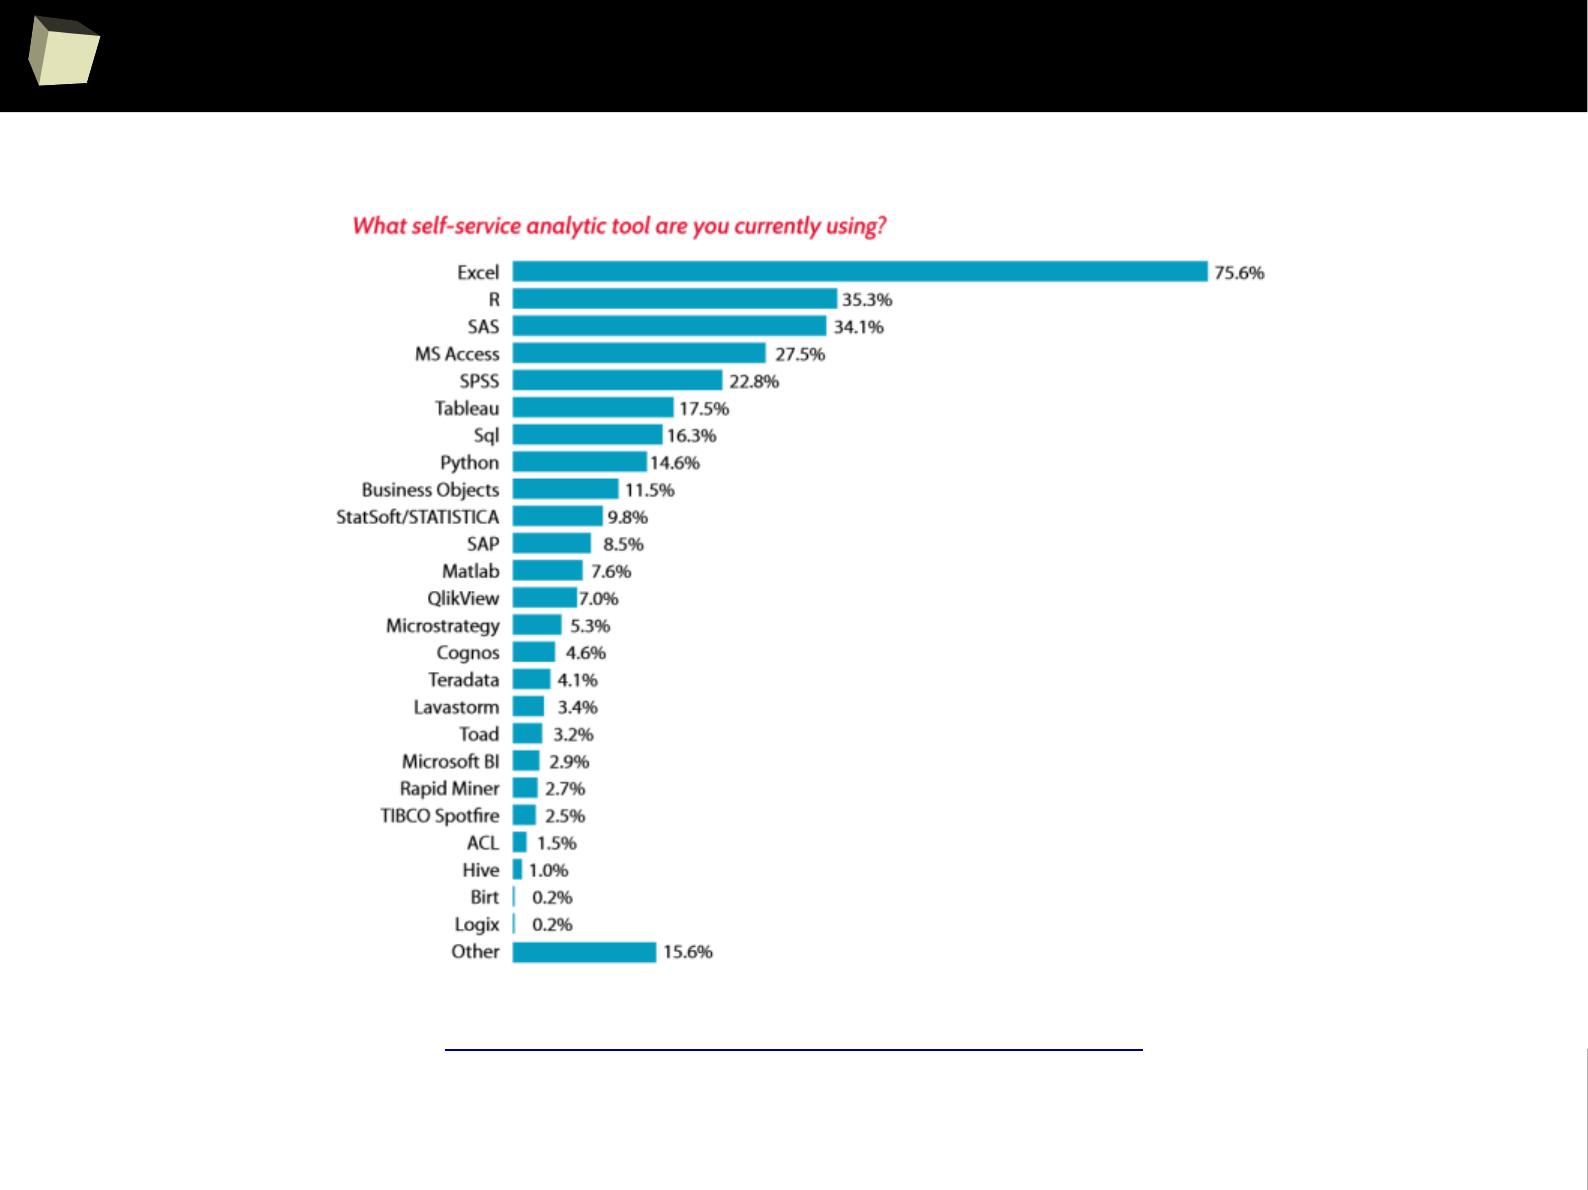
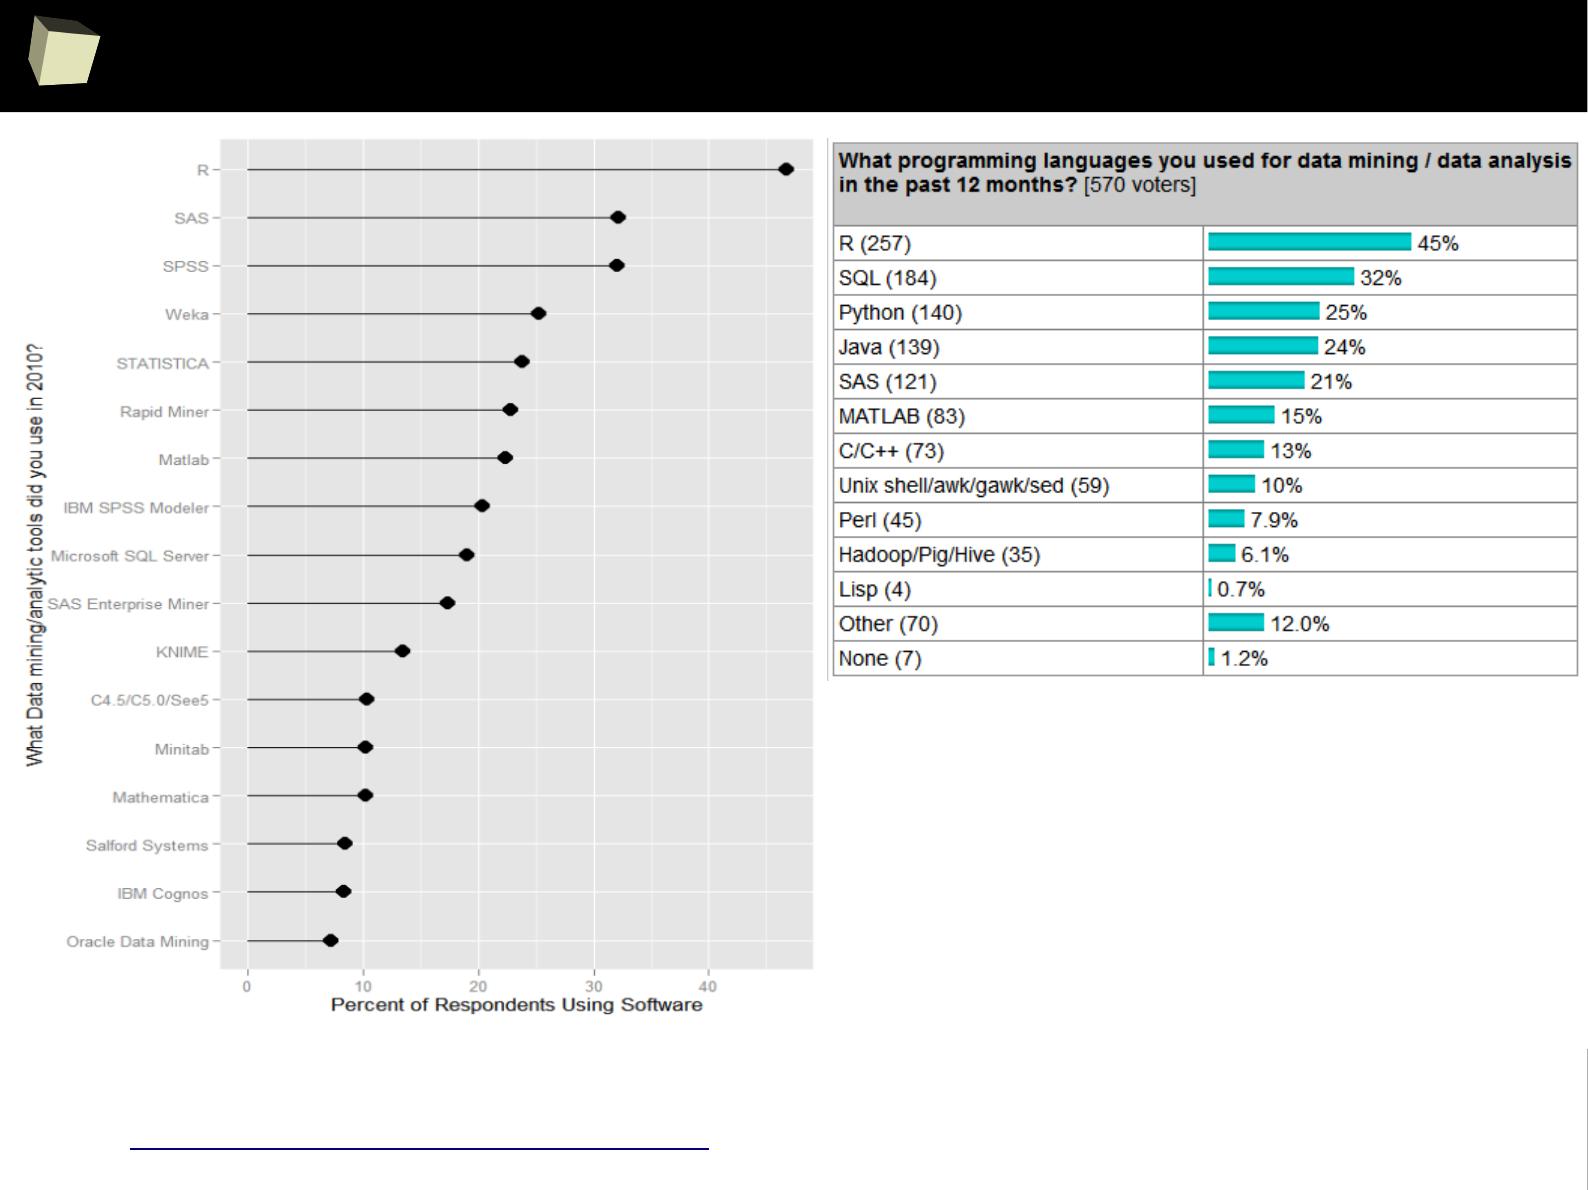
(3) R is used by 70% of data miners
3
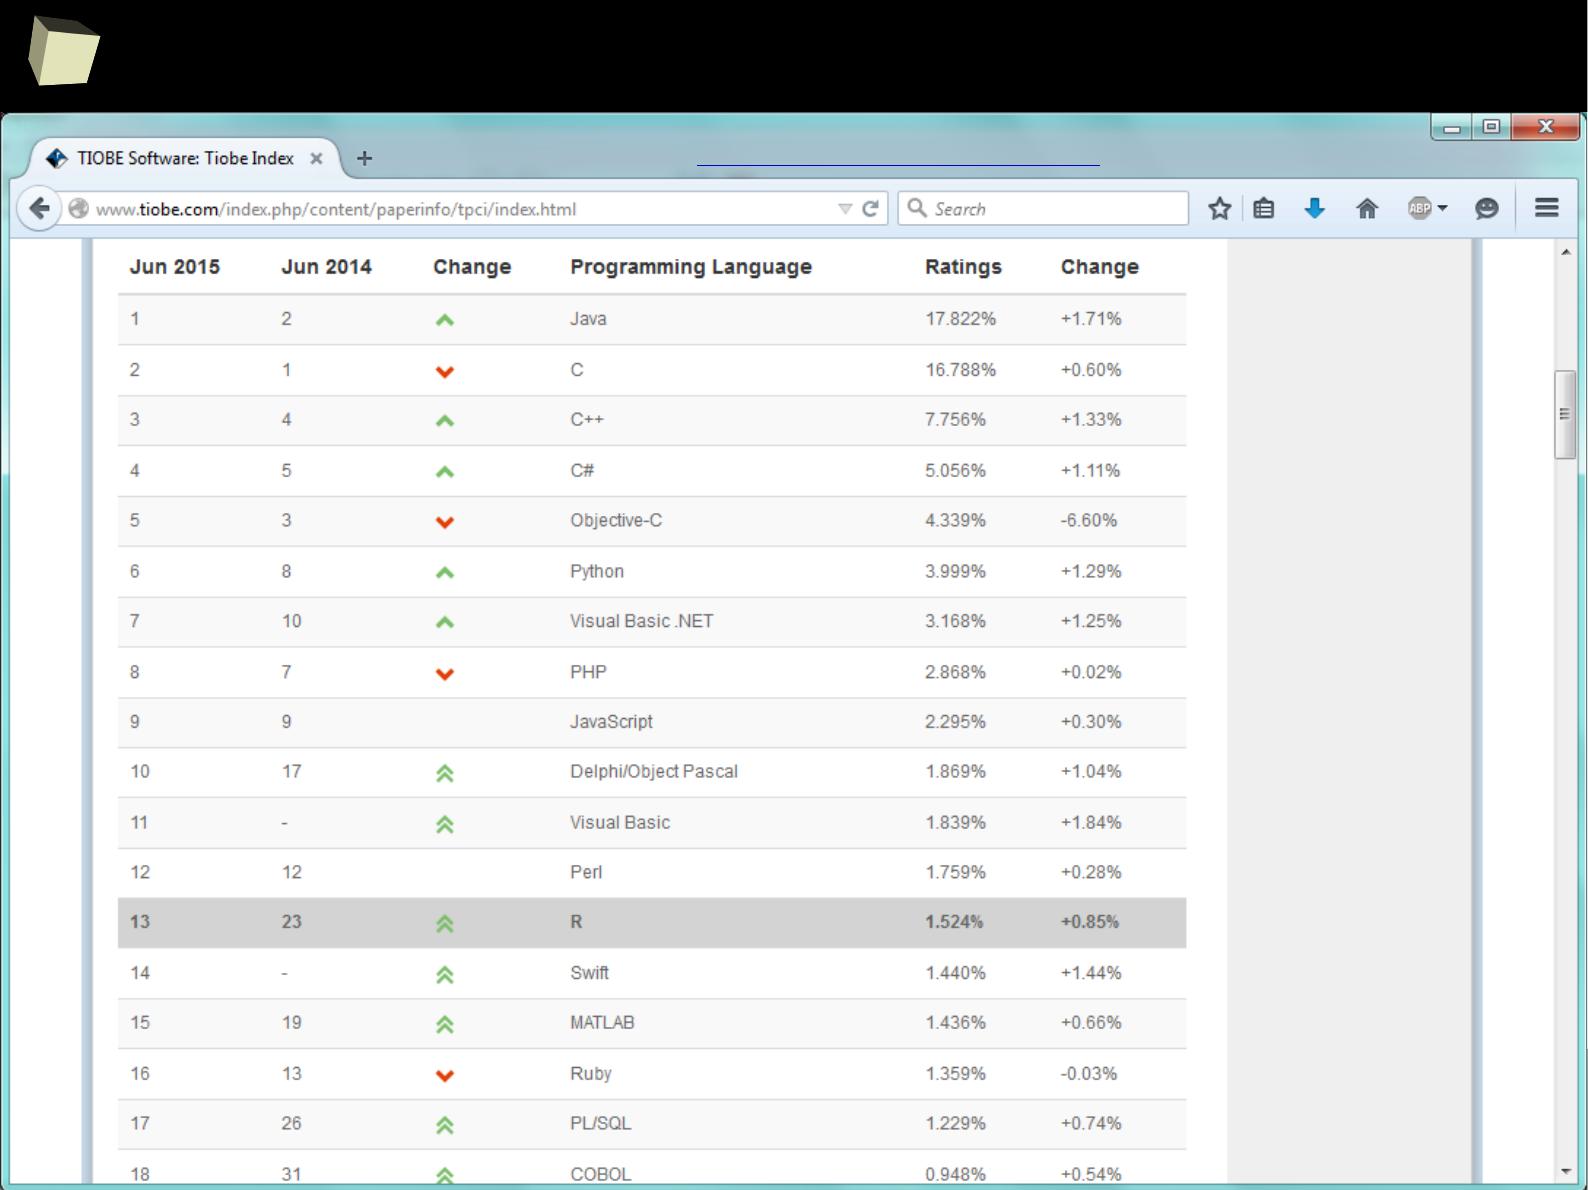
(4) R is #15 of all programming languages
4
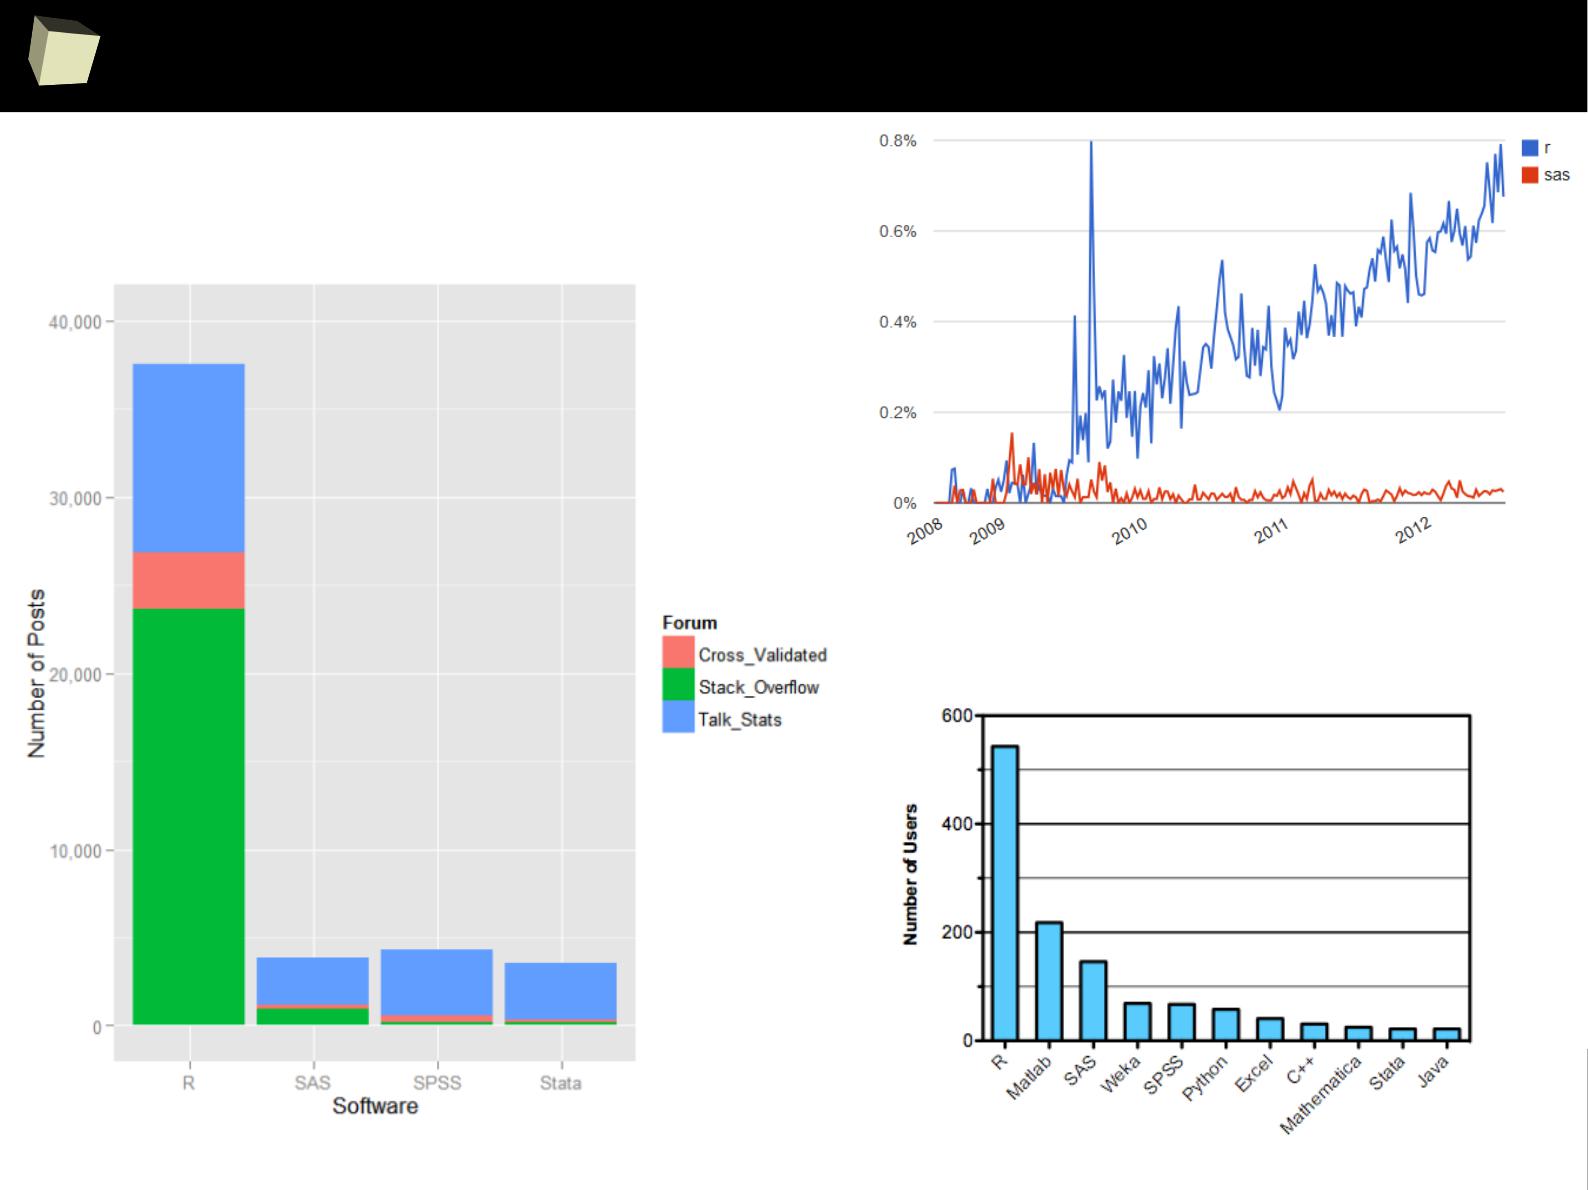
(5) R is growing faster than any other data science language
5
(6) R is the #1 Google Search for Advanced Analytic software
6
(7) R has more than 2 million users worldwide
7
1. Dice.com survey, January 2014
2. O'Reilly survey, January 2014
3. Rexer survey, October 2013
4. RedMonk language rankings, January 2014
5. KDNuggets survey, August 2013
6. Google Trends, March 2014
7. Oracle estimate, February 2012

1
4
List of R users


1
6
A word about the list of UseRs
The list is built based exclusively on publicly available information:
●
lists of users provided by Revolution, RStudio and others
●
articles (example, example) and interviews (example)
●
published documents in which a name of a company is visible (example)
●
job advertisements
●
names of companies supporting / organizing events (conferences, courses)
That is to say, a logo of a company is included in the list only if there is a
strong evidence that the company uses or supports (or used or supported) R,
based on information shared on the Internet – and thus available for everyone.
Please note, that I am not aware if all listed companies are still using any
version of R at the time the presentation is being viewed.

1
7
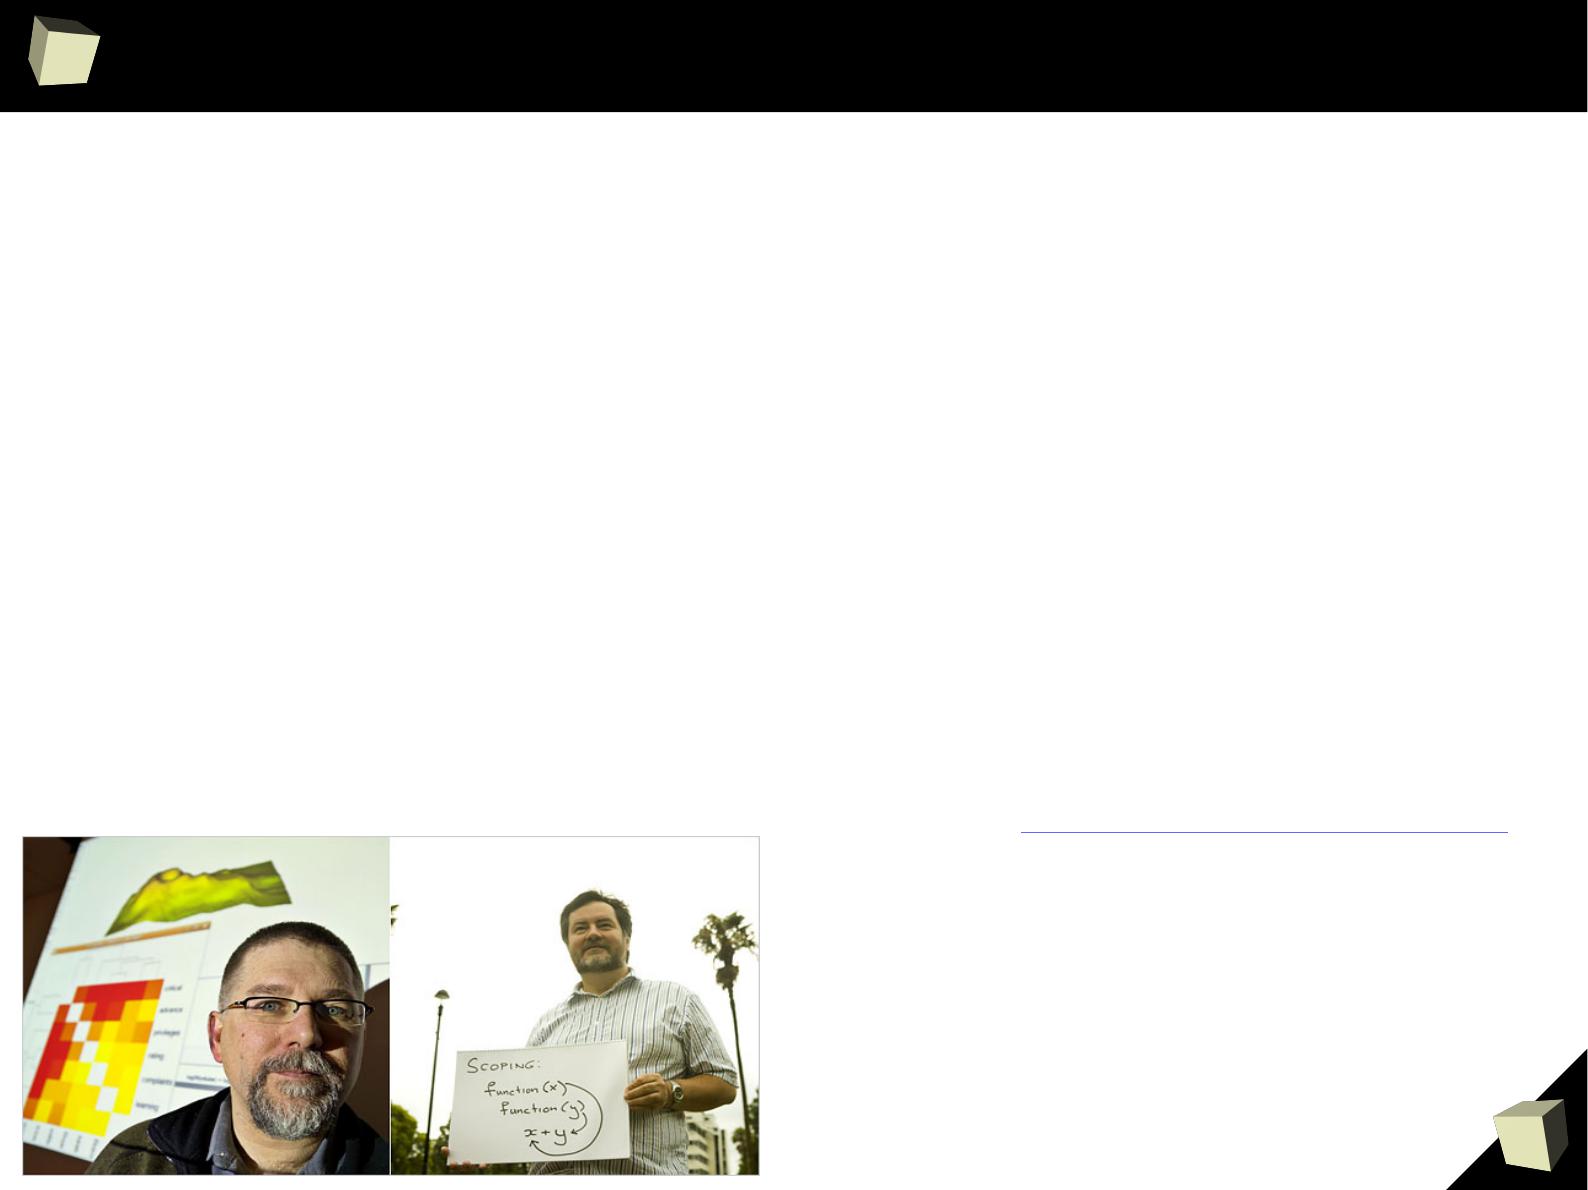
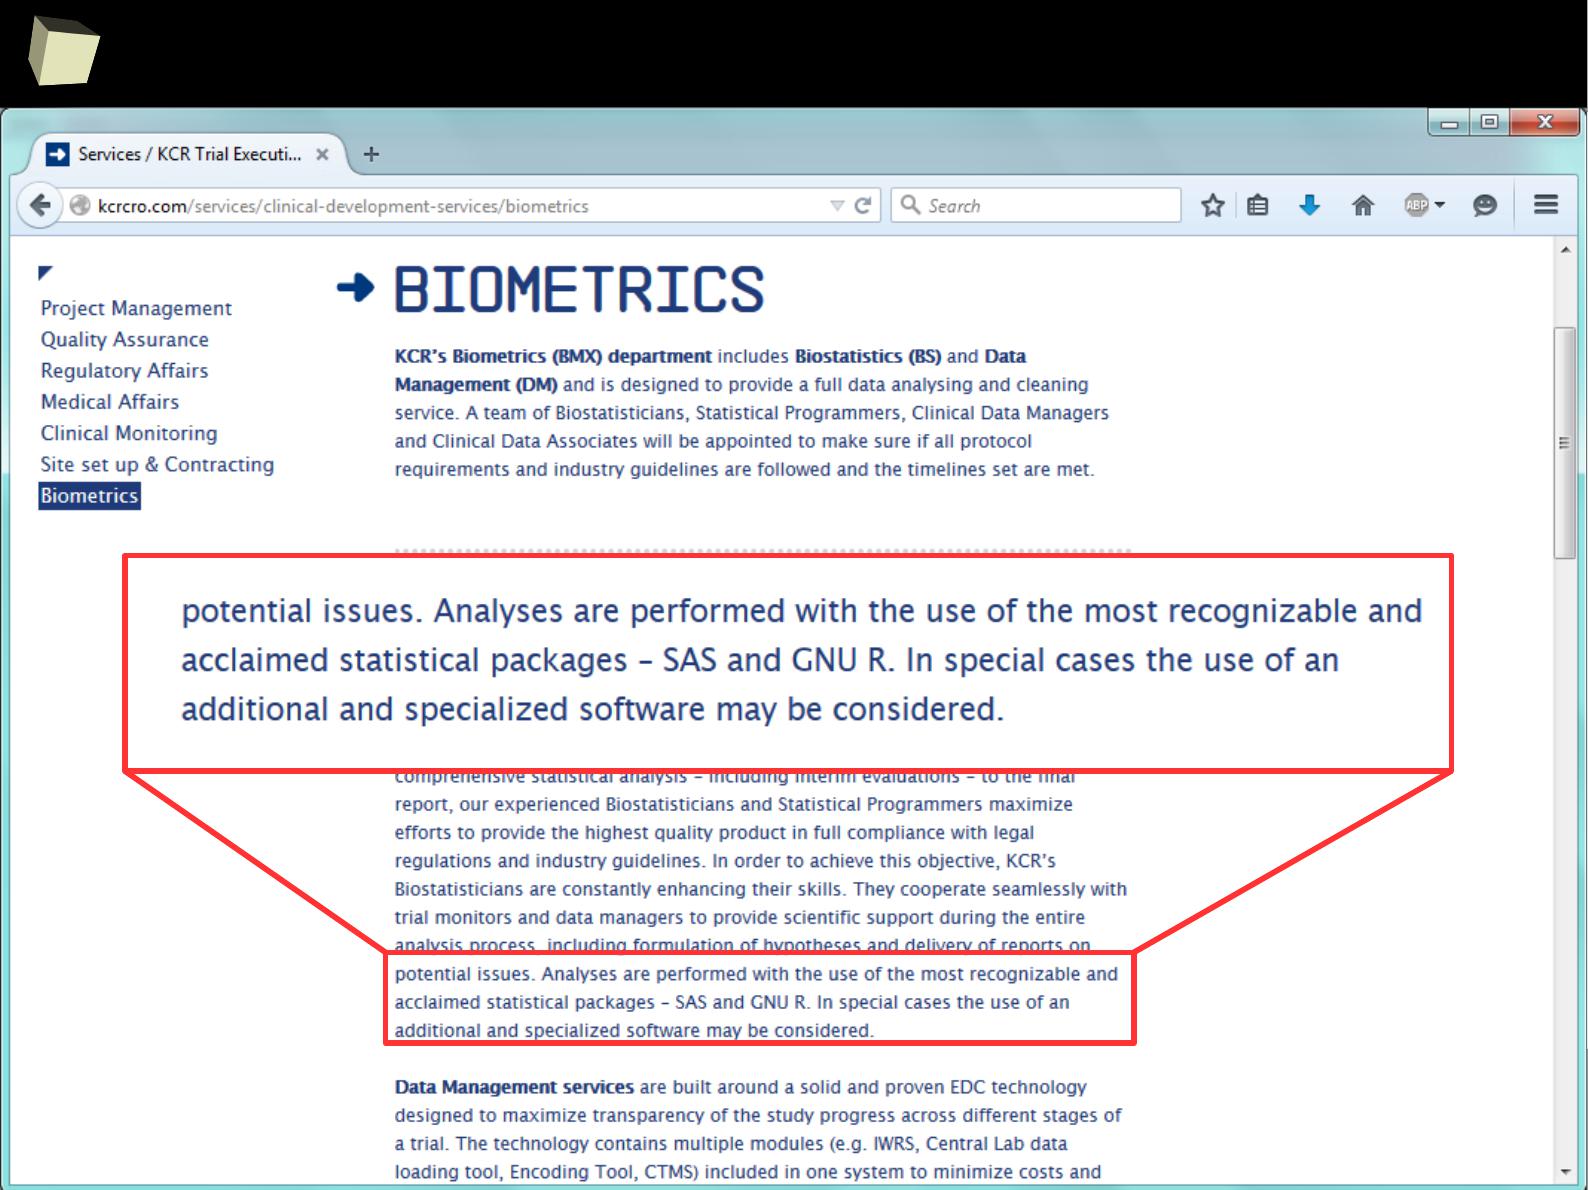
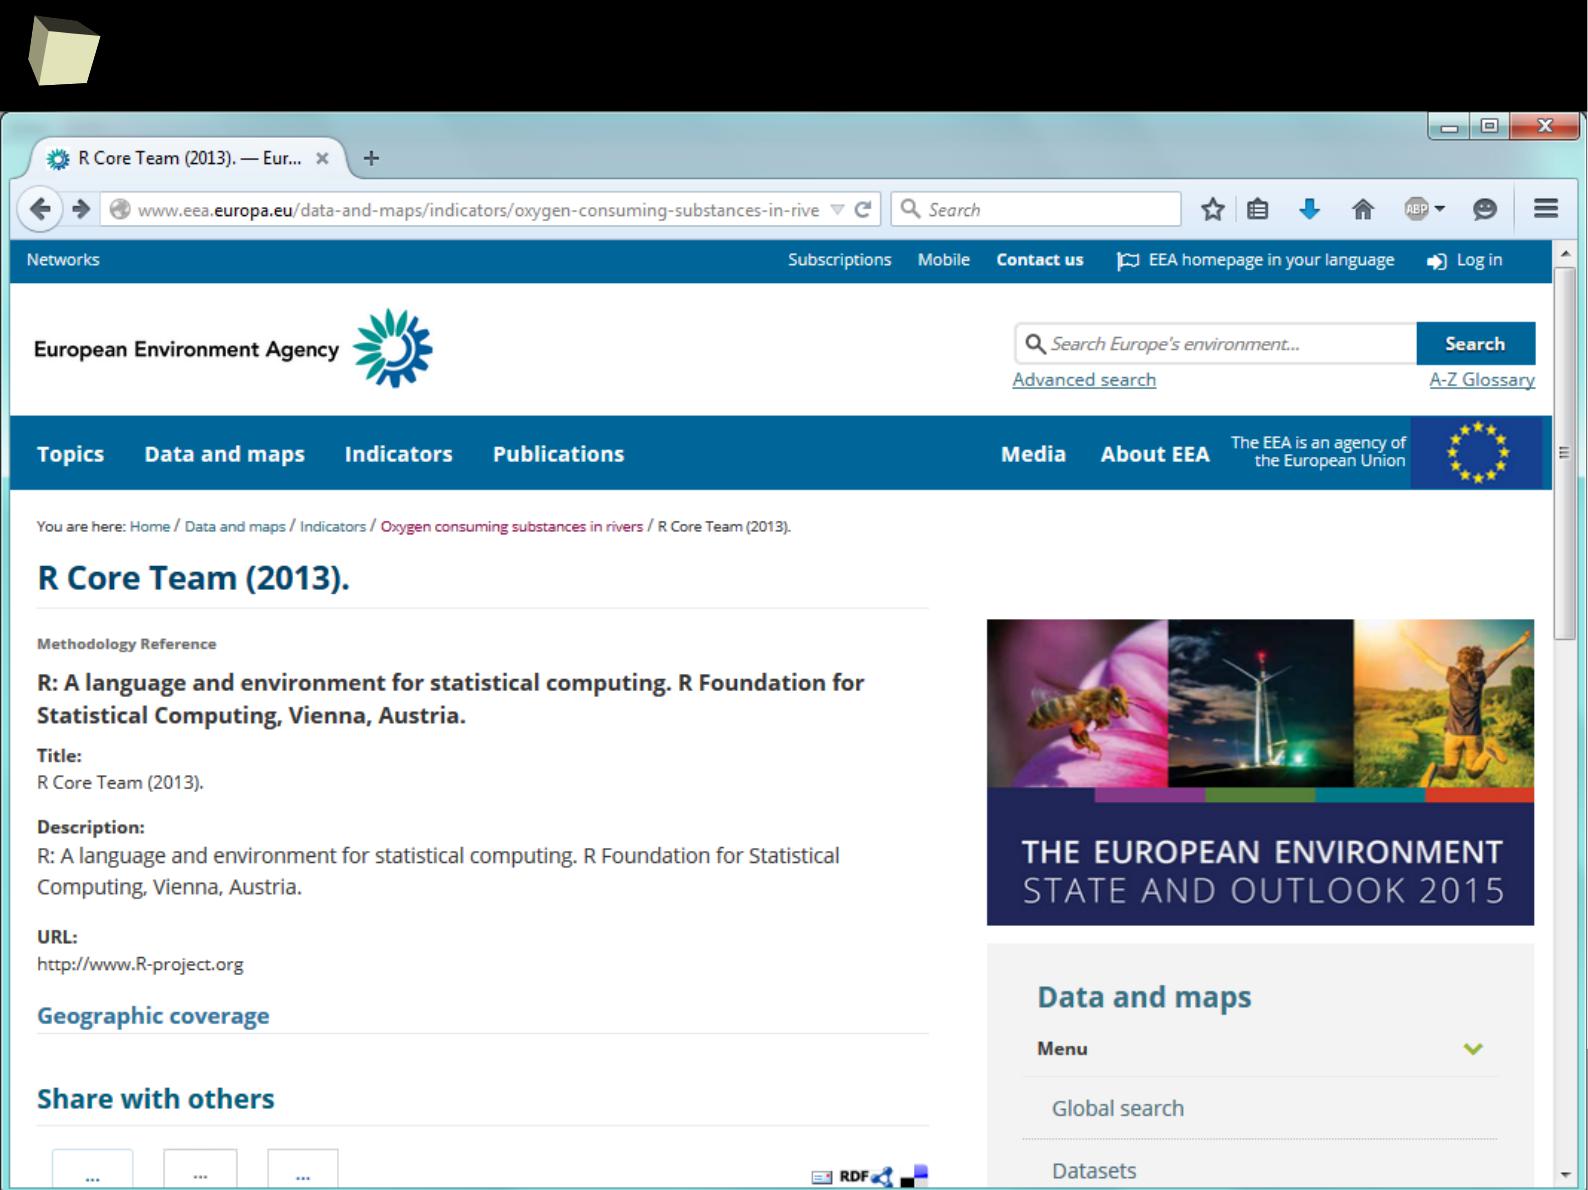
They use R
“We use R for adaptive designs frequently because it’s the fastest tool to
explore designs that interest us. Off-the-shelf software, gives you off-the-
shelf options. Those are a good first order approximation, but if you really
want to nail down a design, R is going to be the fastest way to do that.”
Keaven Anderson
Executive Director Late Stage Biostatistics,
Merck
http://www.revolutionanalytics.com/content/merck-optimizes-clinical-drug-development...
1
8
They use R
1
9
They use R
2
0
They use R
2
1
They use R
so...
2
2
They use R
2
3
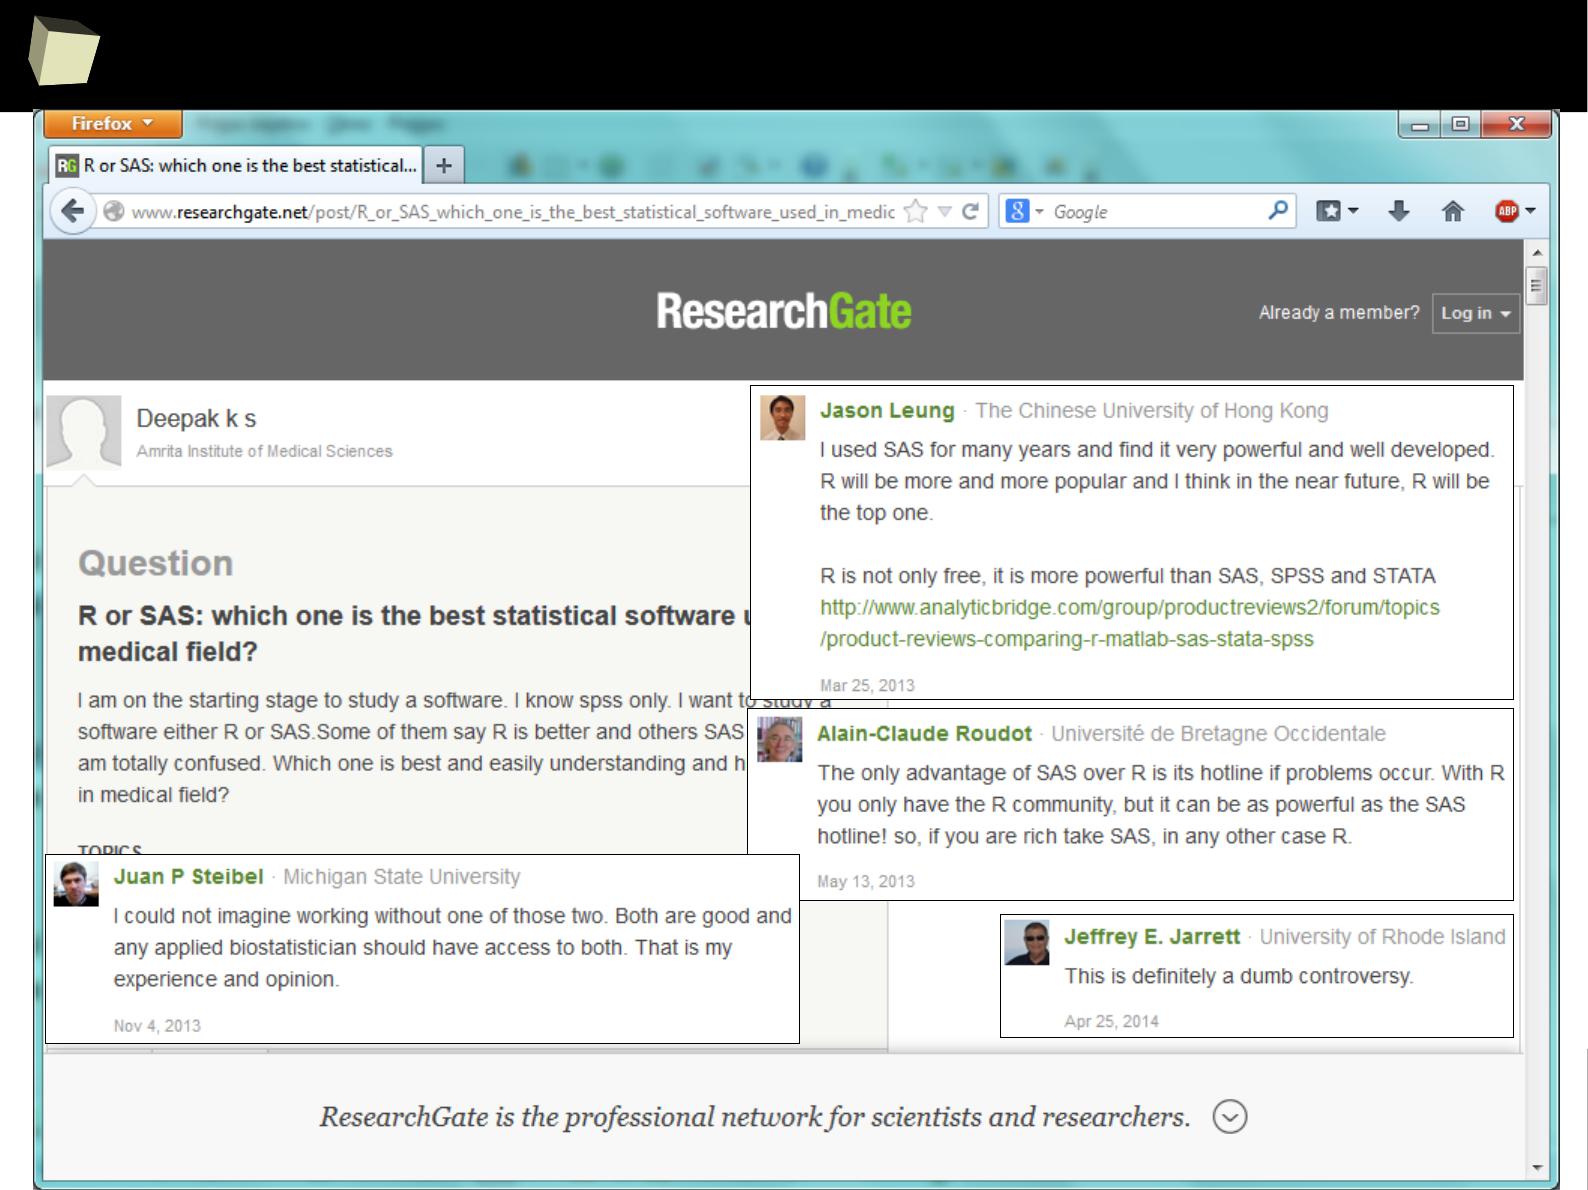
In many discussions some praise SAS, others STATA or SPSS.
But most of them refer to R with respect.

2
4
Is R a popular software?
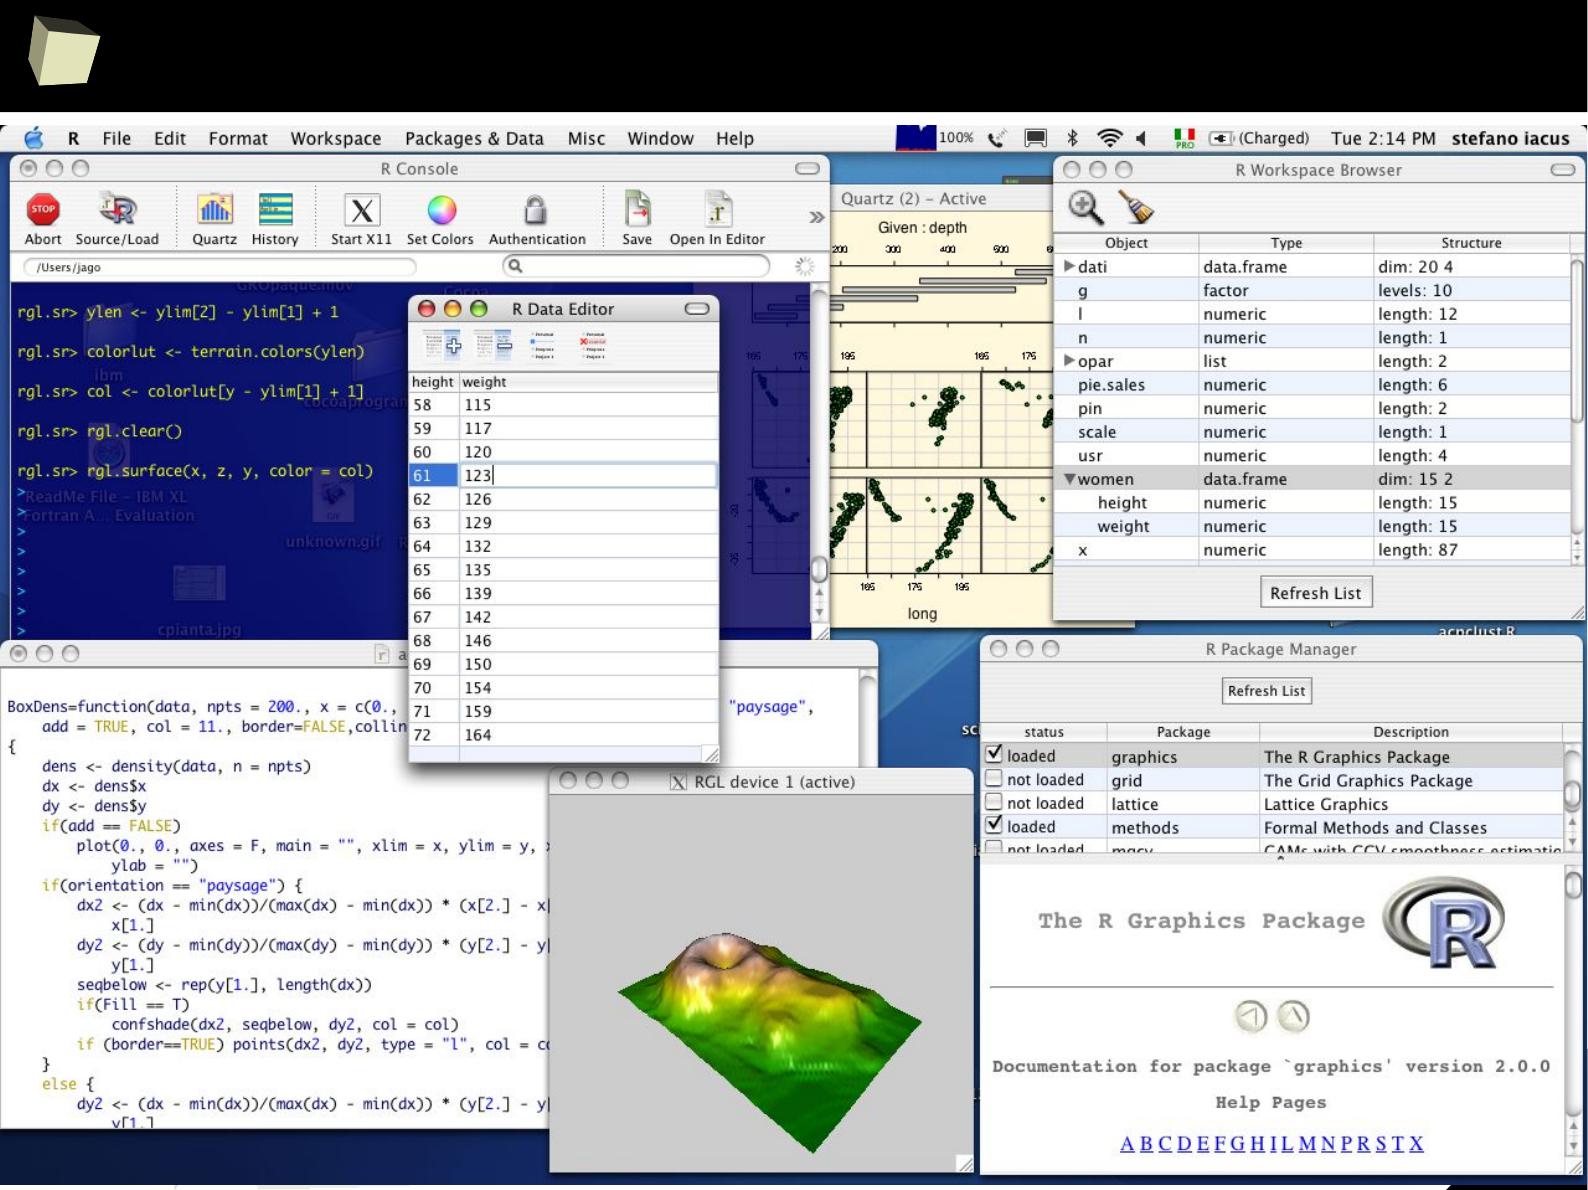
3
2
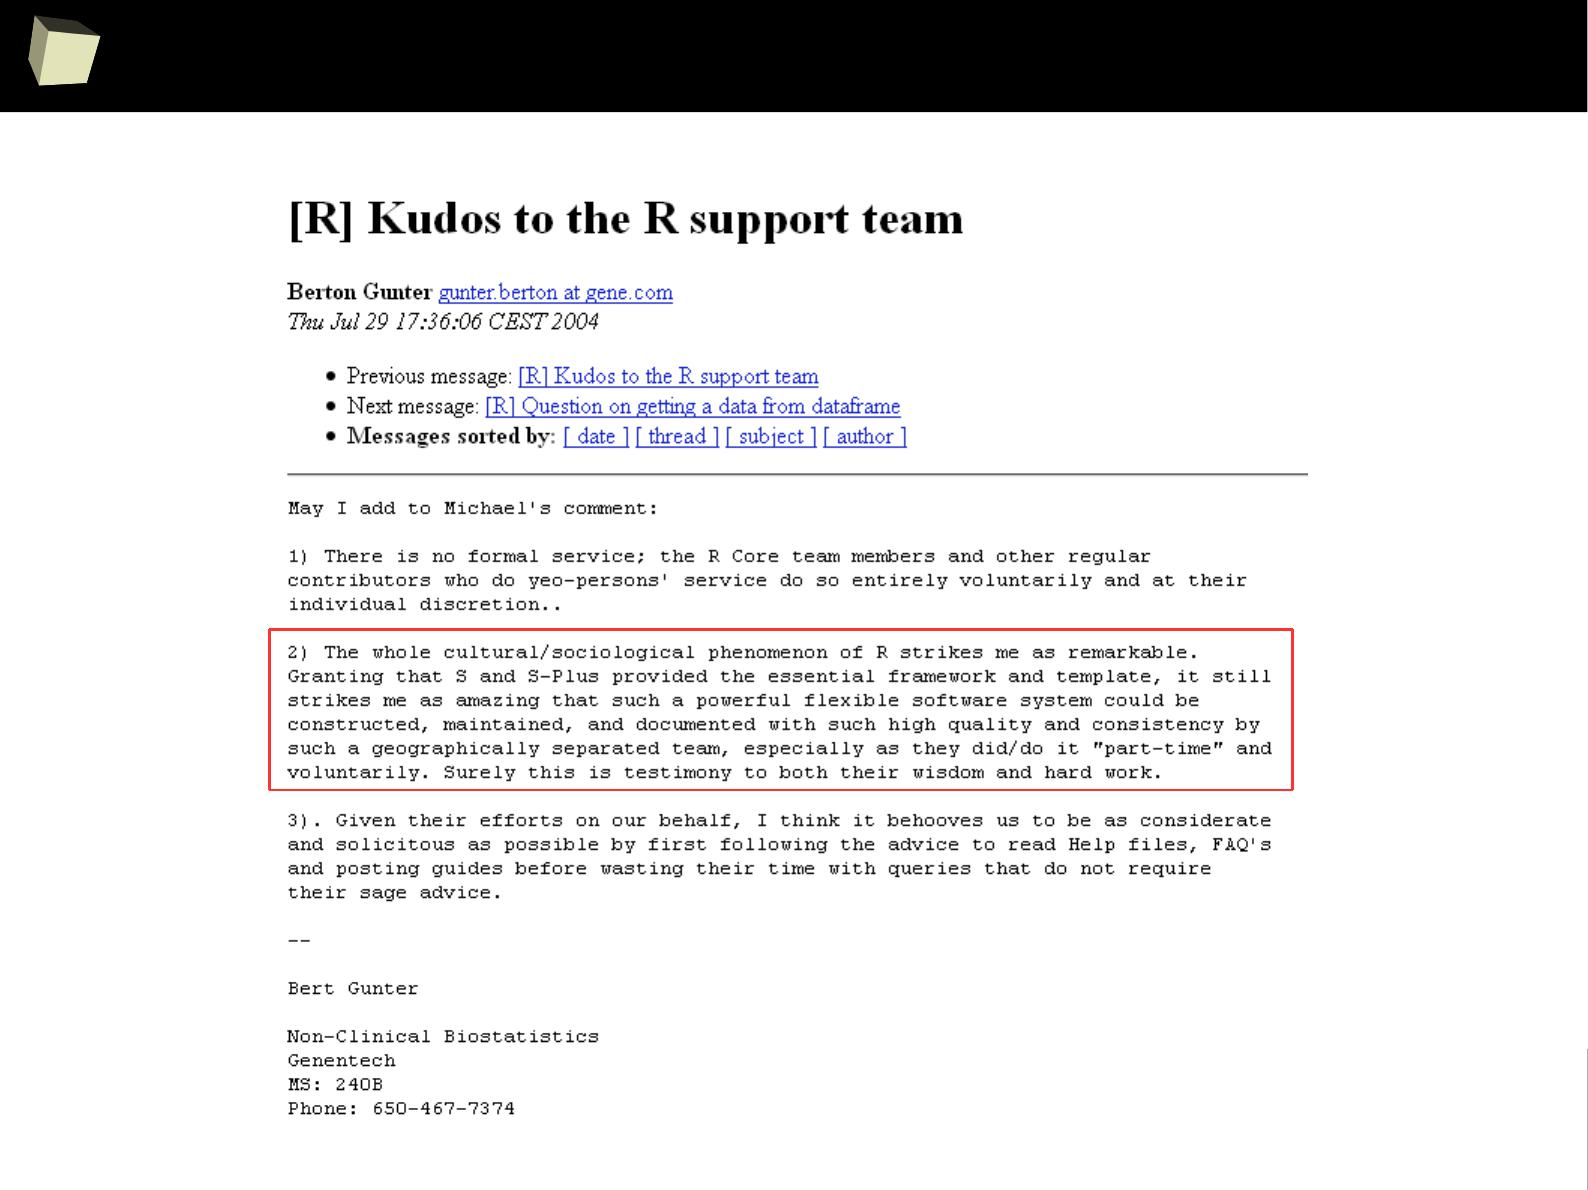
Ancient history: R was already popular in 2004

3
3
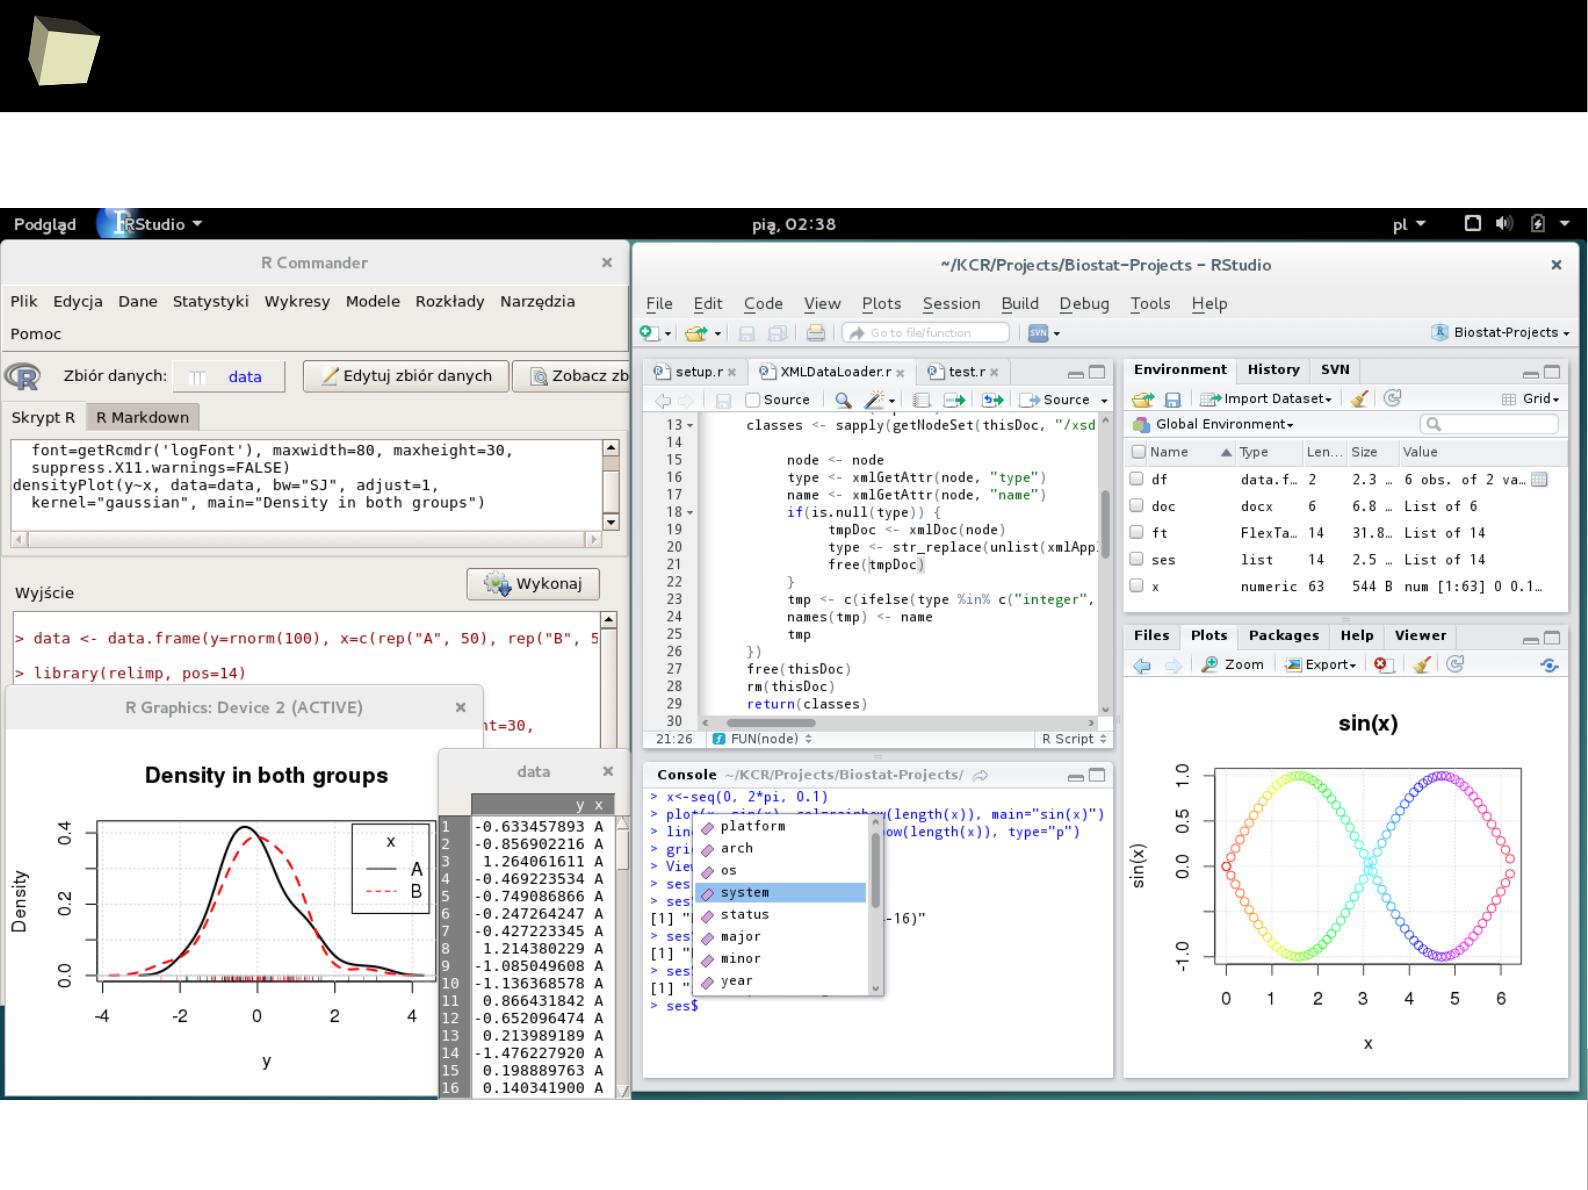
Demonstrative screenshots
3
4
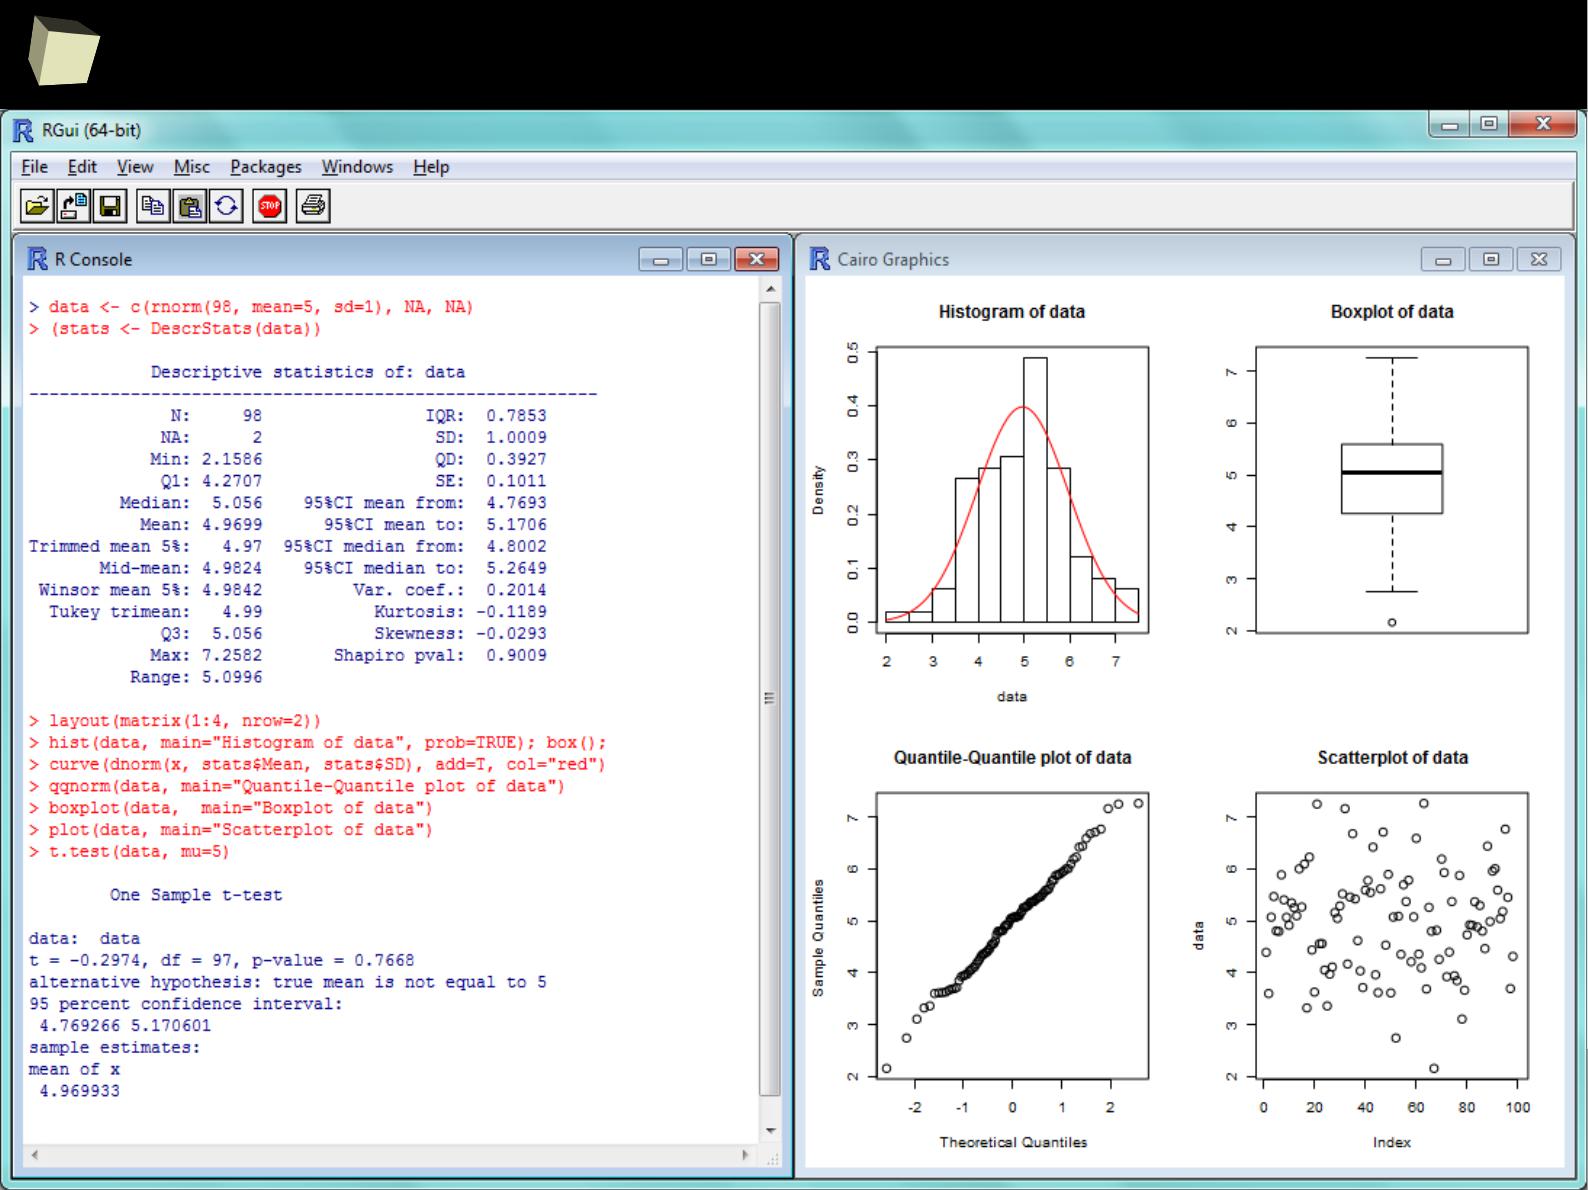
fiRst insight: the main program window
3
5
...some quick'n'dirty data inspection...
3
6
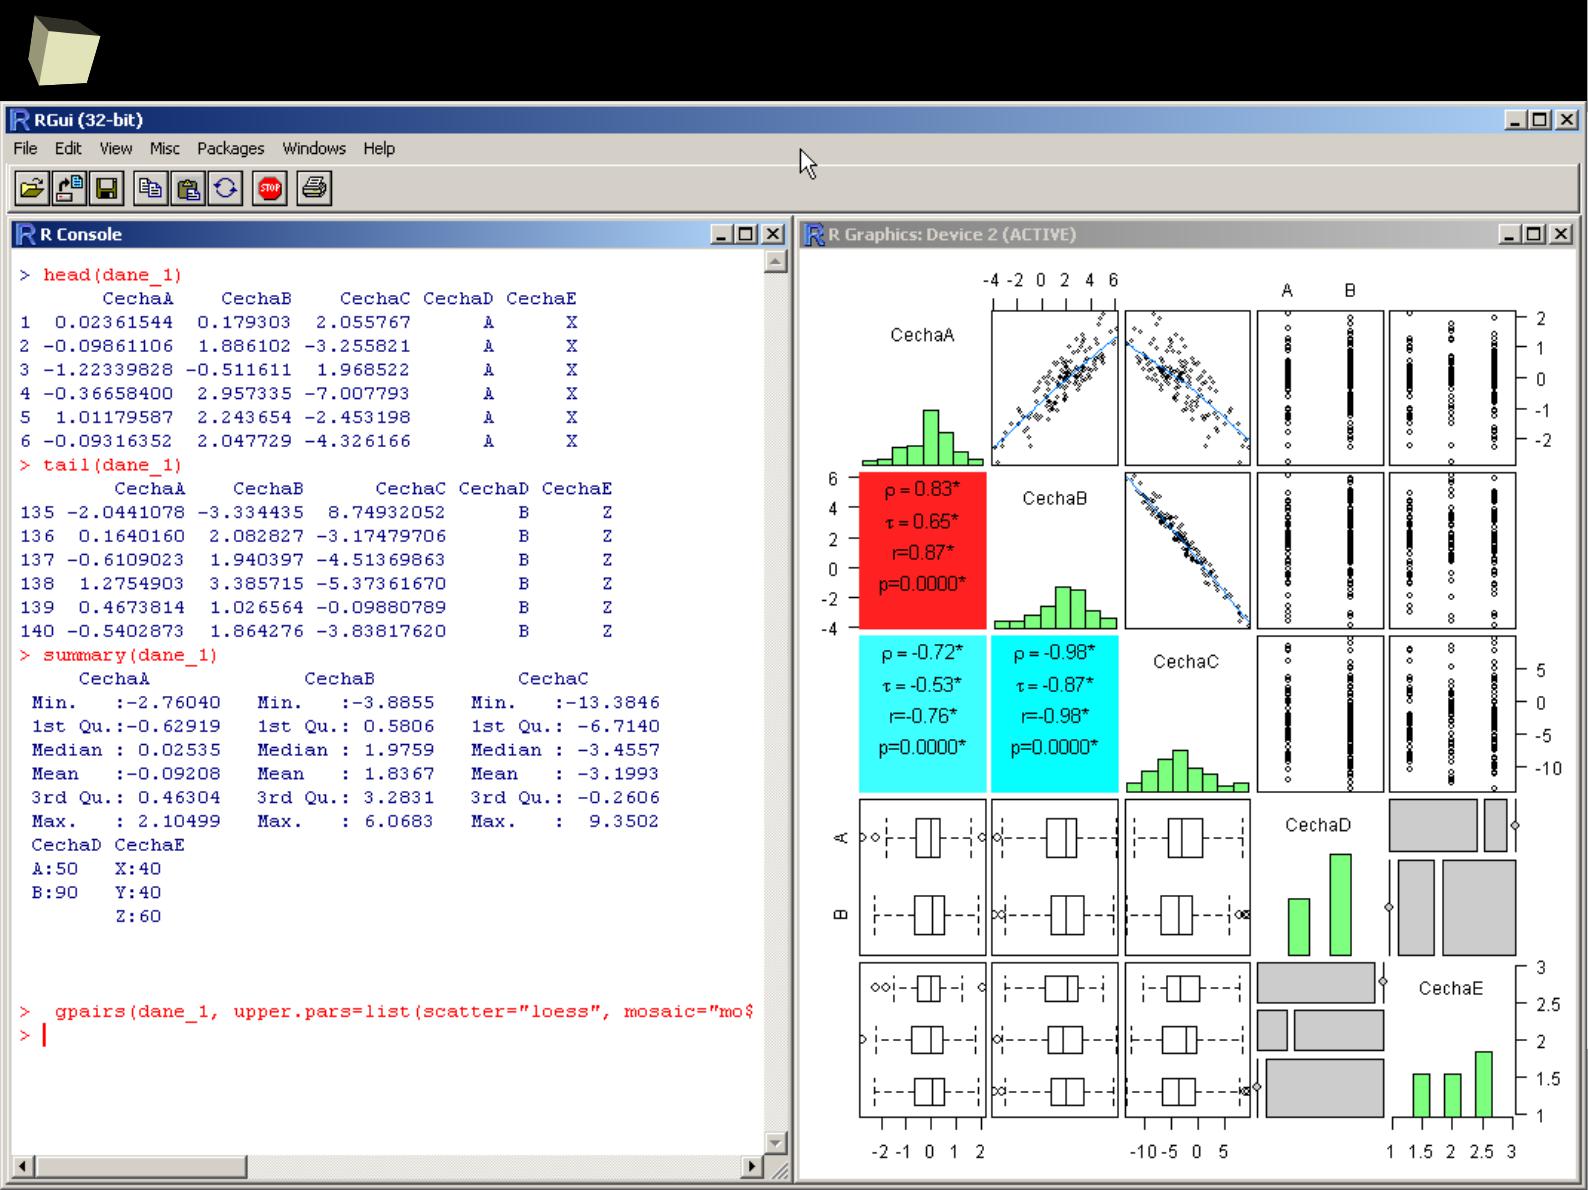
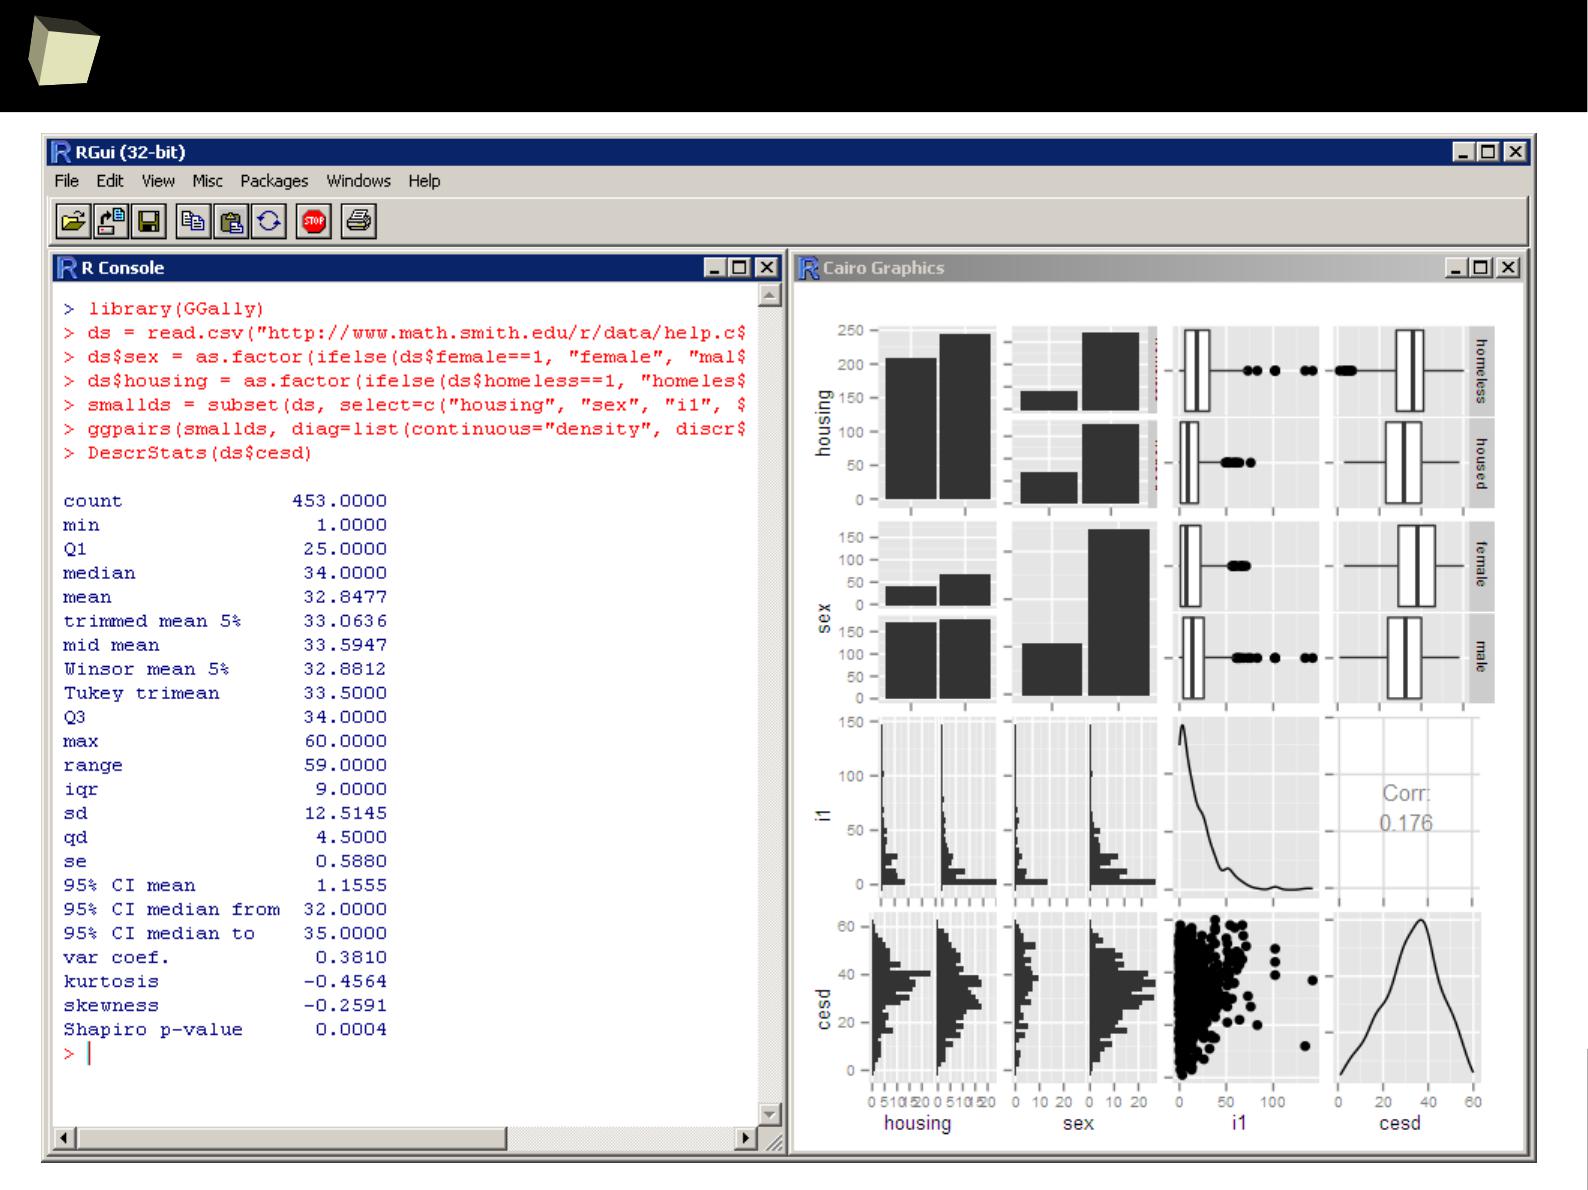
...quick'n'dirty data inspection other way...
3
7
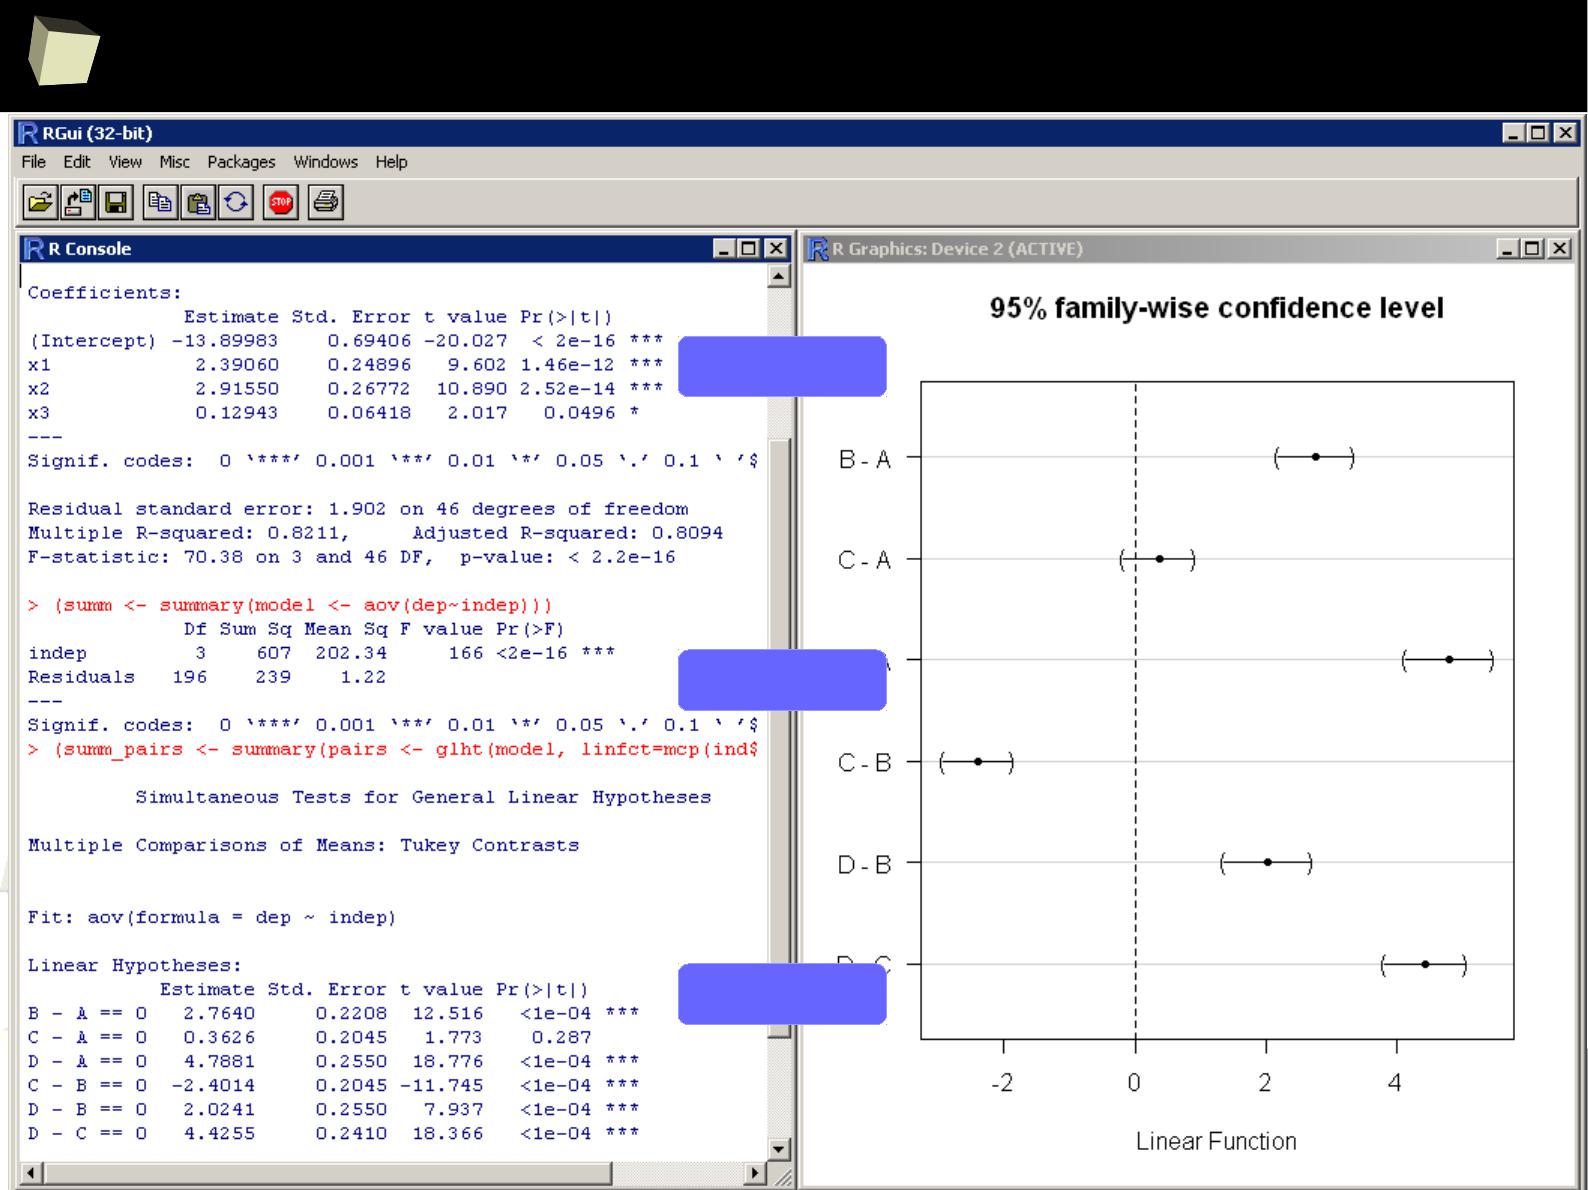
...some linear modeling...
< Linear regression
< ANOVA
< Post-hoc >
3
8
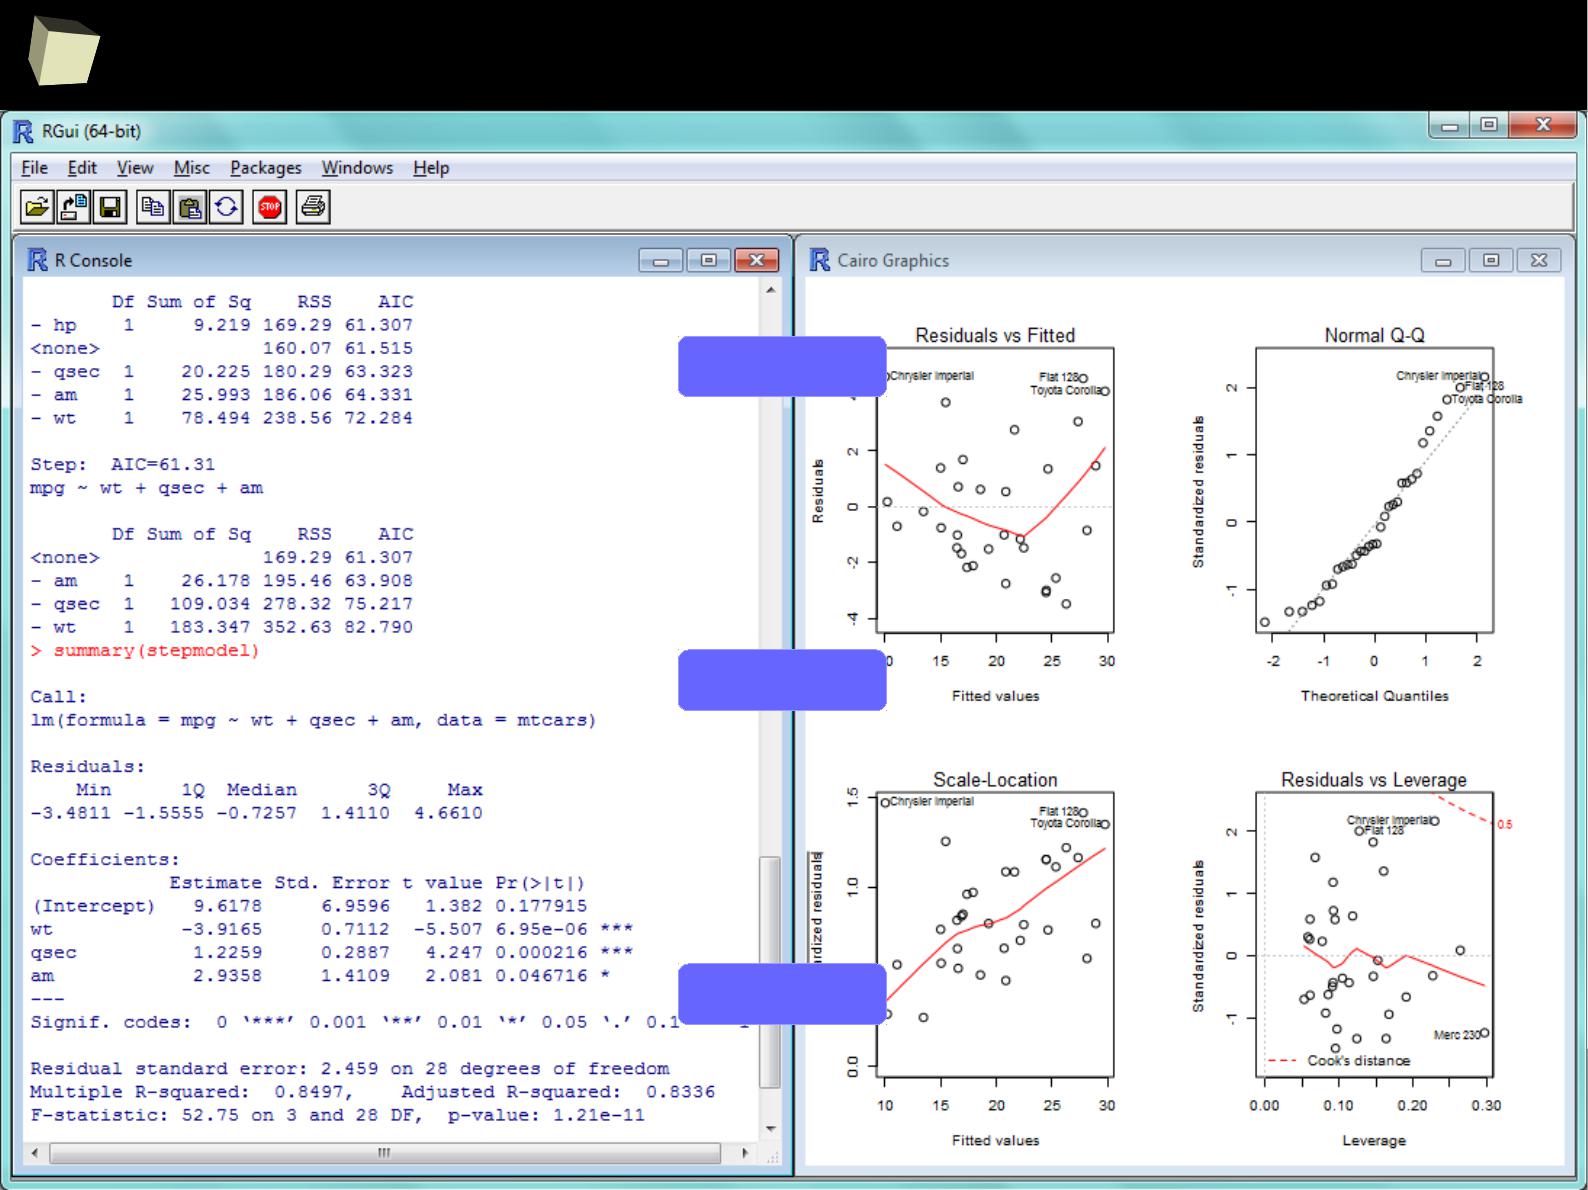
...some linear modeling...
< stepwise
regression
< best model
diagnostics >
3
9
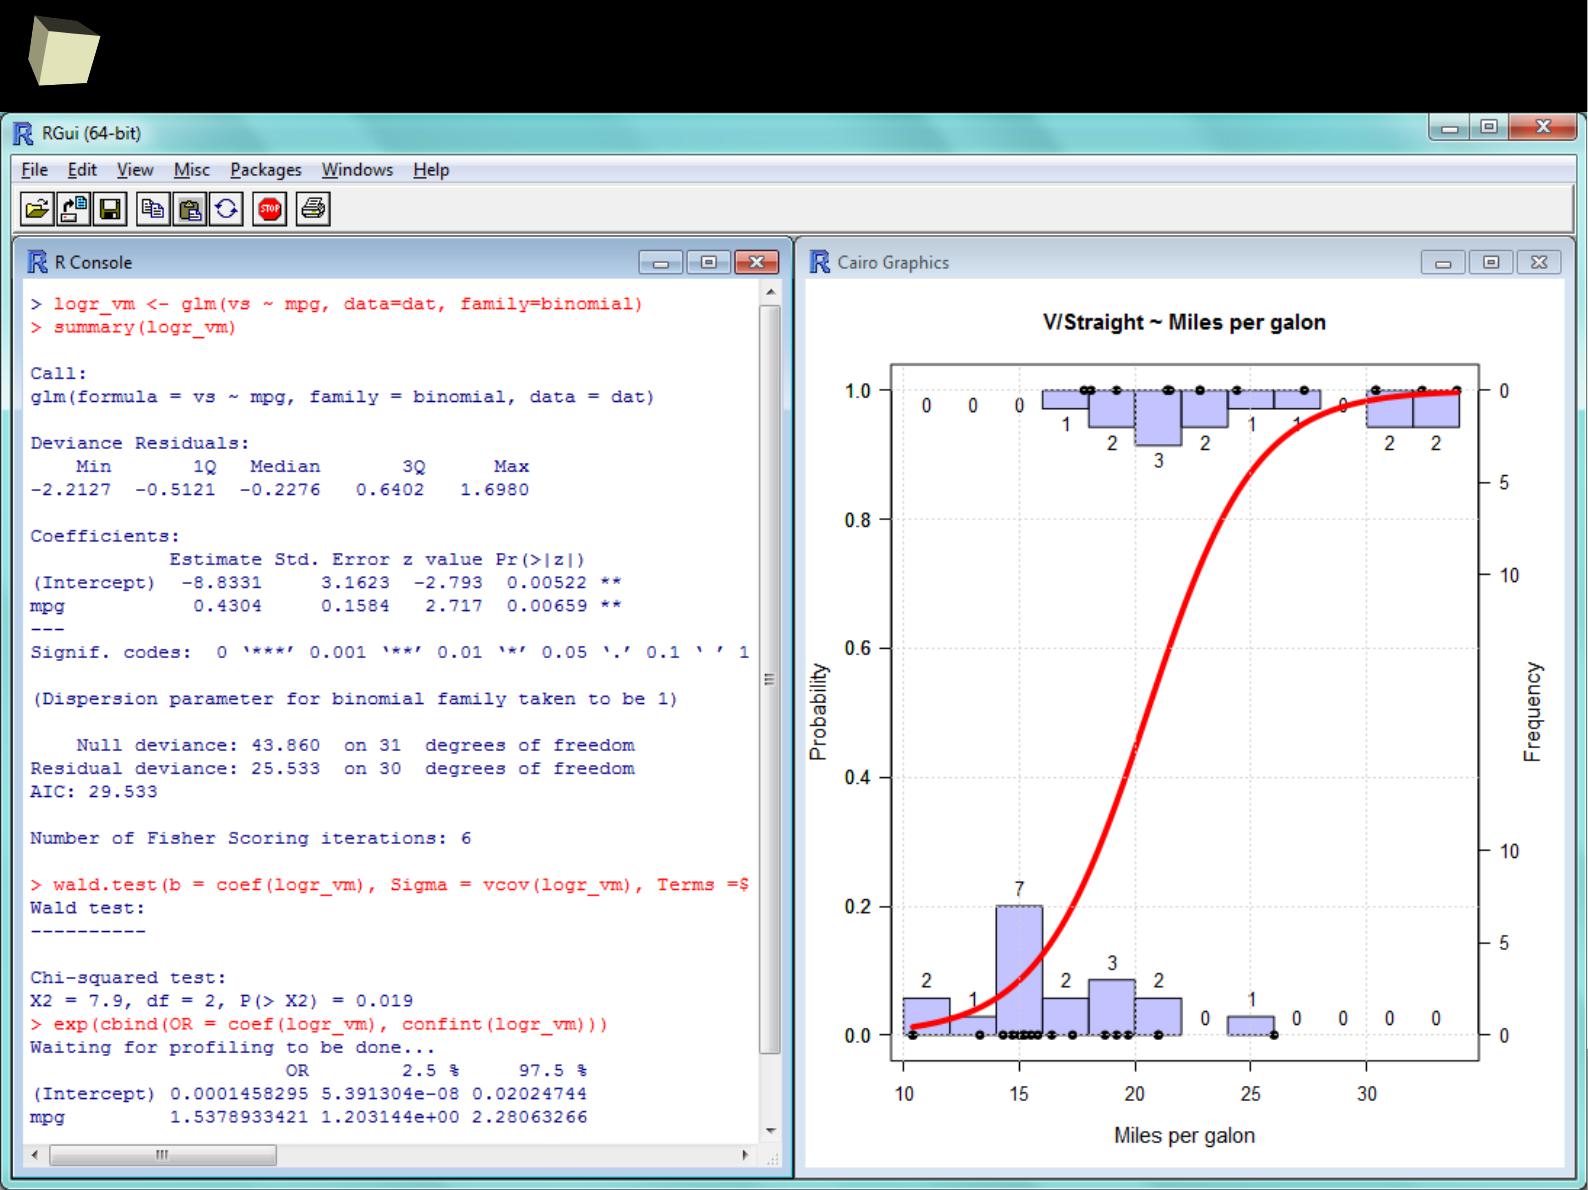
...some GLM modeling...
4
0
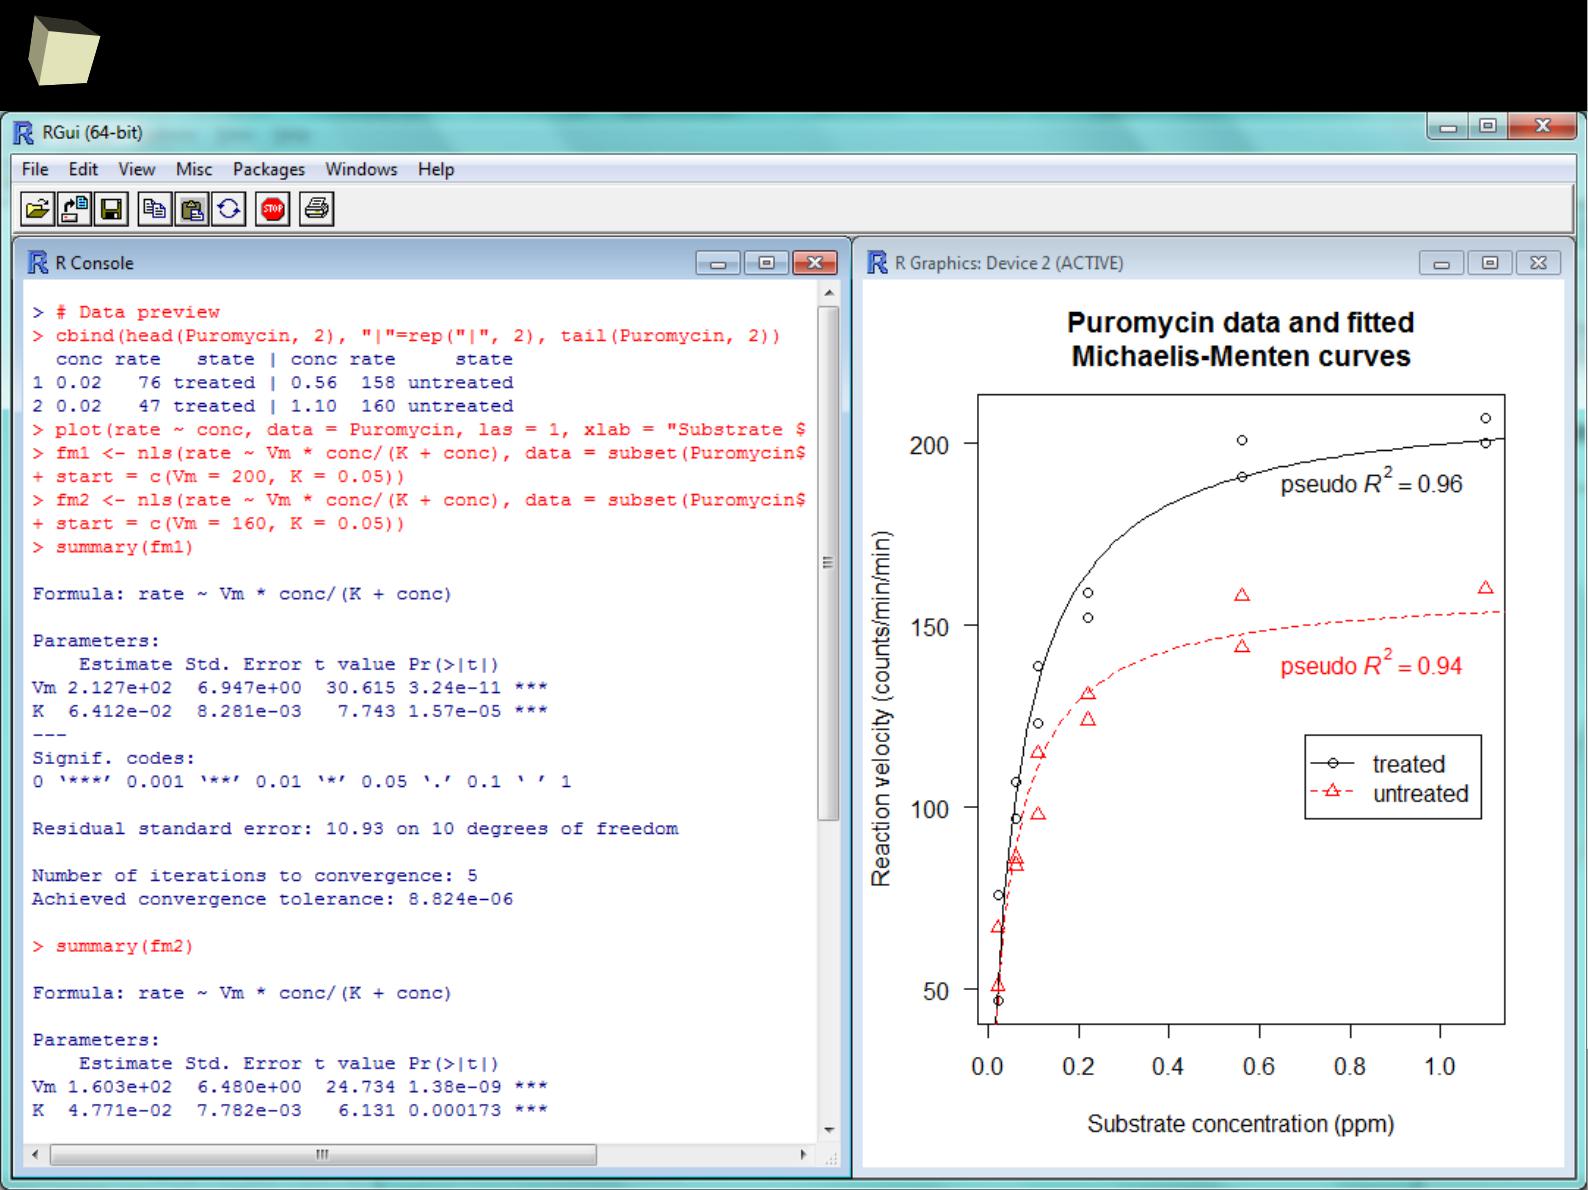
...and nonlinear modeling...
4
1
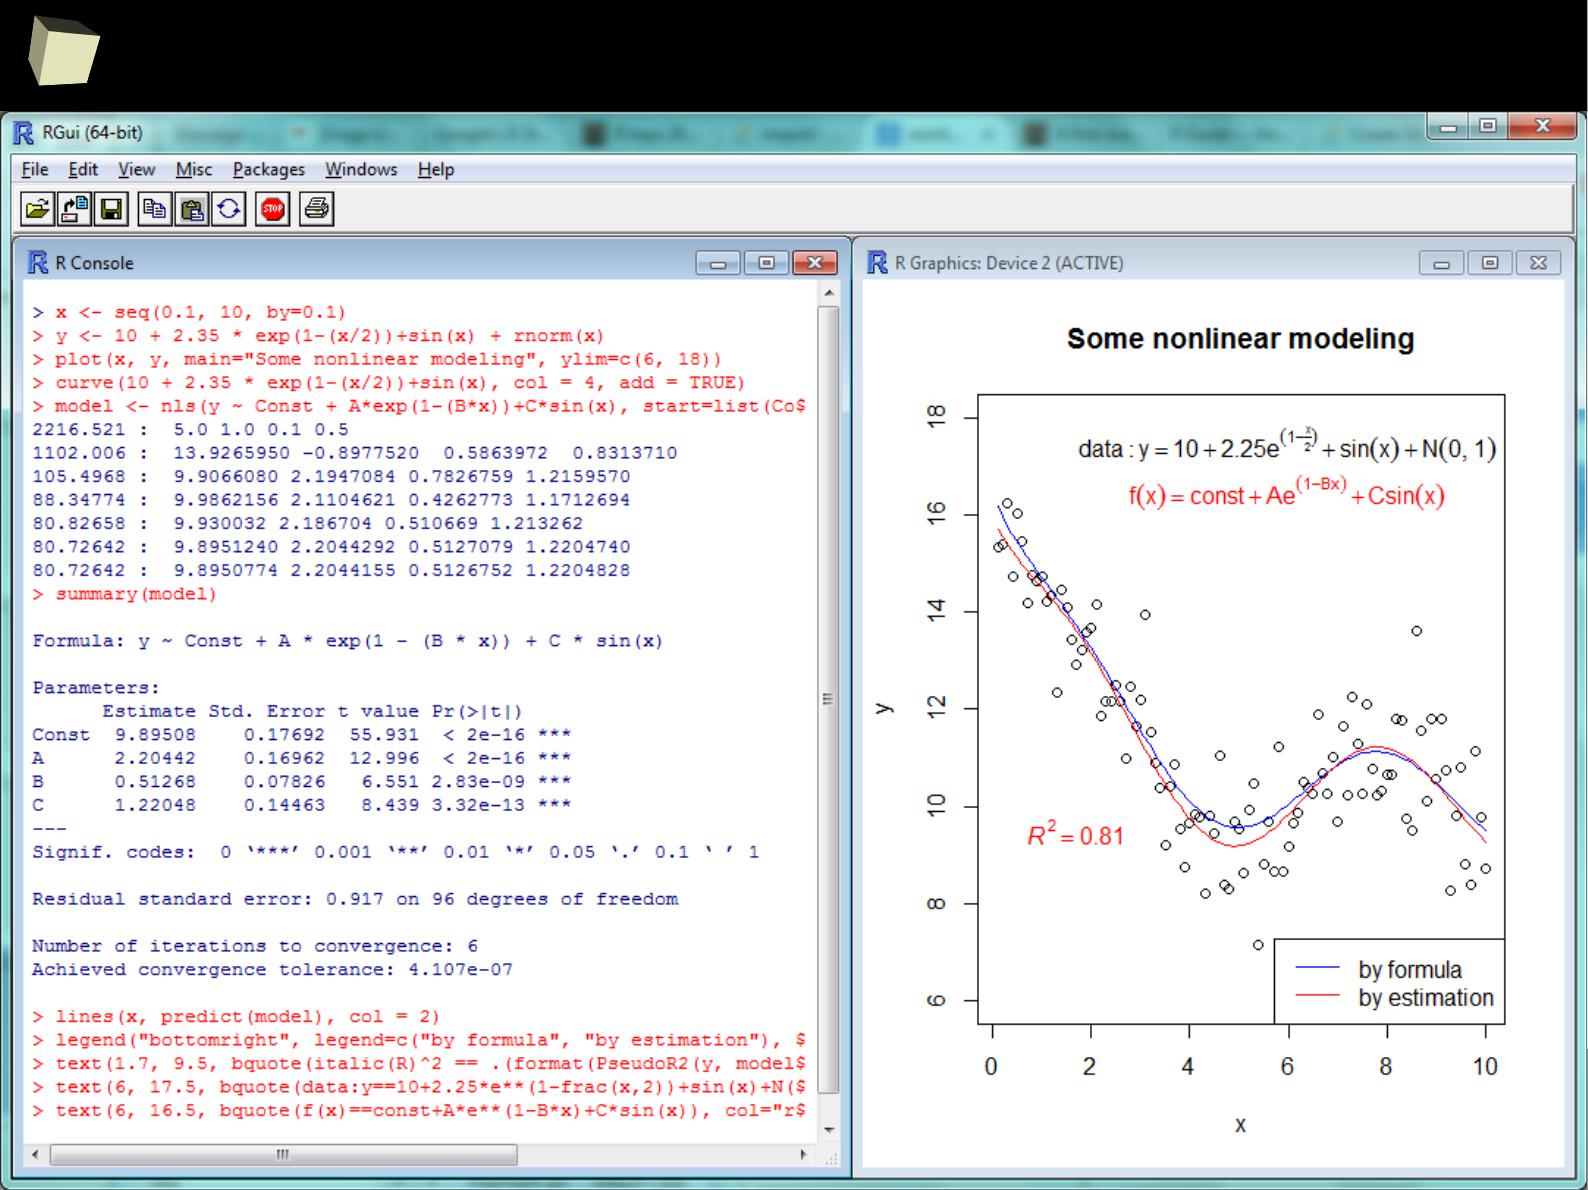
...and nonlinear modeling...
4
2
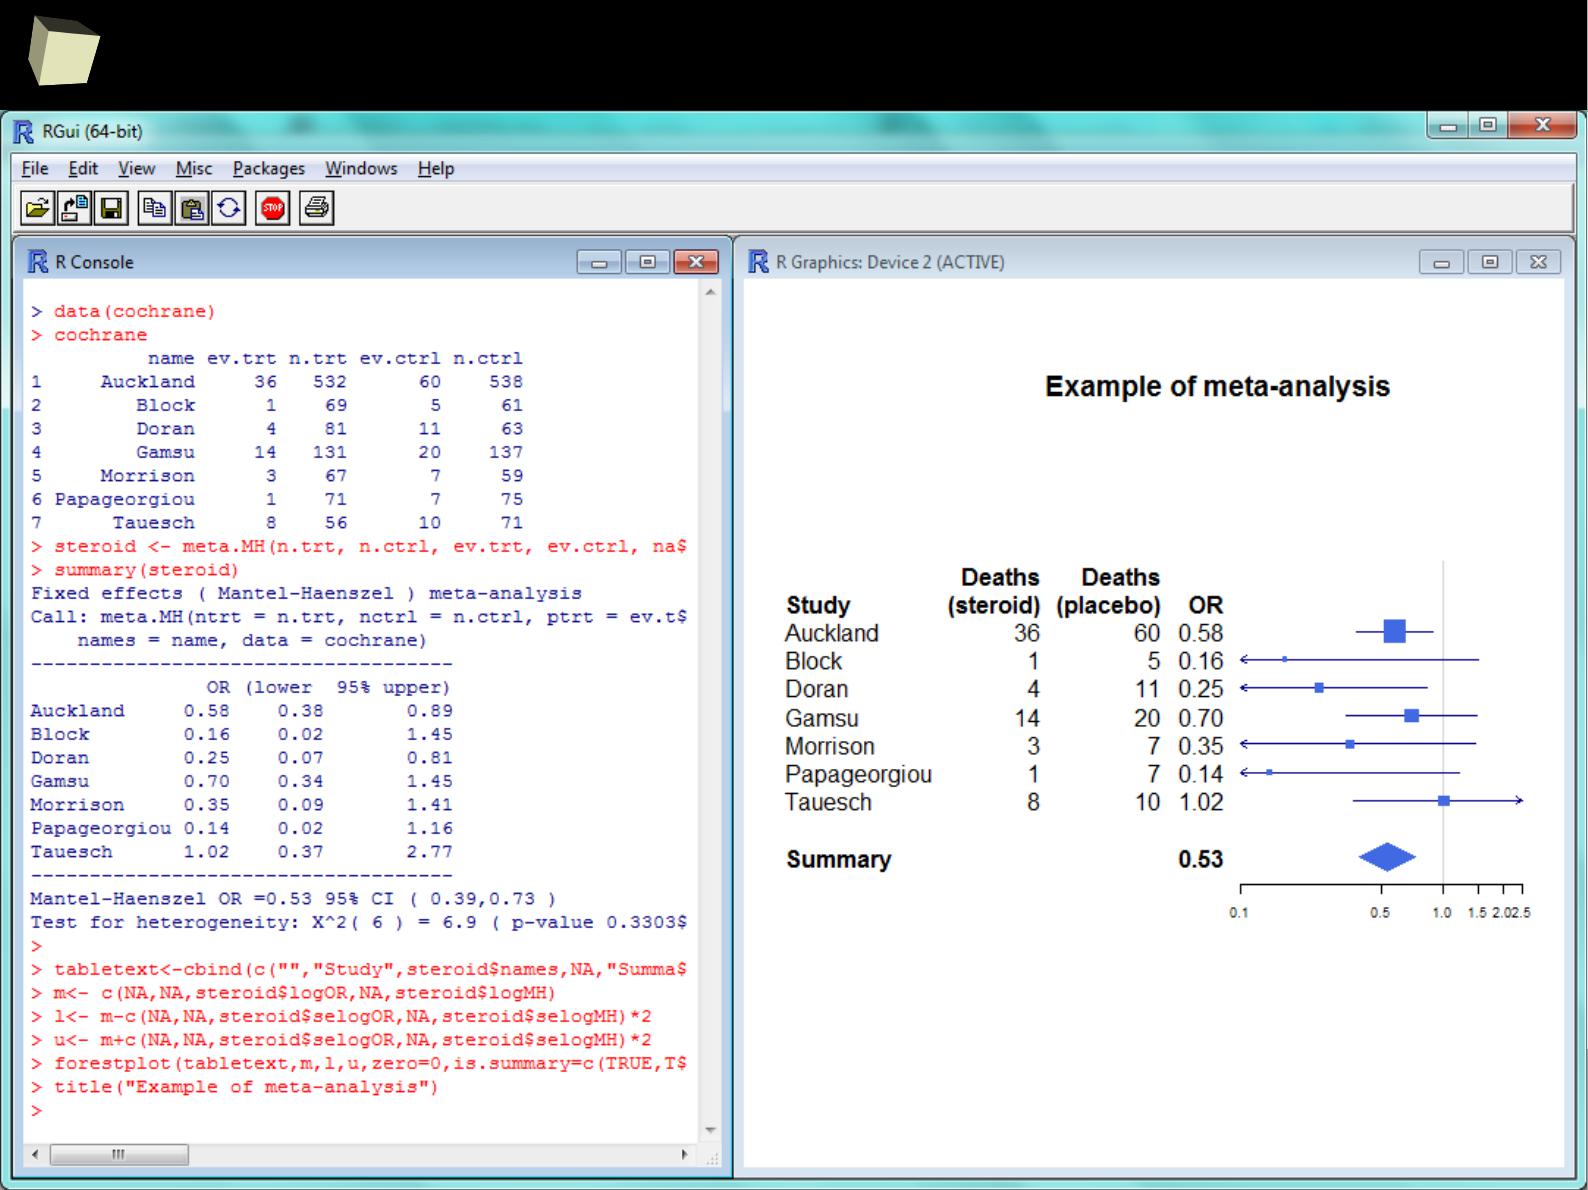
…and meta-analysis...
4
4
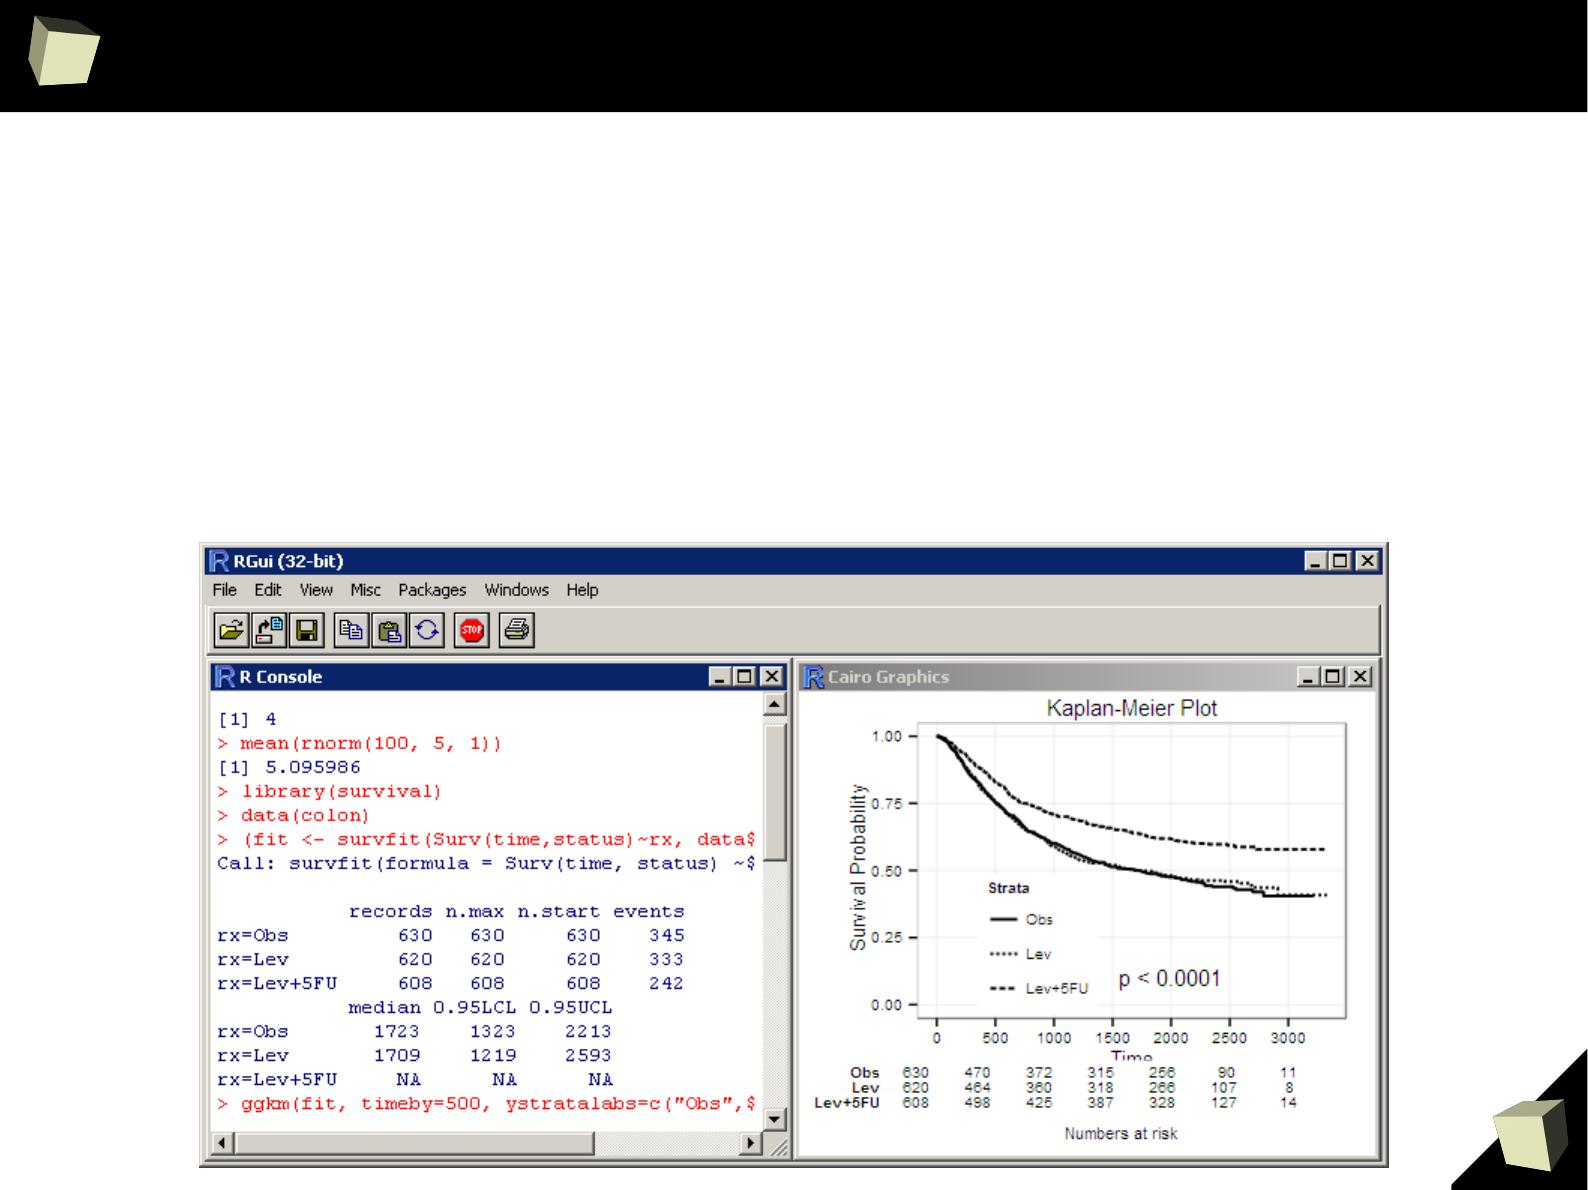
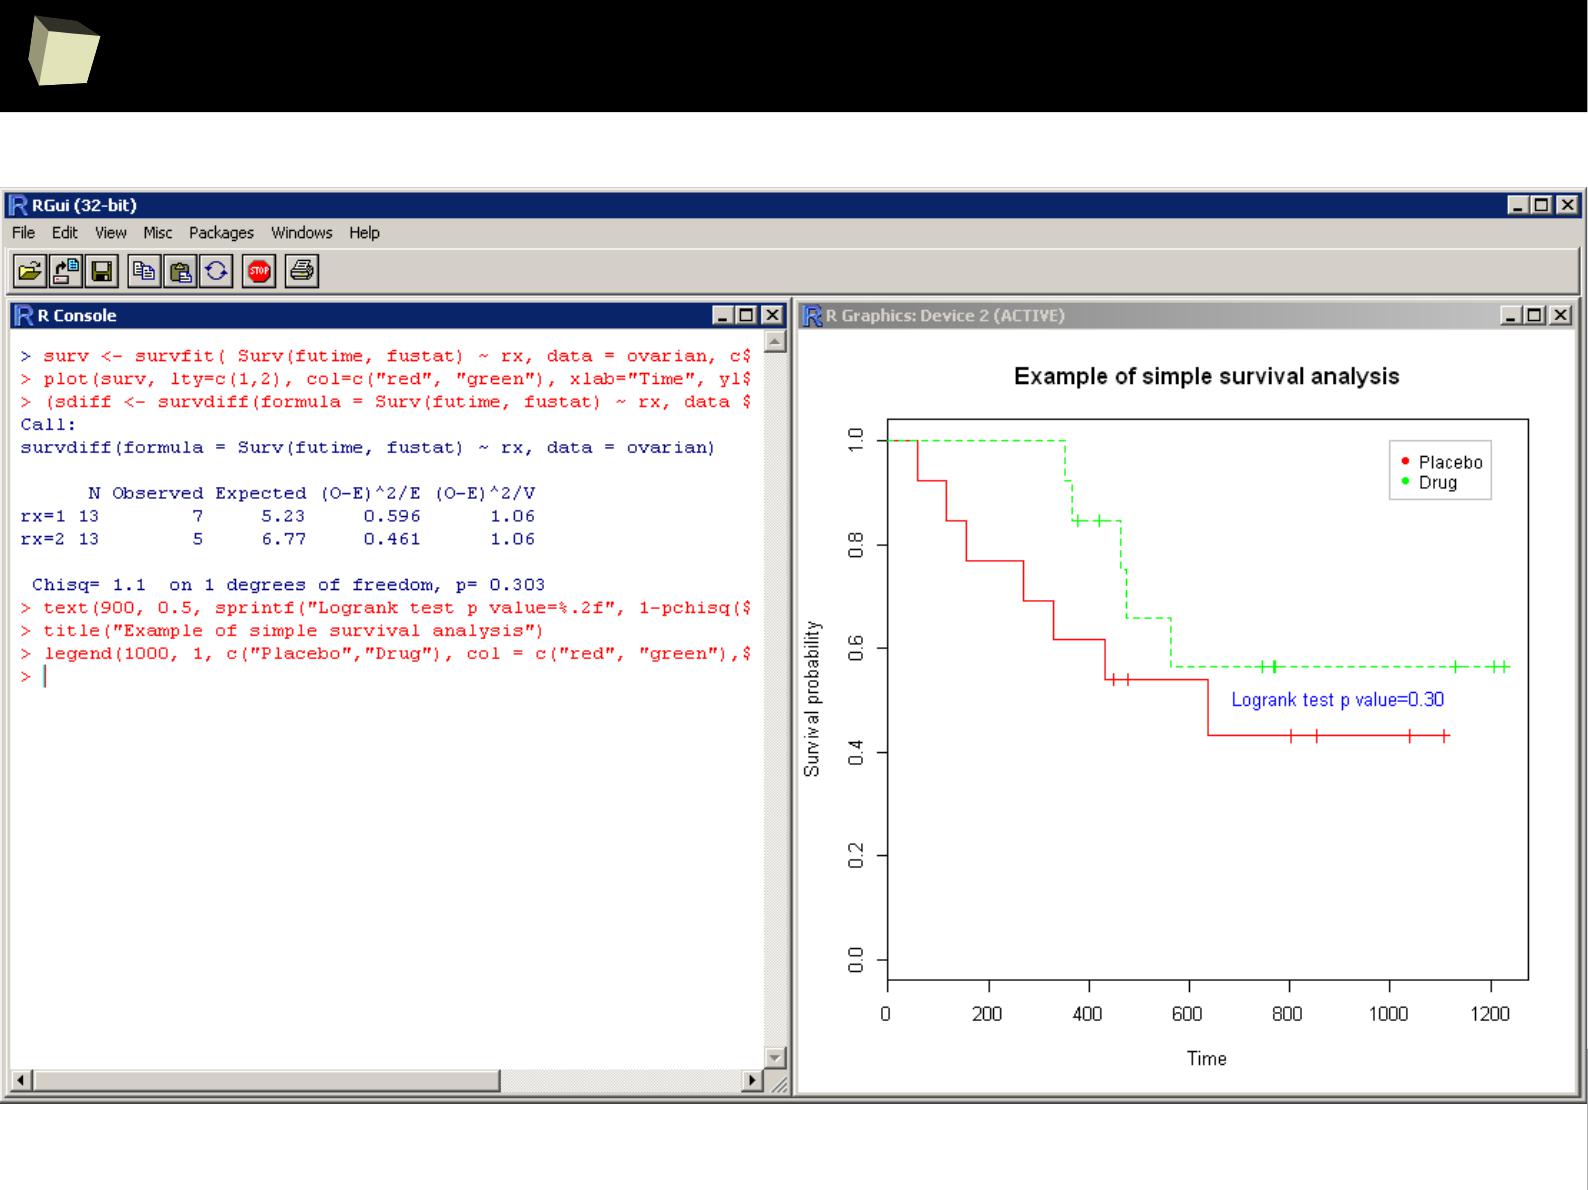
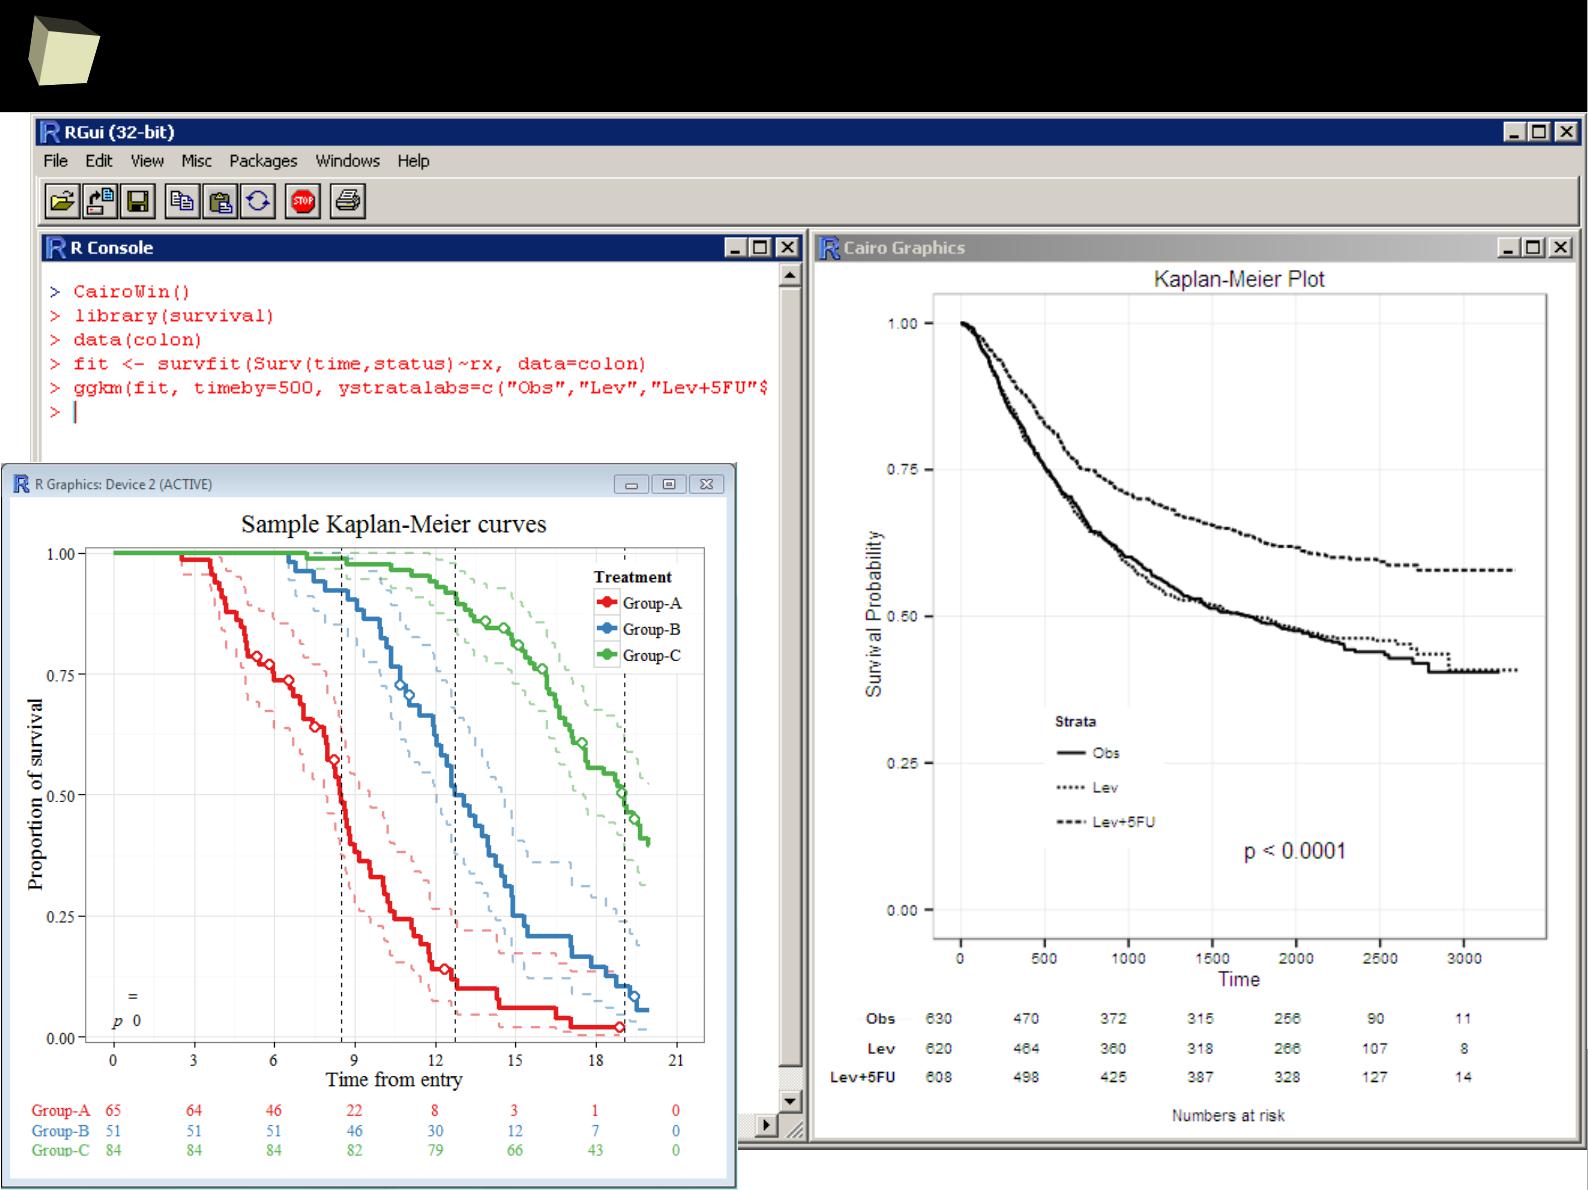
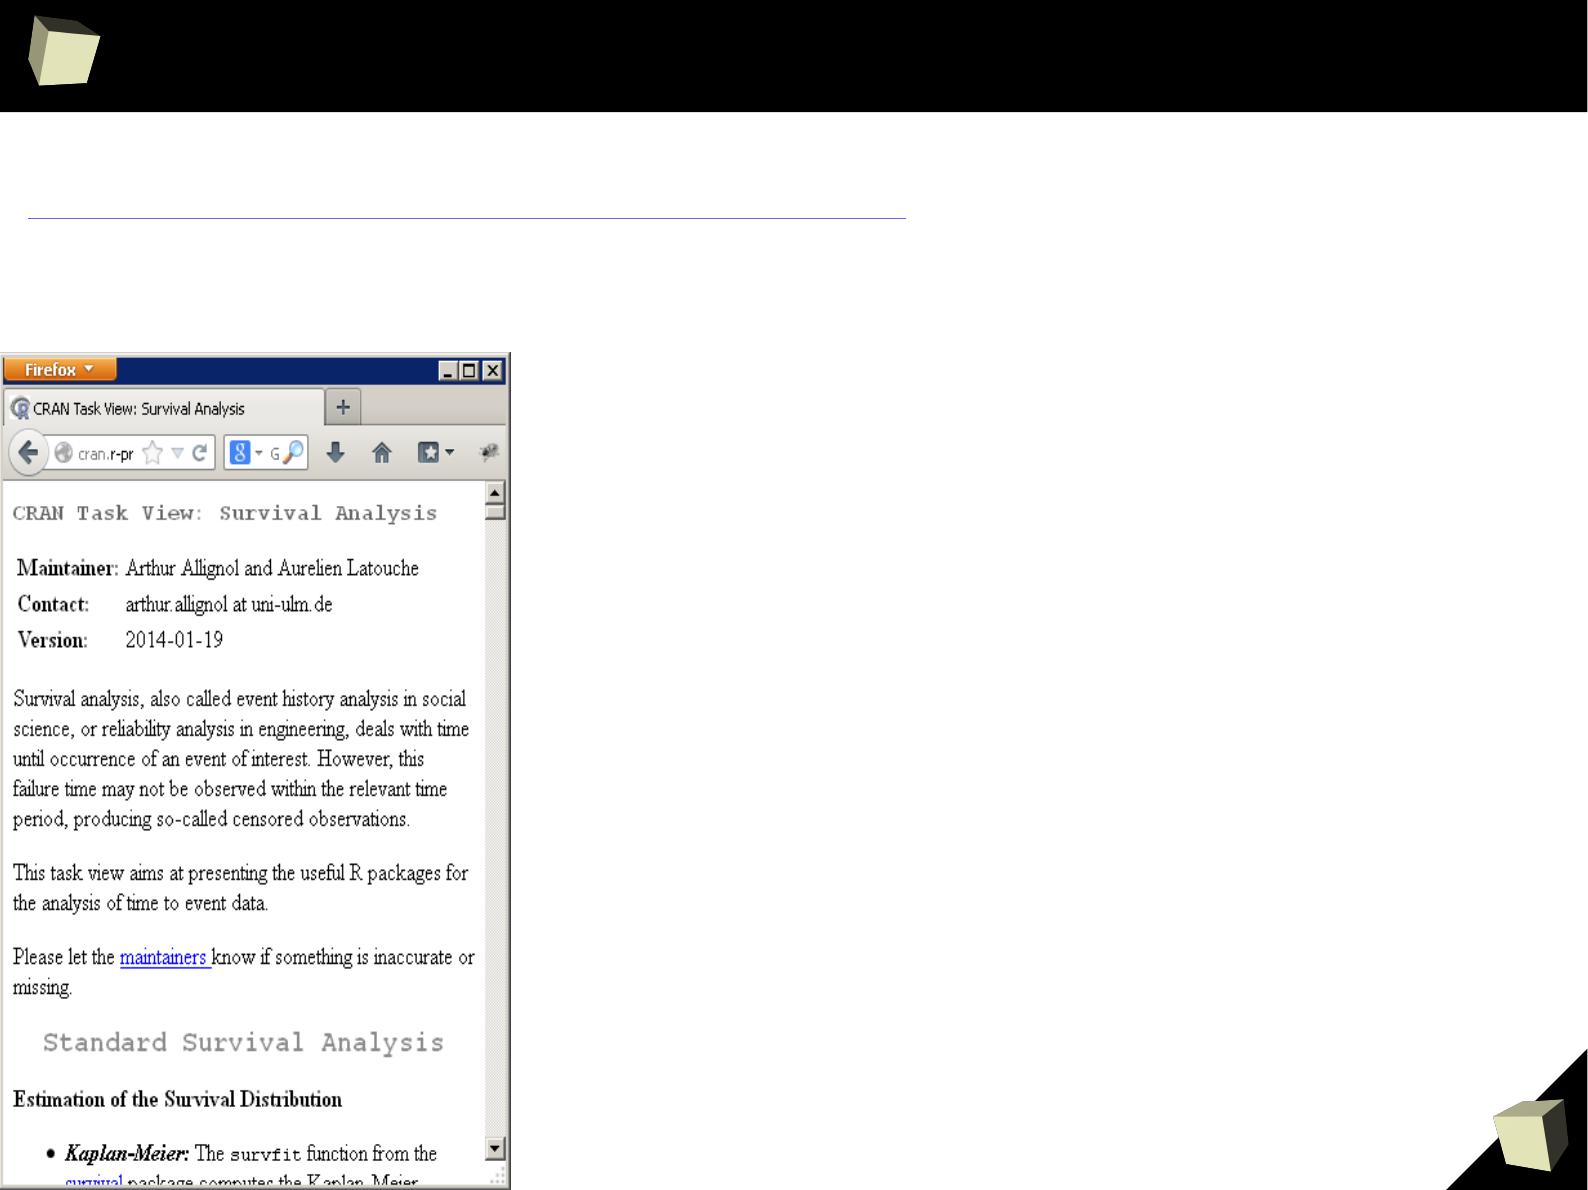
…and survival analysis...
A simple, ascetic solution...
4
5
…and survival analysis...
4
6
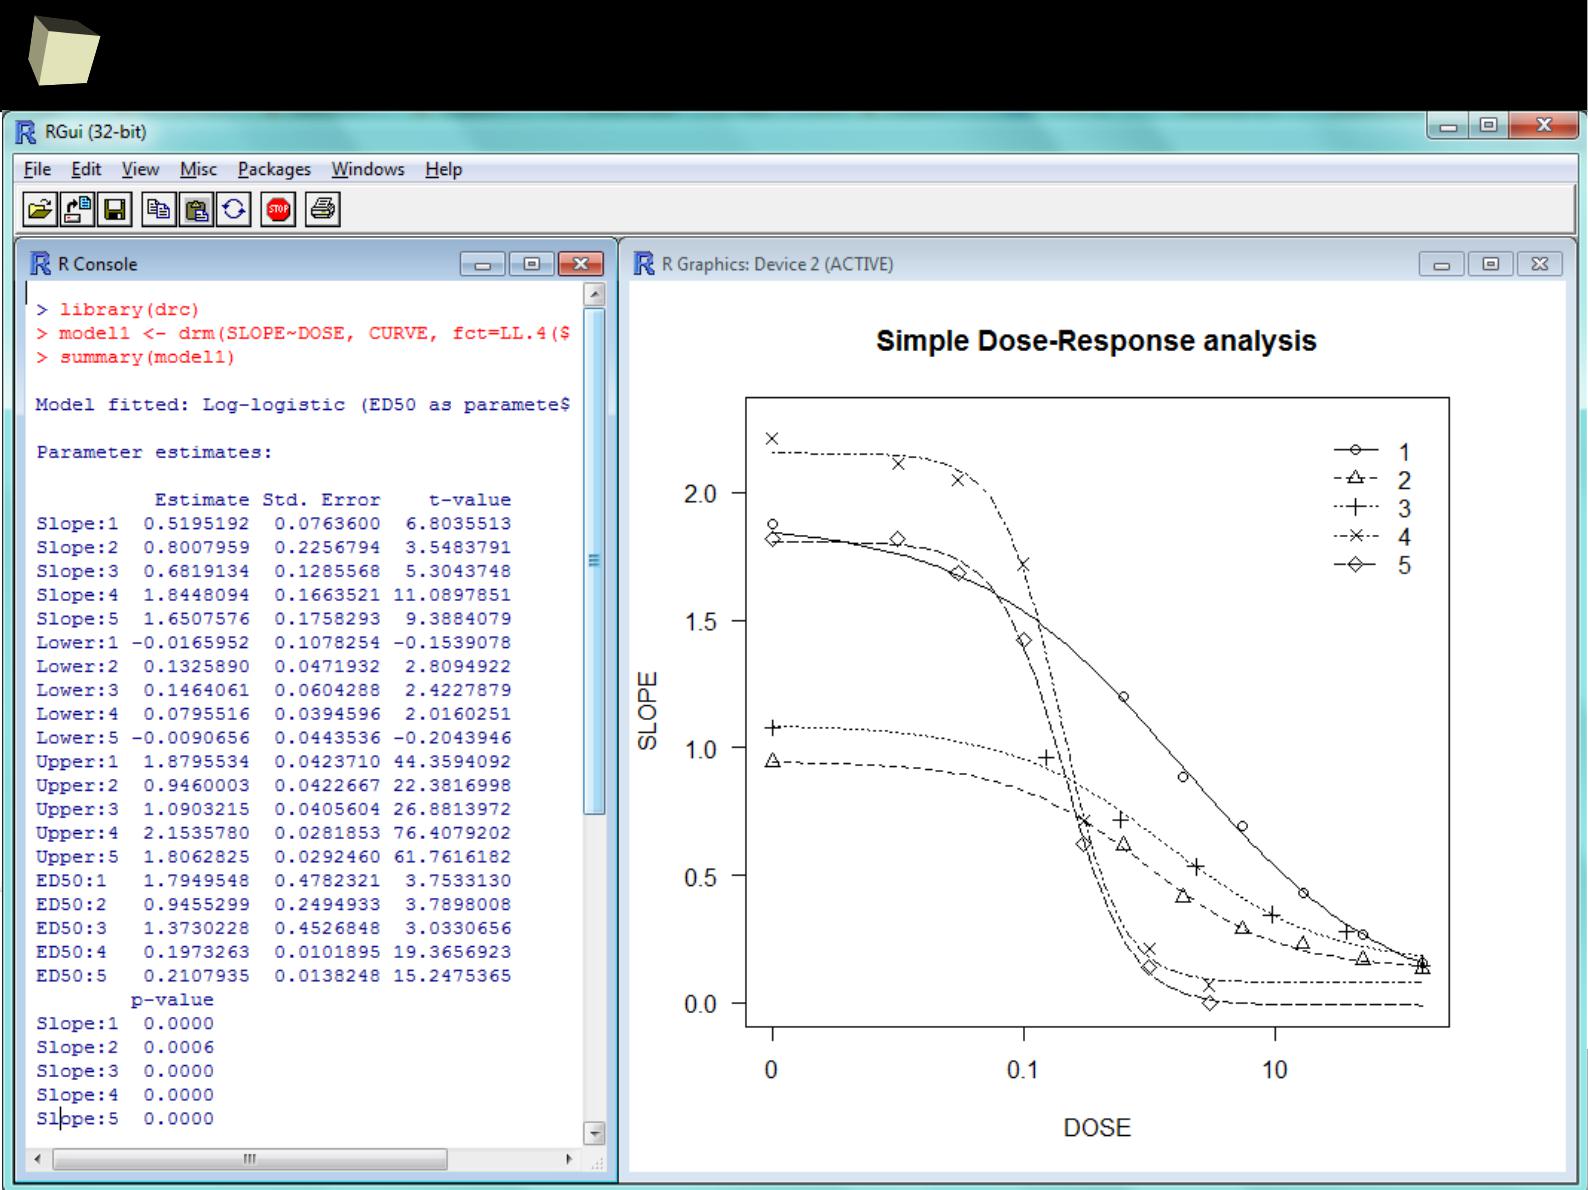
…and dose-response analysis...
4
7
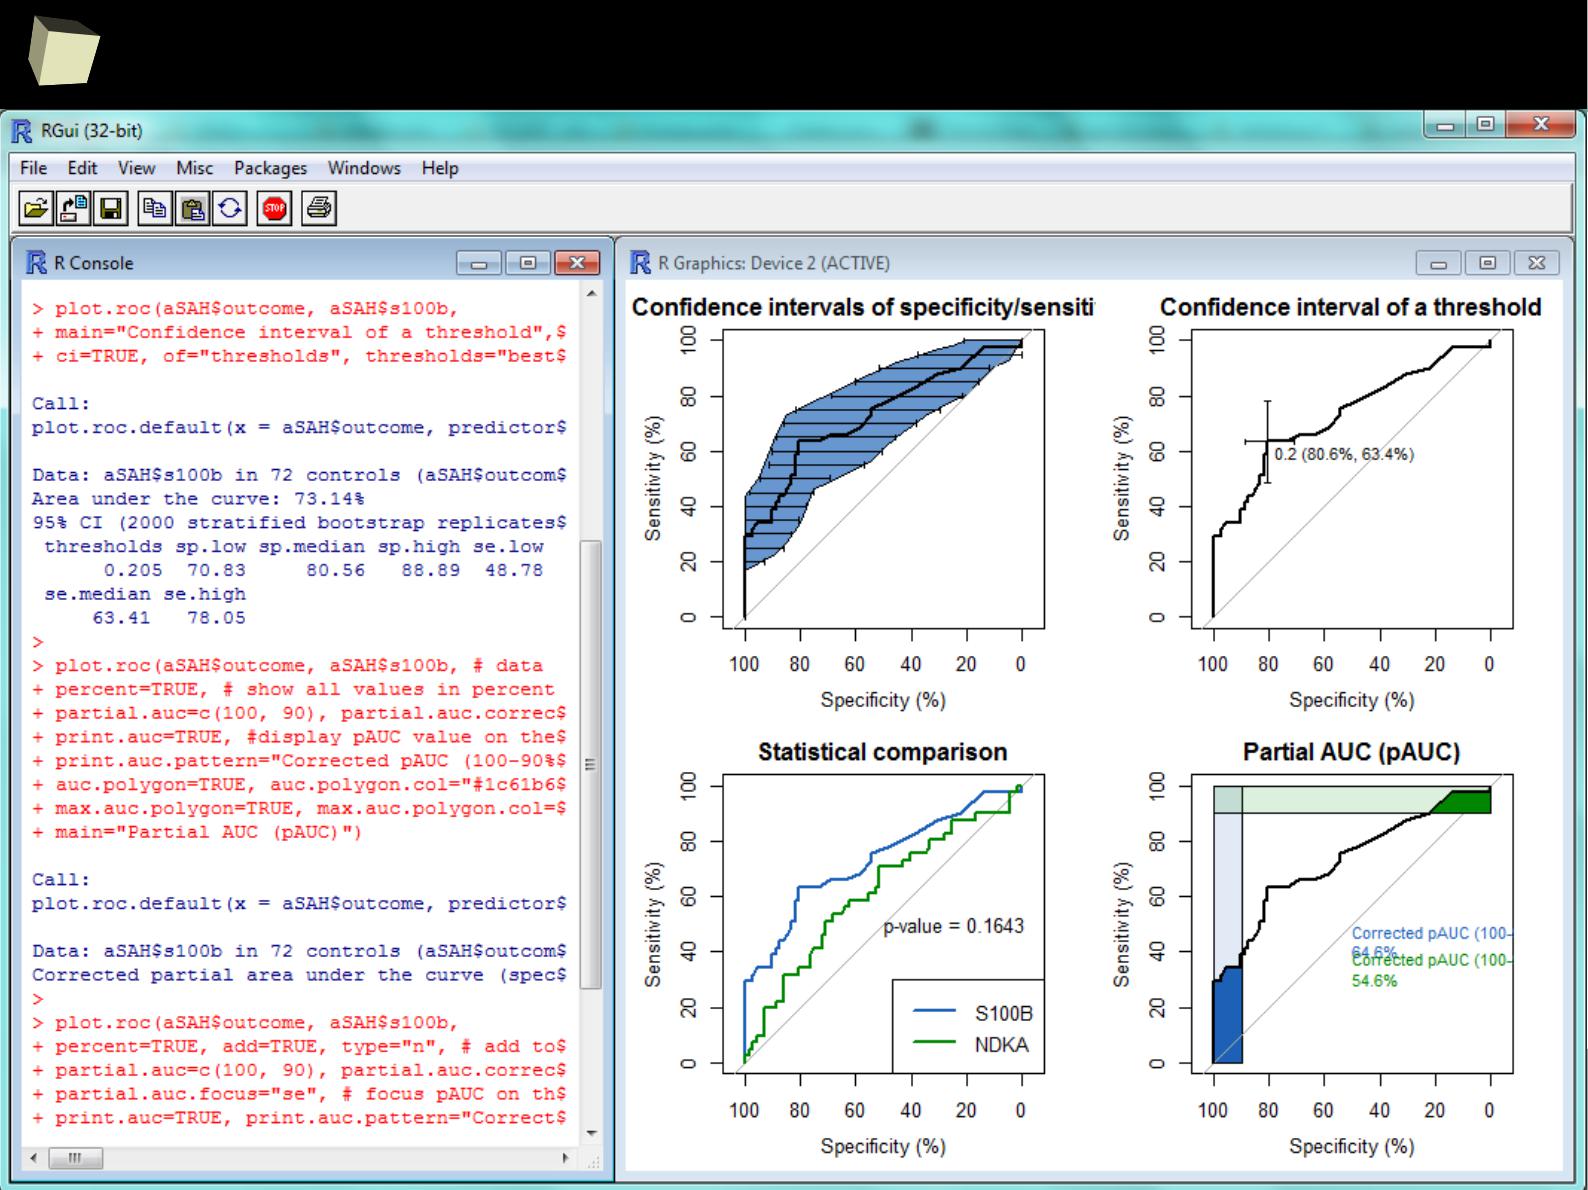
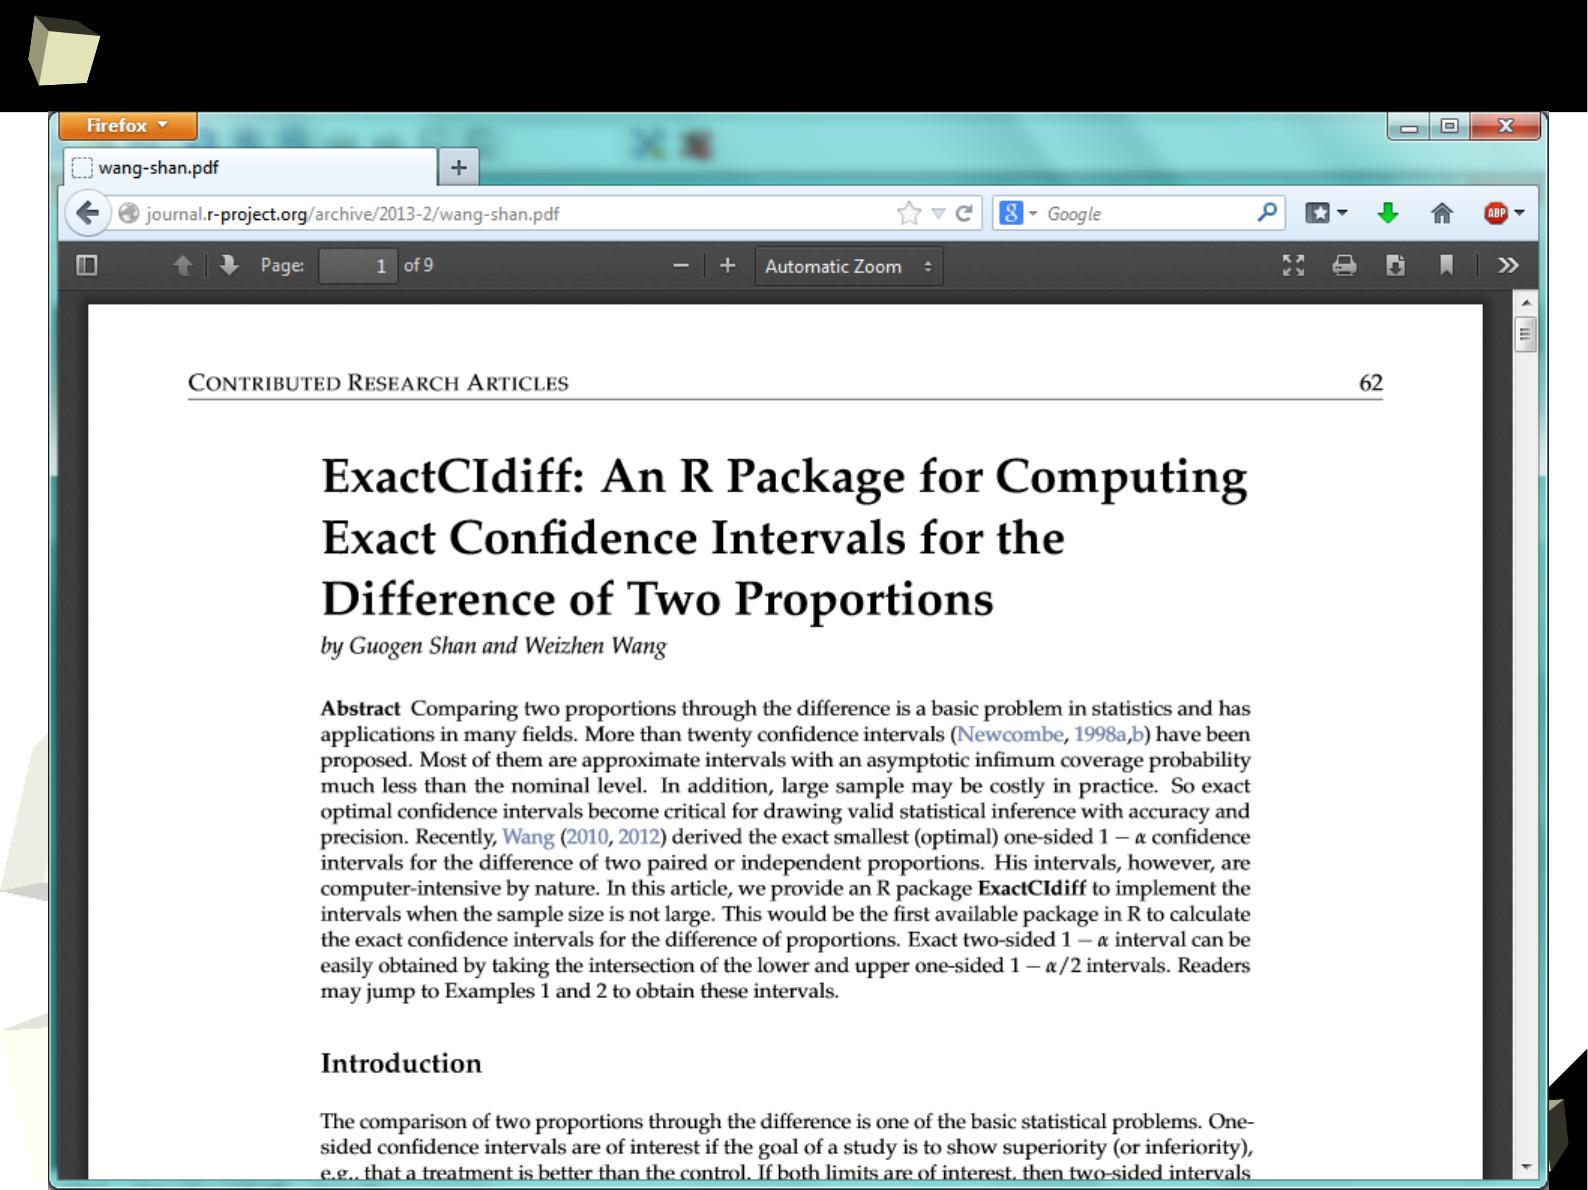
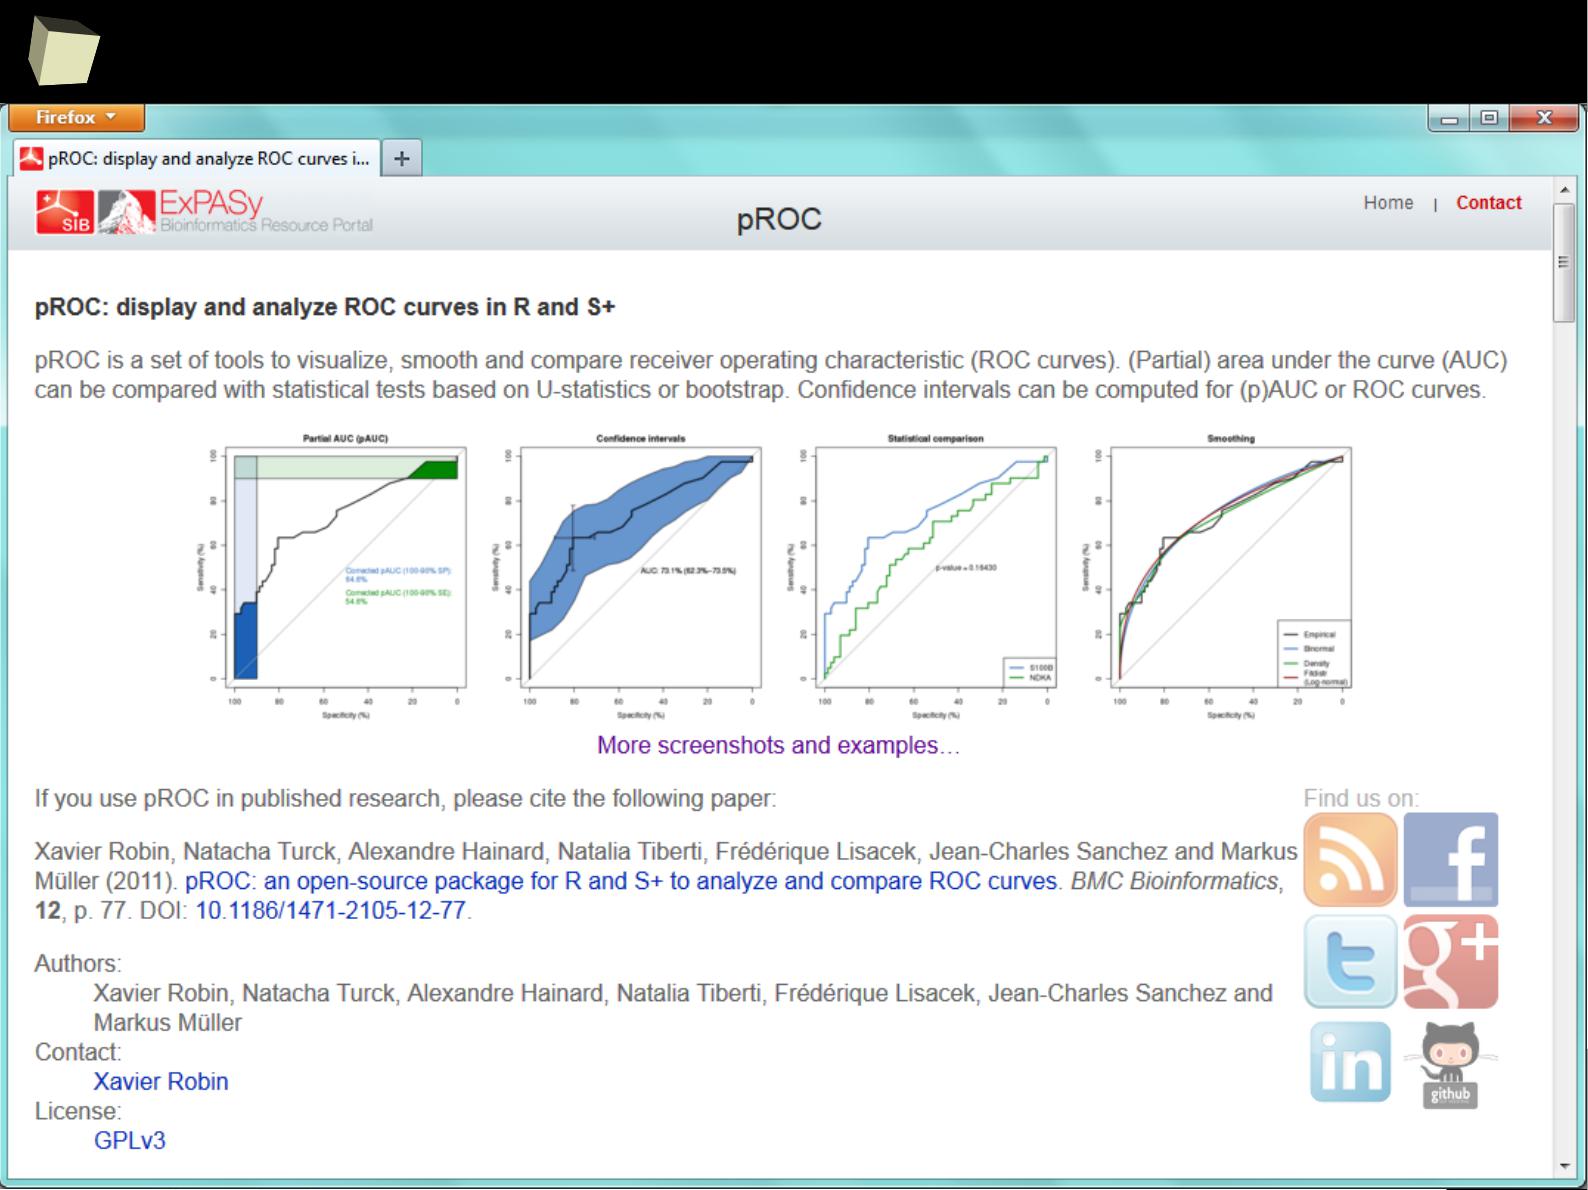
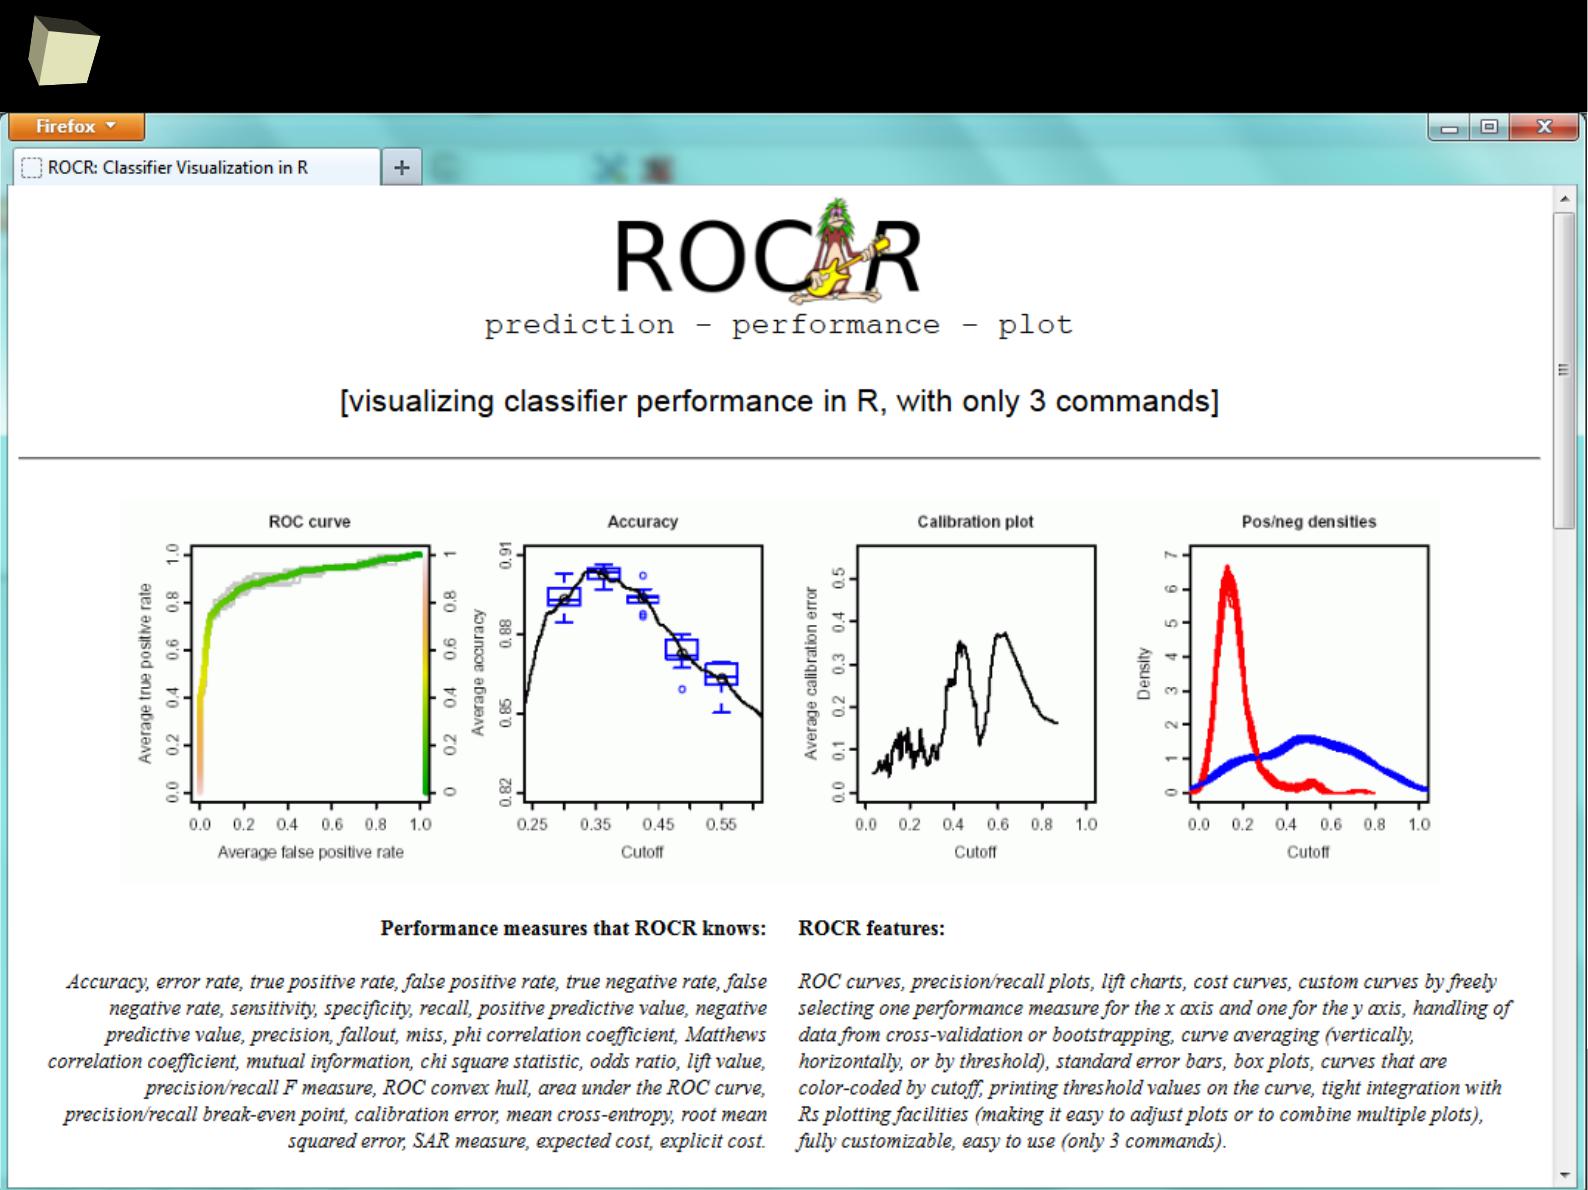
…and ROC curves...

4
8
13 reasons why you will love GNU R

4
9
13 reasons why you will love GNU R
I R is (extremely) cheap. In fact - it's free :)
II R has (extremely) wide range of capabilities
III R is supported by the world of science
IV R is supported by the community
V R is supported by the business
VI R is able to read data in many formats
VII Interoperability is easy to achieve
VIII R is truly cross-platform
IX R offers numerous ways of presenting data
X There are many options to optimize the code
XI R is able to handle large amount of data
XII R has a set of fancy tools and IDEs
XIII
XIII
FDA: R is OK for drug trials!
FDA: R is OK for drug trials!
!
5
0
the pRice
GNU R is a free software.
One can legally use it, even commercially, at no cost.
http://buy.revolutionanalytics.com/
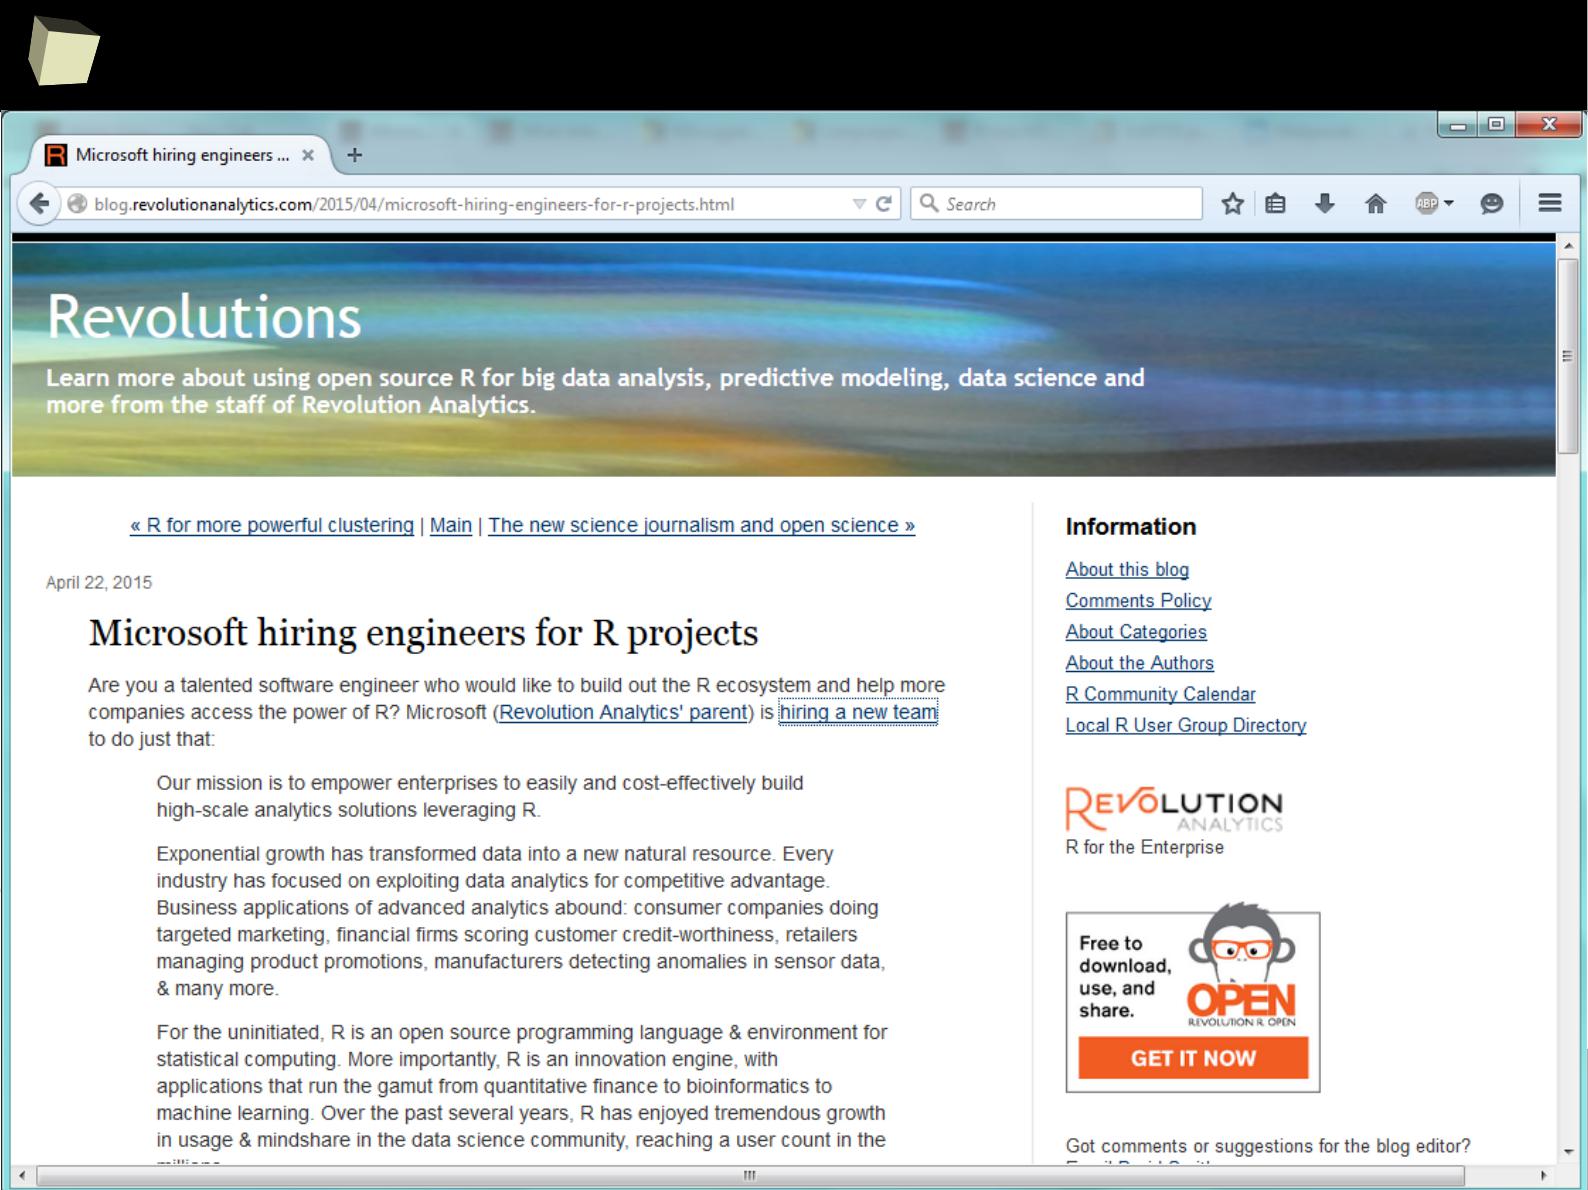
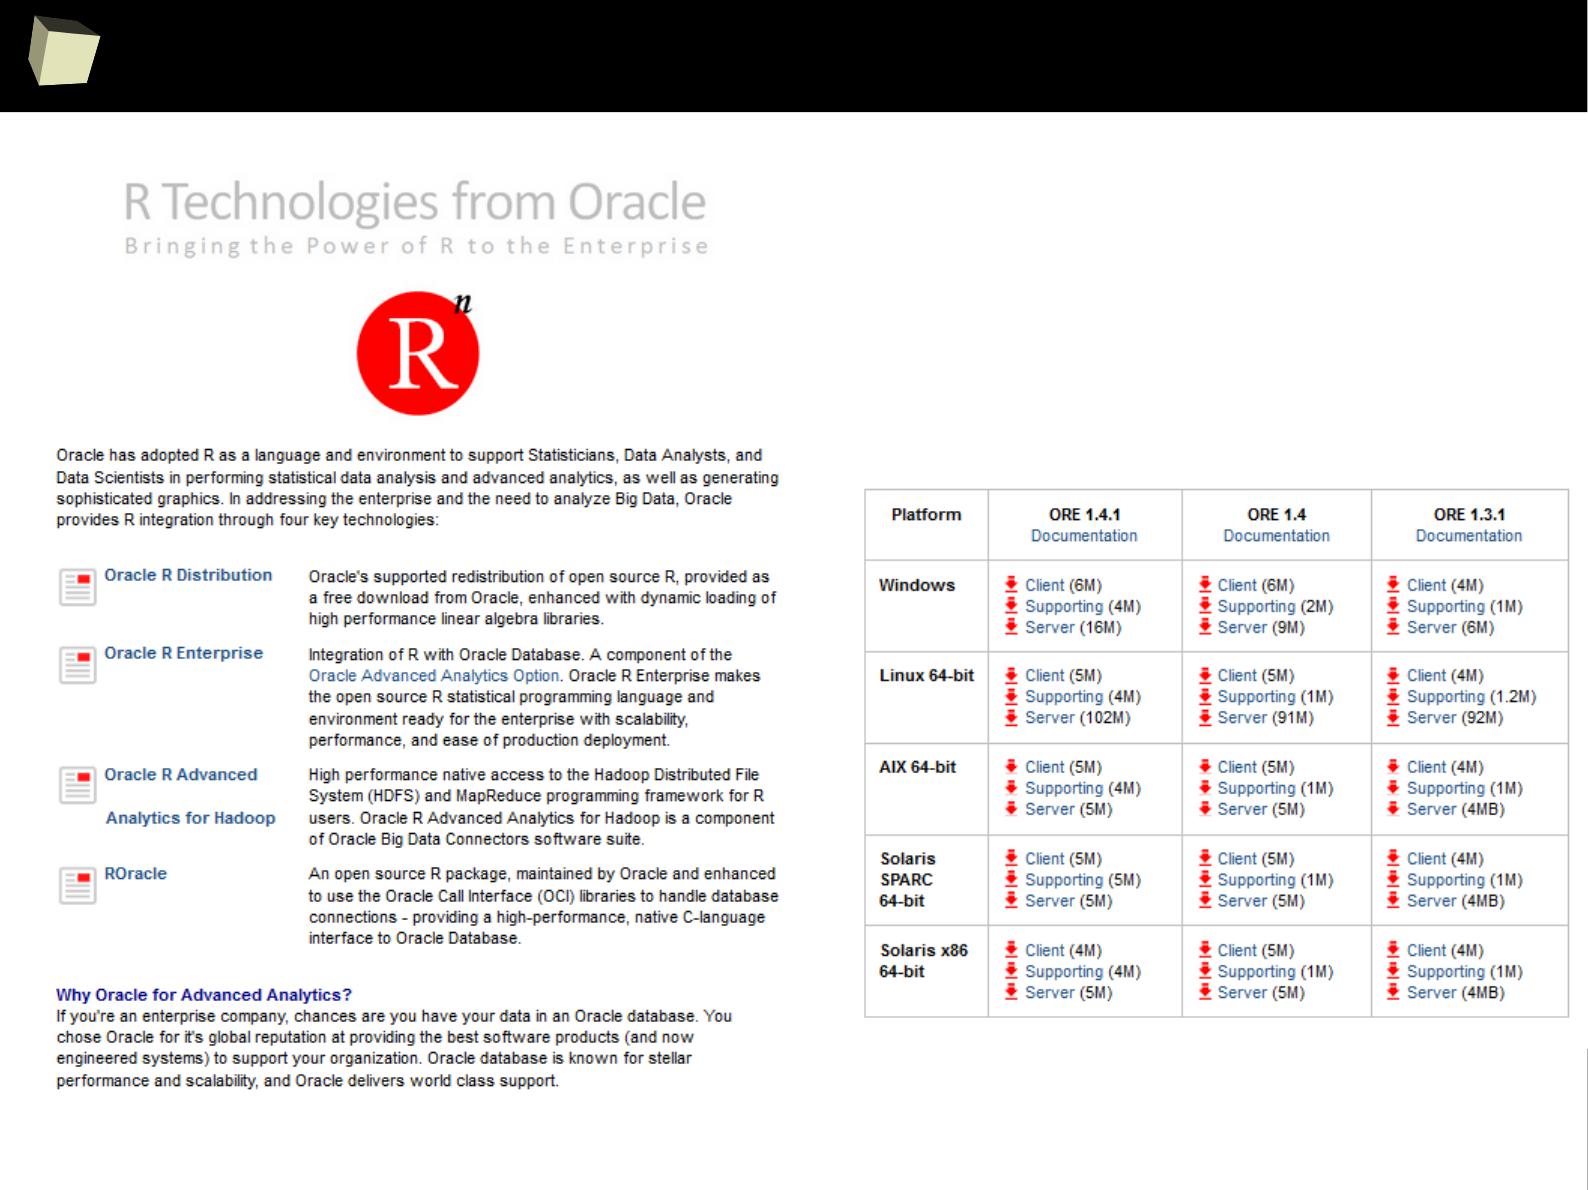
Some companies provide their own, both free and commercial, customized
versions of R along with support and integration services. Well known
providers are: Revolution (since 2015 part of Microsoft), RStudio and Oracle.
http://www.oracle.com/technetwork/...
http://www.rstudio.com/about/trademark/
http://www.rstudio.com...
http://blogs.microsoft.com/blog/2015/01/23/...
5
1
save your money with R!
Some
Some
Expensive
Expensive
Statistical
Statistical
Package
Package
Module
Module
#1
#1
Module
Module
#2
#2
Module
Module
#3
#3
an
an
expensive
expensive
Module
Module
#4
#4
call R
call R
from the
from the
Package
Package
Required
Required
algorithm or
algorithm or
functionality
functionality
bidirectional
data
exchange
No, thanks!
a “bridge”
between
the Package
and R

5
2
Licenses
The following licenses are in use for R and associated software:
●
GNU Affero GPL v.3
●
Artistic License" v.2.0
●
BSD 2-clause
●
BSD 3-clause
●
GNU GPL v.2
●
GNU GPL v.3
●
GNU Library GPL v.2
●
GNU Lesser GPL v.2.1
●
GNU Lesser GPL v.3
●
Massachusetts Institute of Technology (X11)
R as a package is licensed under GPLv2

5
3
13 reasons why you will love GNU R
I R is (extremely) cheap. In fact - it's free :)
II R has (extremely) wide range of capabilities
III R is supported by the world of science
IV R is supported by the community
V R is supported by the business
VI R is able to read data in many formats
VII Interoperability is easy to achieve
VIII R is truly cross-platform
IX R offers numerous ways of presenting data
X There are many options to optimize the code
XI R is able to handle large amount of data
XII R has a set of fancy tools and IDEs
XII FDA accepted using R for drug trials!

5
4
the Comprehensive R Archive Network
Sit down and hold tight! CRAN holds over 6660
nrow(available.packages()), 15.06.2015
packages.
Just describe your problem or ask me for a statistical test or procedure and
I will give you the right package(s):
●
Linear models of ANY kind. (M)AN(C)OVA, regression (linear, logistic, hierarchical, etc.)
●
Post-factum analysis and planned comparisons
●
Nonlinear models (NLS, Generalized Additive Models with a rich set of smoothers), trees
●
Robust methods: Regularized methods, M-estimators
●
Models with fixed and random effects (mixed models). Variance components
●
Monte Carlo methods (permutational, bootstrap). Exact methods.
●
Survival • PK/PD • Superior / Non inferior. / Equiv. / Bioequiv. trials • Meta-analysis
●
Design of experiments – including those applicable in clinical research
●
Structural equations. Time series. Forecasting.
●
Methods for analyzing multidimensional data: NN, SVM, LDA/QDA, PCA, FA, CC, MS, KLT,
CA, MART, POLYMARS, PINDIS, PPR, ACE, AVAS, K-means, KN, and lots of more!
●
Trees (CART, CHAID). Random forests. Aggregating (boosting, bagging)
●
Reproducible research. Graphical User Interfaces. Widely understood interoperability.
http://cran.r-project.org/web/views
5
5
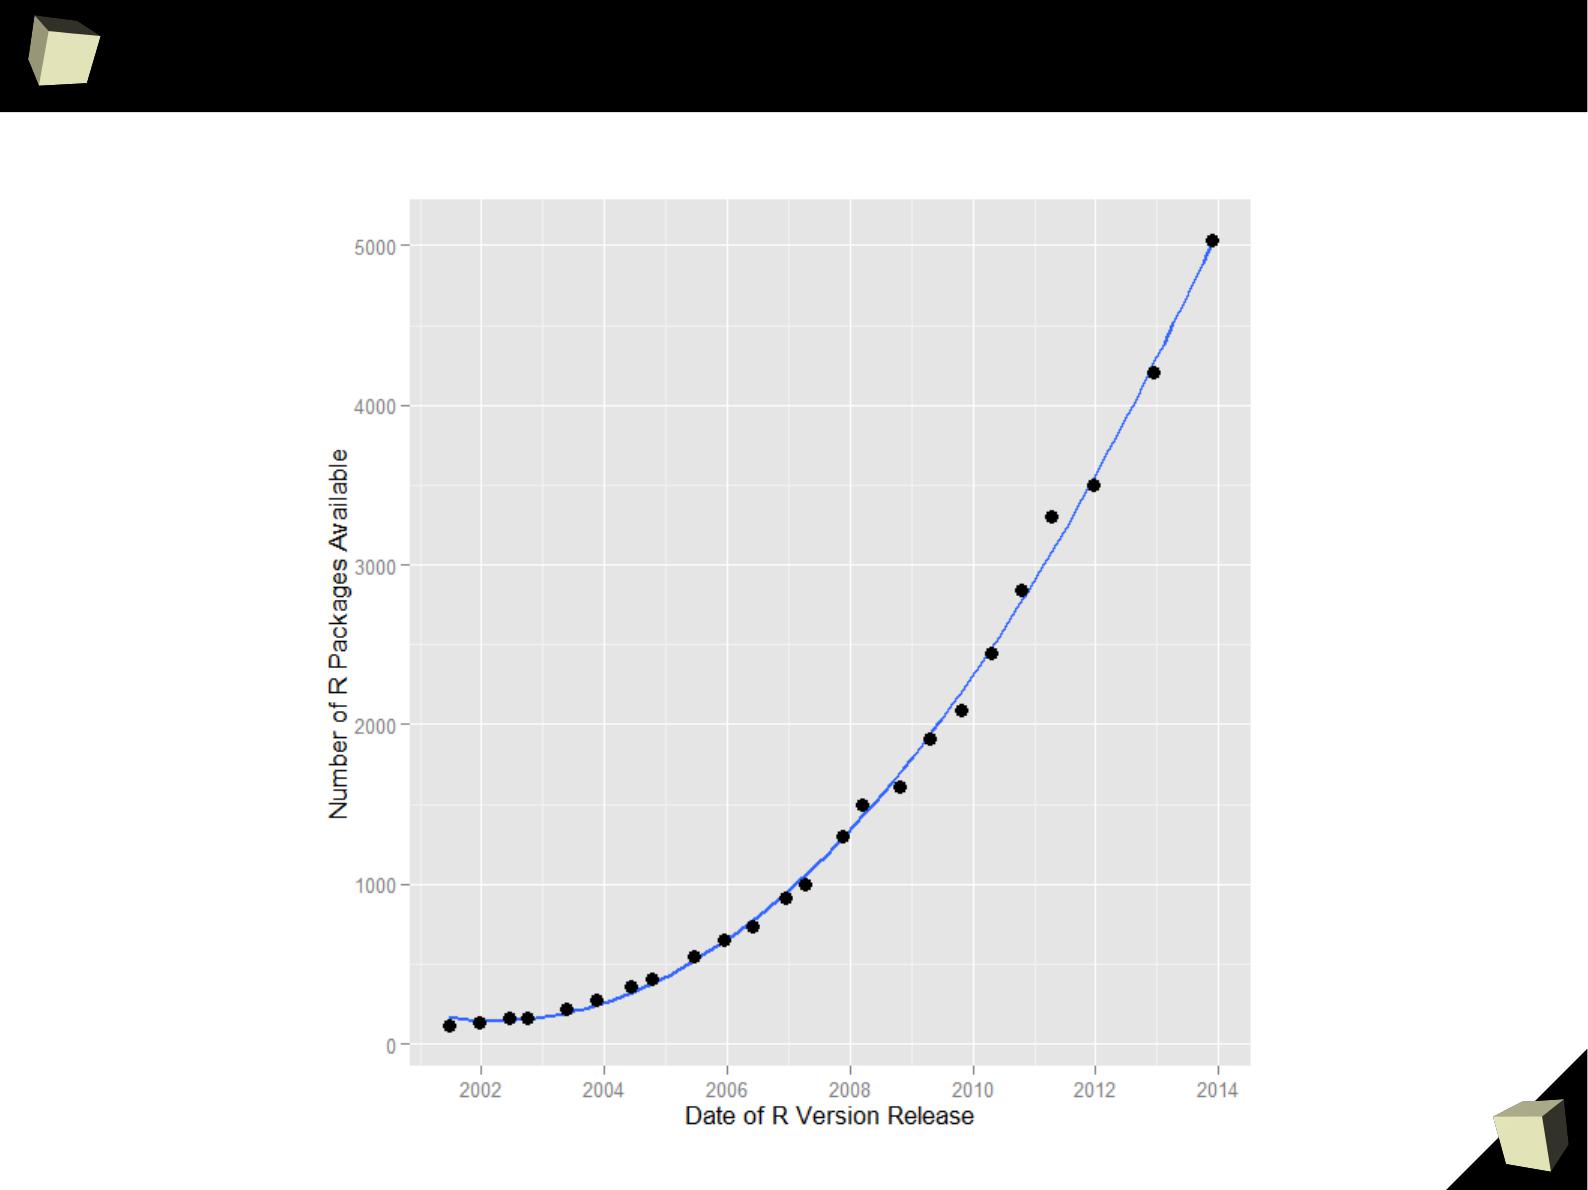
Growth in the number of packages

5
6
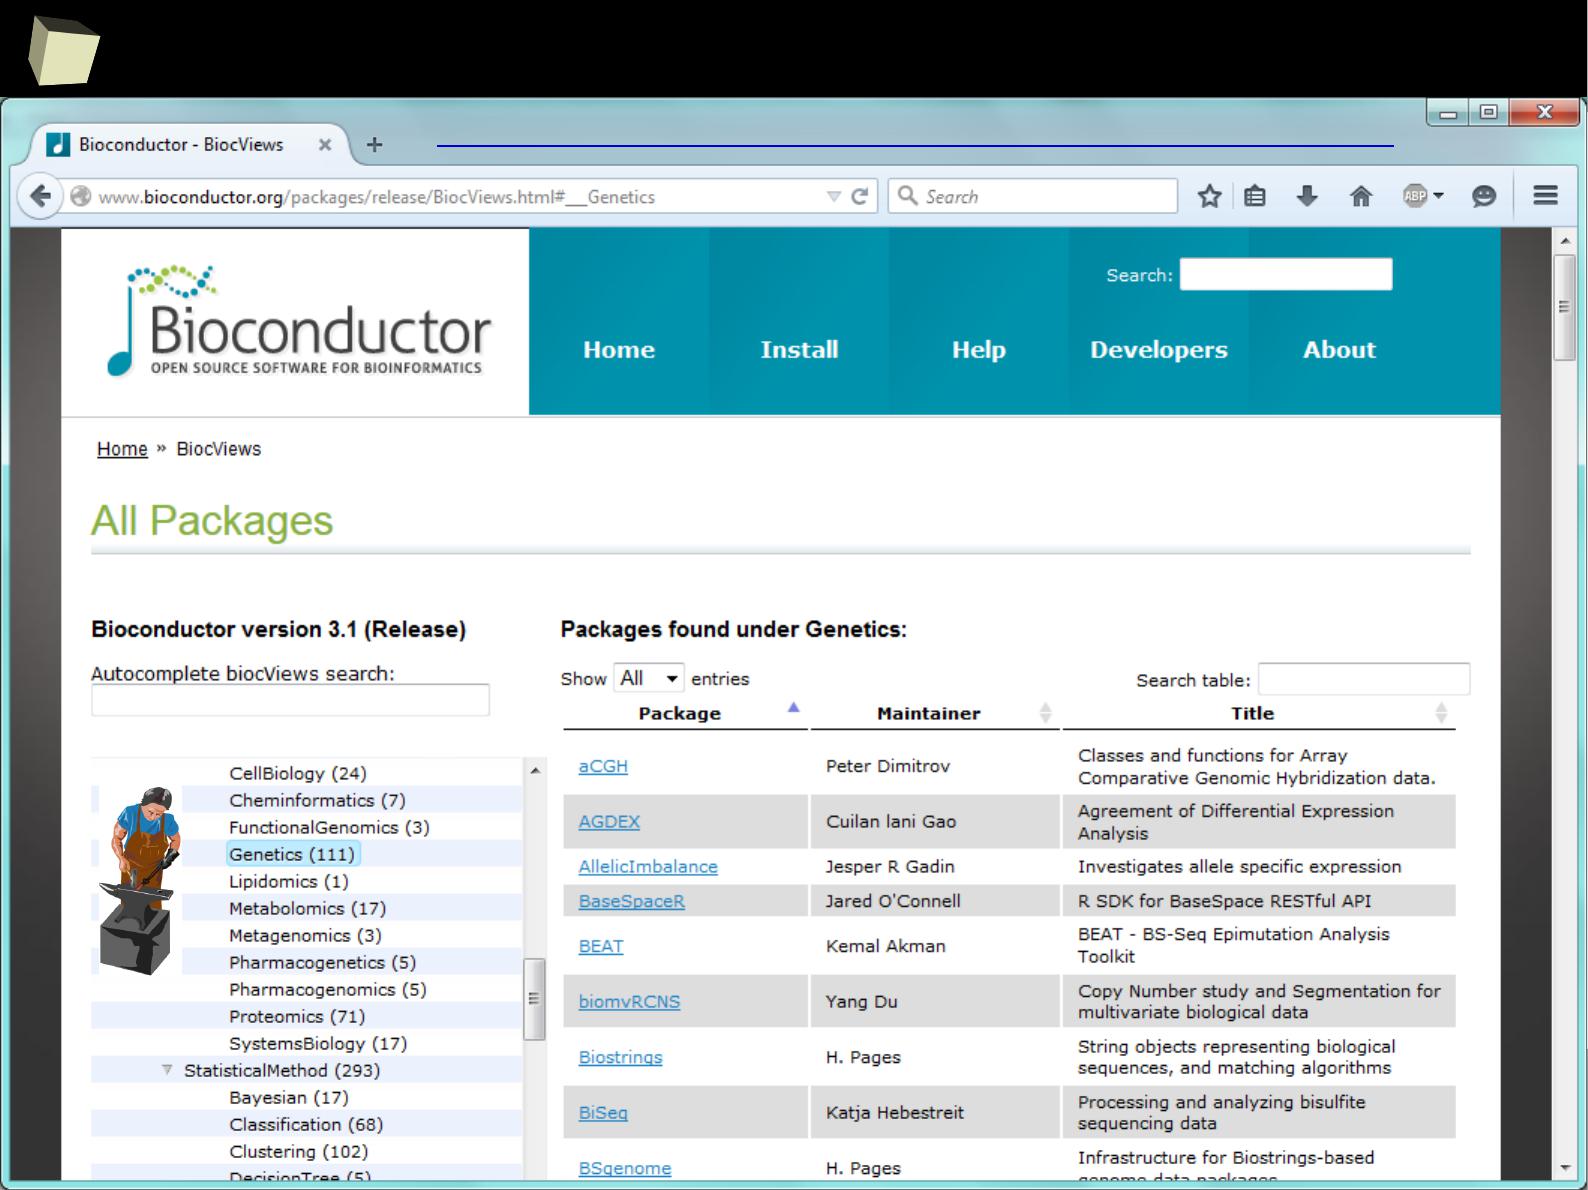
CRAN
[biostatistics]
A list of thematic sections covered by the CRAN repository:
●
Bayesian Inference
●
Chemometrics and Computational Physics
●
Clinical Trial Design, Monitoring, and Analysis
●
Cluster Analysis & Finite Mixture Models
●
Differential Equations
●
Probability Distributions
●
Computational Econometrics
●
Analysis of Ecological and Environmental Data
●
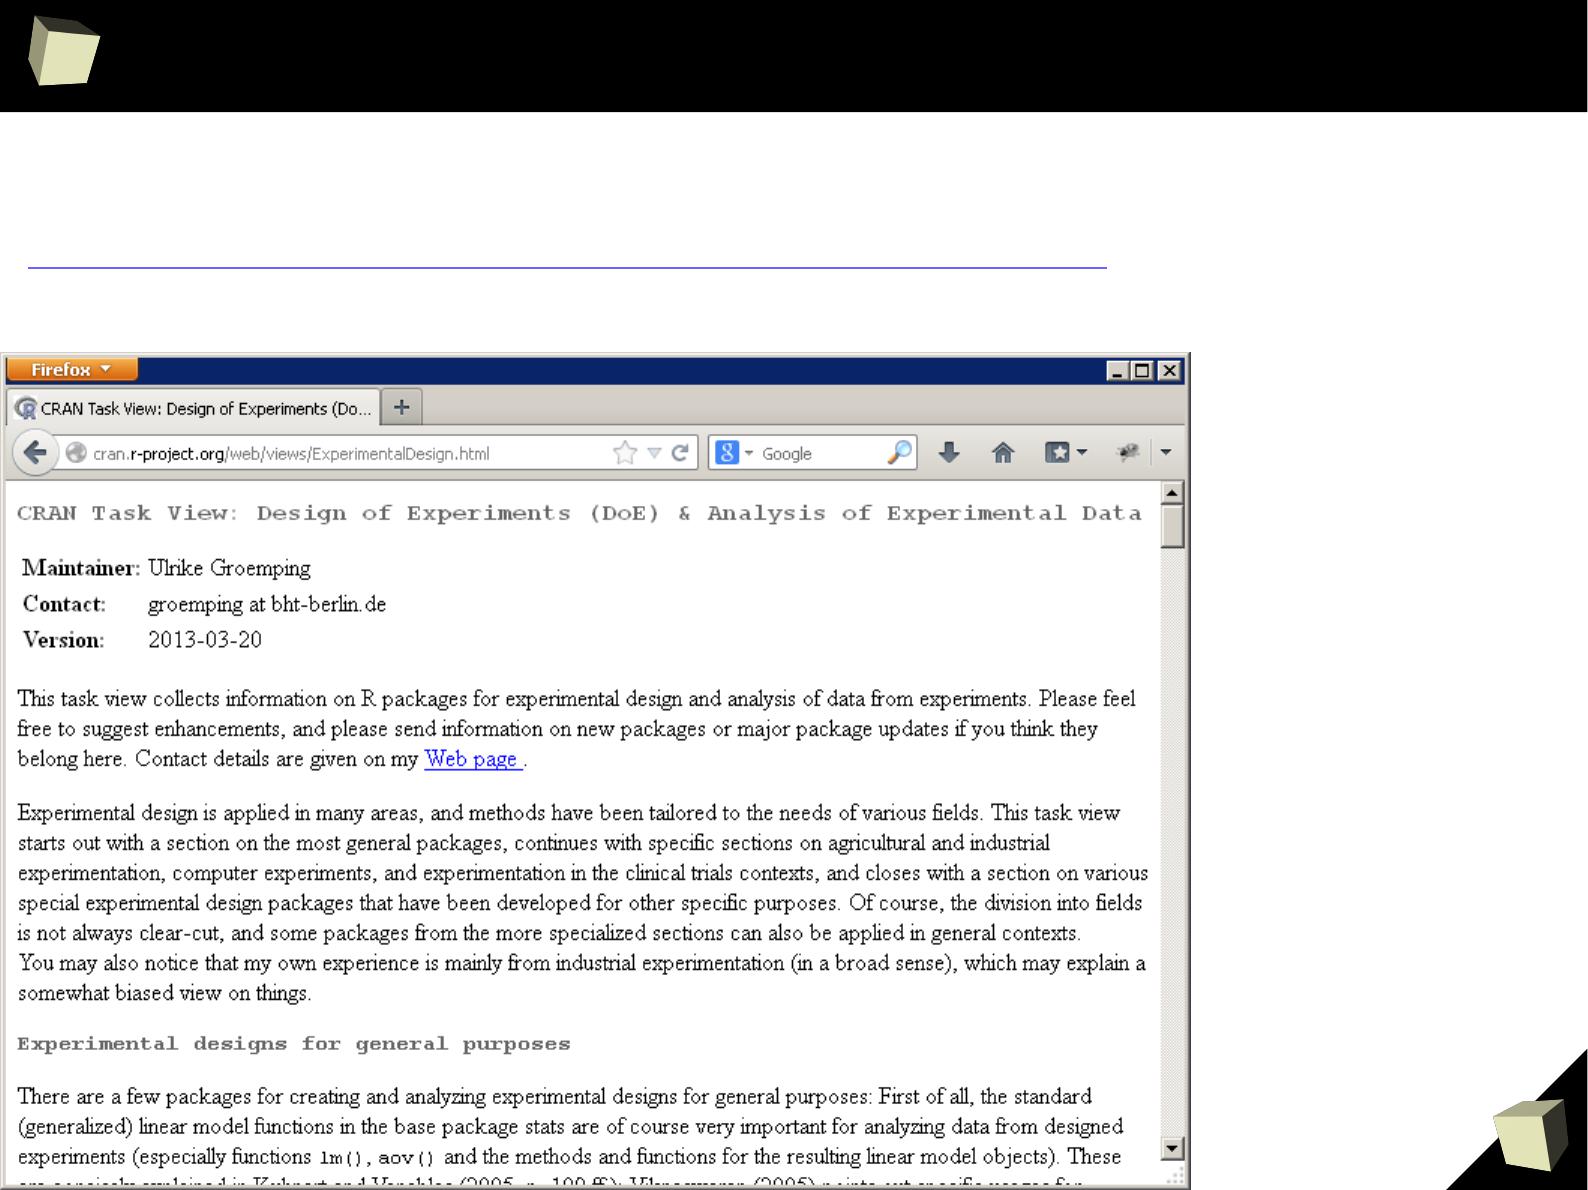
Design of Experiments (DoE) & Analysis of Experimental Data
●
Empirical Finance
●
Statistical Genetics
●
Graphic Displays & Dynamic Graphics & Graphic Devices &
Visualization
●
High-Performance and Parallel Computing with R
●
Machine Learning & Statistical Learning
●
Medical Image Analysis
●
Meta-Analysis
●
Multivariate Statistics
●
Natural Language Processing
●
Numerical Mathematics
●
Official Statistics & Survey Methodology
●
Optimization and Mathematical Programming
●
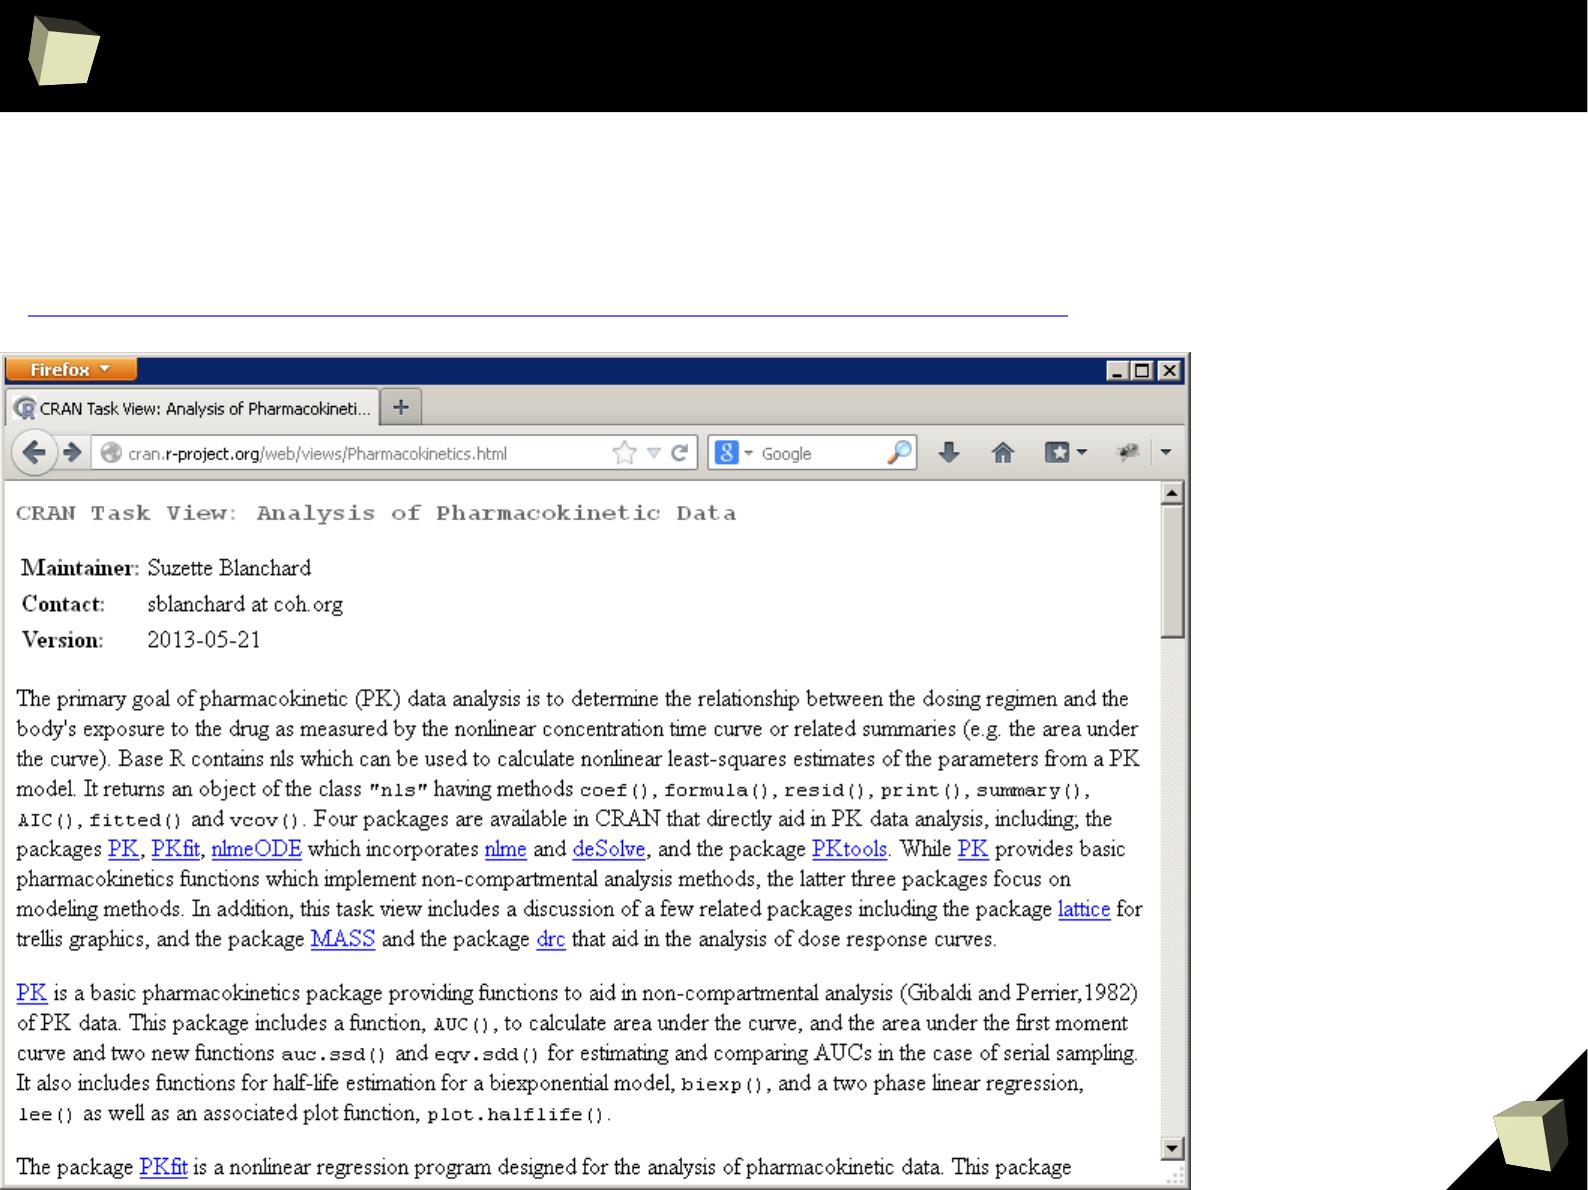
Analysis of Pharmacokinetic Data
●
Phylogenetics, Especially Comparative Methods
●
Psychometric Models and Methods
●
Reproducible Research
●
Robust Statistical Methods
●
Statistics for the Social Sciences
●
Analysis of Spatial Data
●
Handling and Analyzing Spatio-Temporal Data
●
Survival Analysis
●
Time Series Analysis
●
Web Technologies and Services
●
gRaphical Models in R

5
7
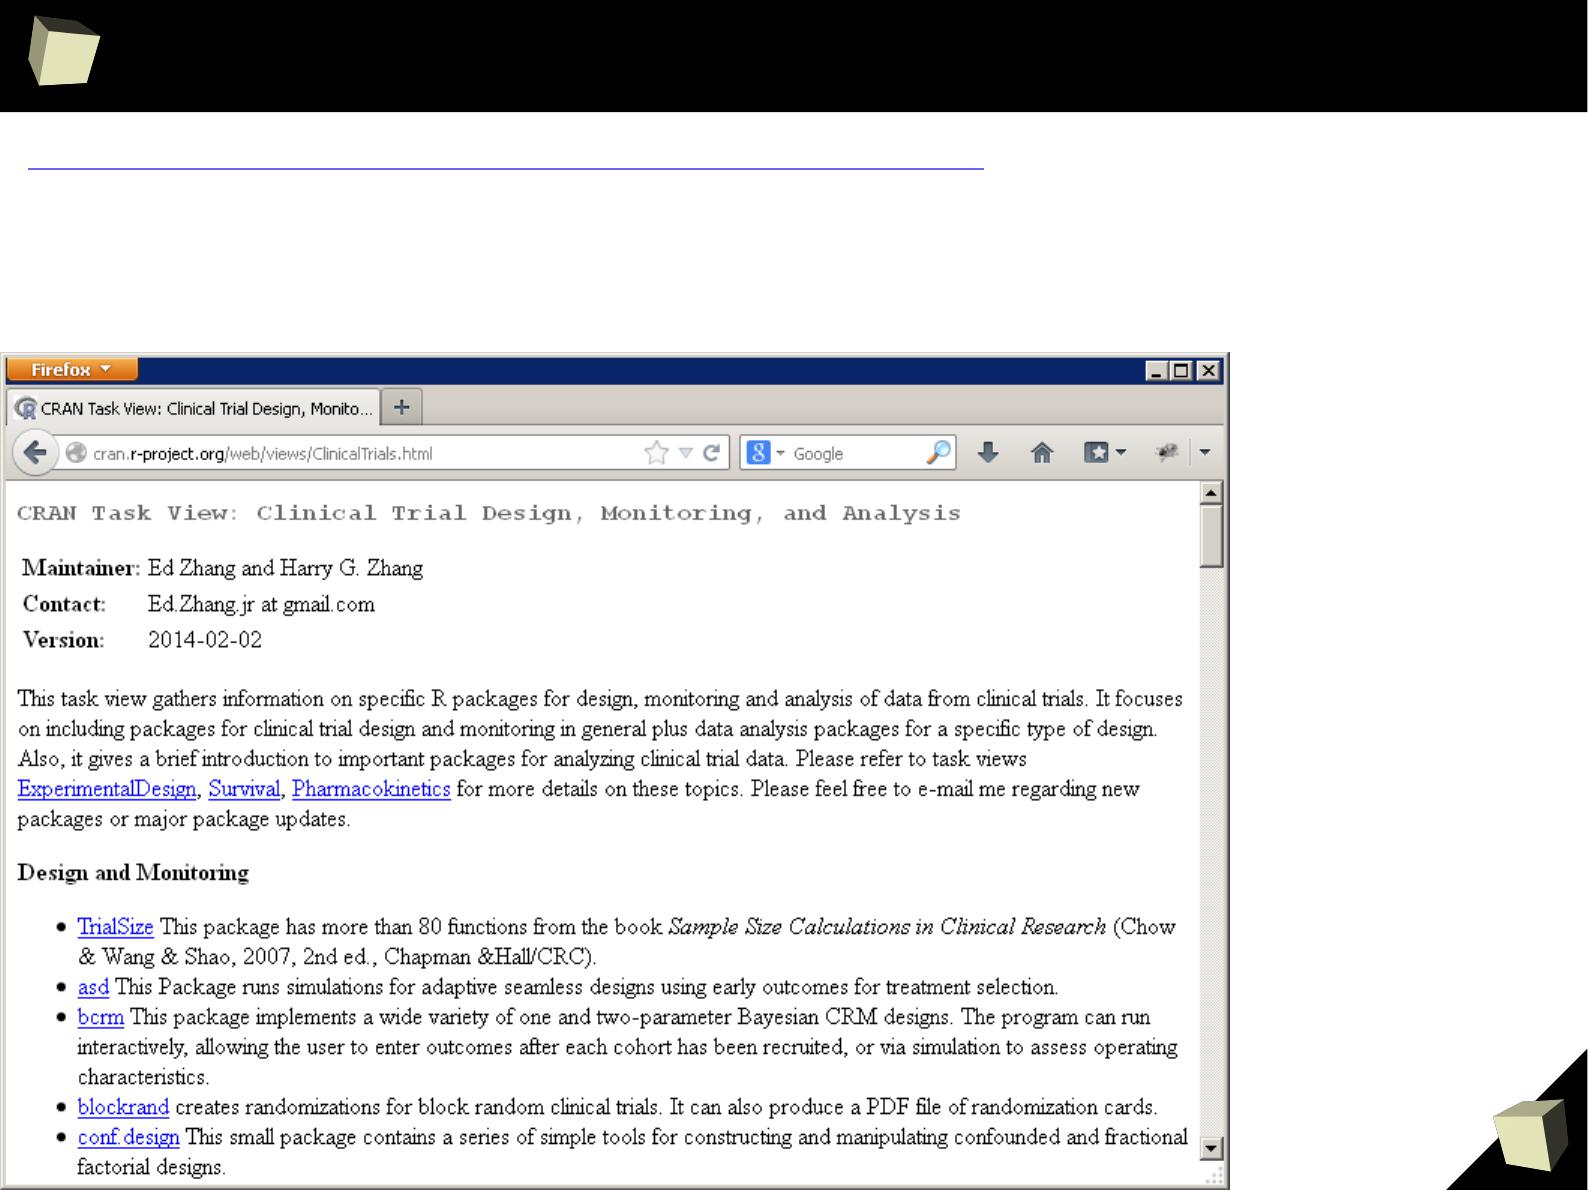
Clinical Research
What kind of analyses common in clinical research can be done in R?
●
Descriptive statistics, summaries (demographic, recruitment)
●
Advanced, linear and nonlinear modeling (models of any type)
●
Comparisons of treatments
●
PK / PD analysis
●
Analysis of bio-equivalence, non-inferiority, superiority
●
Design of experiments
●
Time-to-event analysis (survival analysis)
●
Analysis of data from longitudinal trials
●
Sample size determination and power analysis
●
Meta-analysis
●
Bayesian analyzes
●
Analysis of Adverse Events
●
Analysis of DNA micro-arrays
●
ROC curves
5
8
Clinical Research
http://cran.r-project.org/web/views/ClinicalTrials.html
●
adaptTest
●
AGSDest
●
asd
●
asypow
●
bcrm
●
bifactorial
●
blockrand
●
clinfun
●
clinsig
●
coin
●
conf.design
●
copas
●
CRM
●
CRTSize
●
dfcrm
●
DoseFinding
●
epibasix
●
epicalc
●
experiment
●
FrF2
●
GroupSeq
●
gsDesign
●
HH
●
Hmisc
●
ldbounds
●
longpower
●
MChtest
●
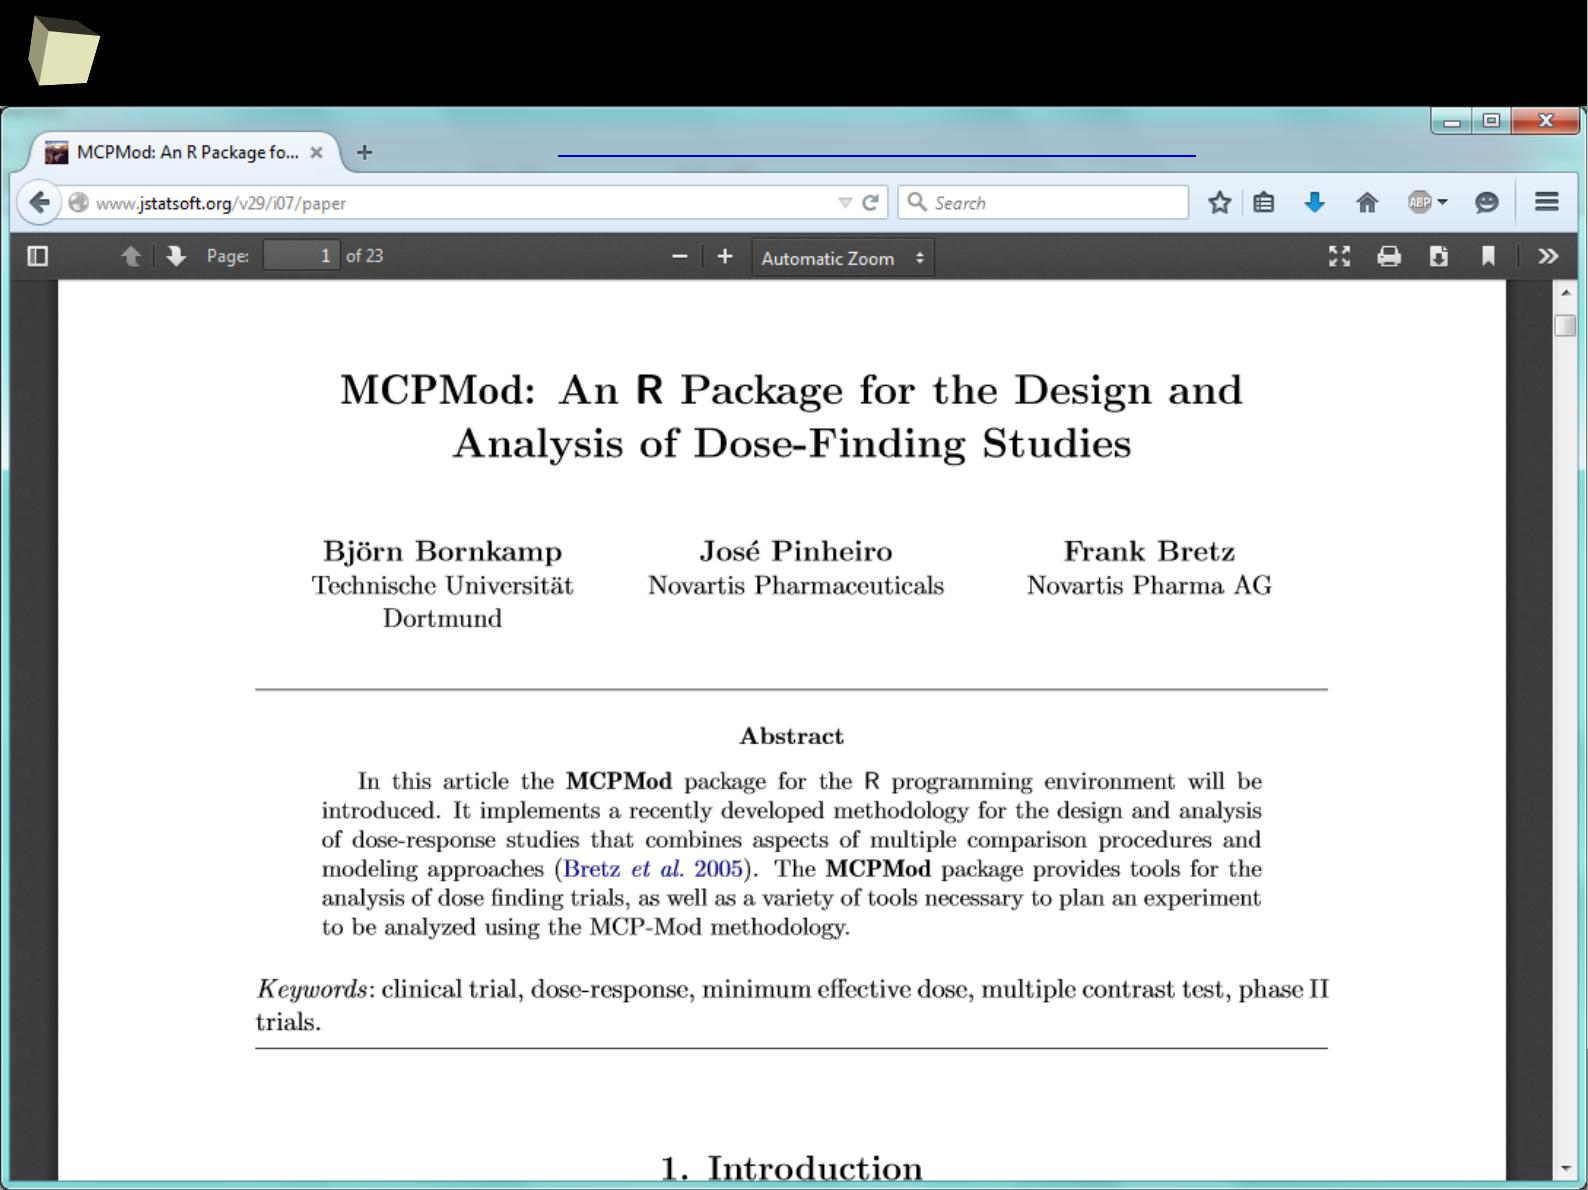
MCPMod
●
meta
●
metafor
●
metaLik
●
multcomp
●
nppbib
●
PIPS
●
PowerTOST
●
pwr
●
PwrGSD
●
qtlDesign
●
rmeta
●
samplesize
●
seqmon
●
speff2trial
●
ssanv
●
survival
●
tdm
●
TEQR
●
TrialSize
CRAN packages:
http://cran.r-project.org/web/views/Survival.html
http://cran.r-project.org/web/views/ExperimentalDesign.html
http://cran.r-project.org/web/views/Pharmacokinetics.html
5
9
Clinical Research
Package: TrialSize
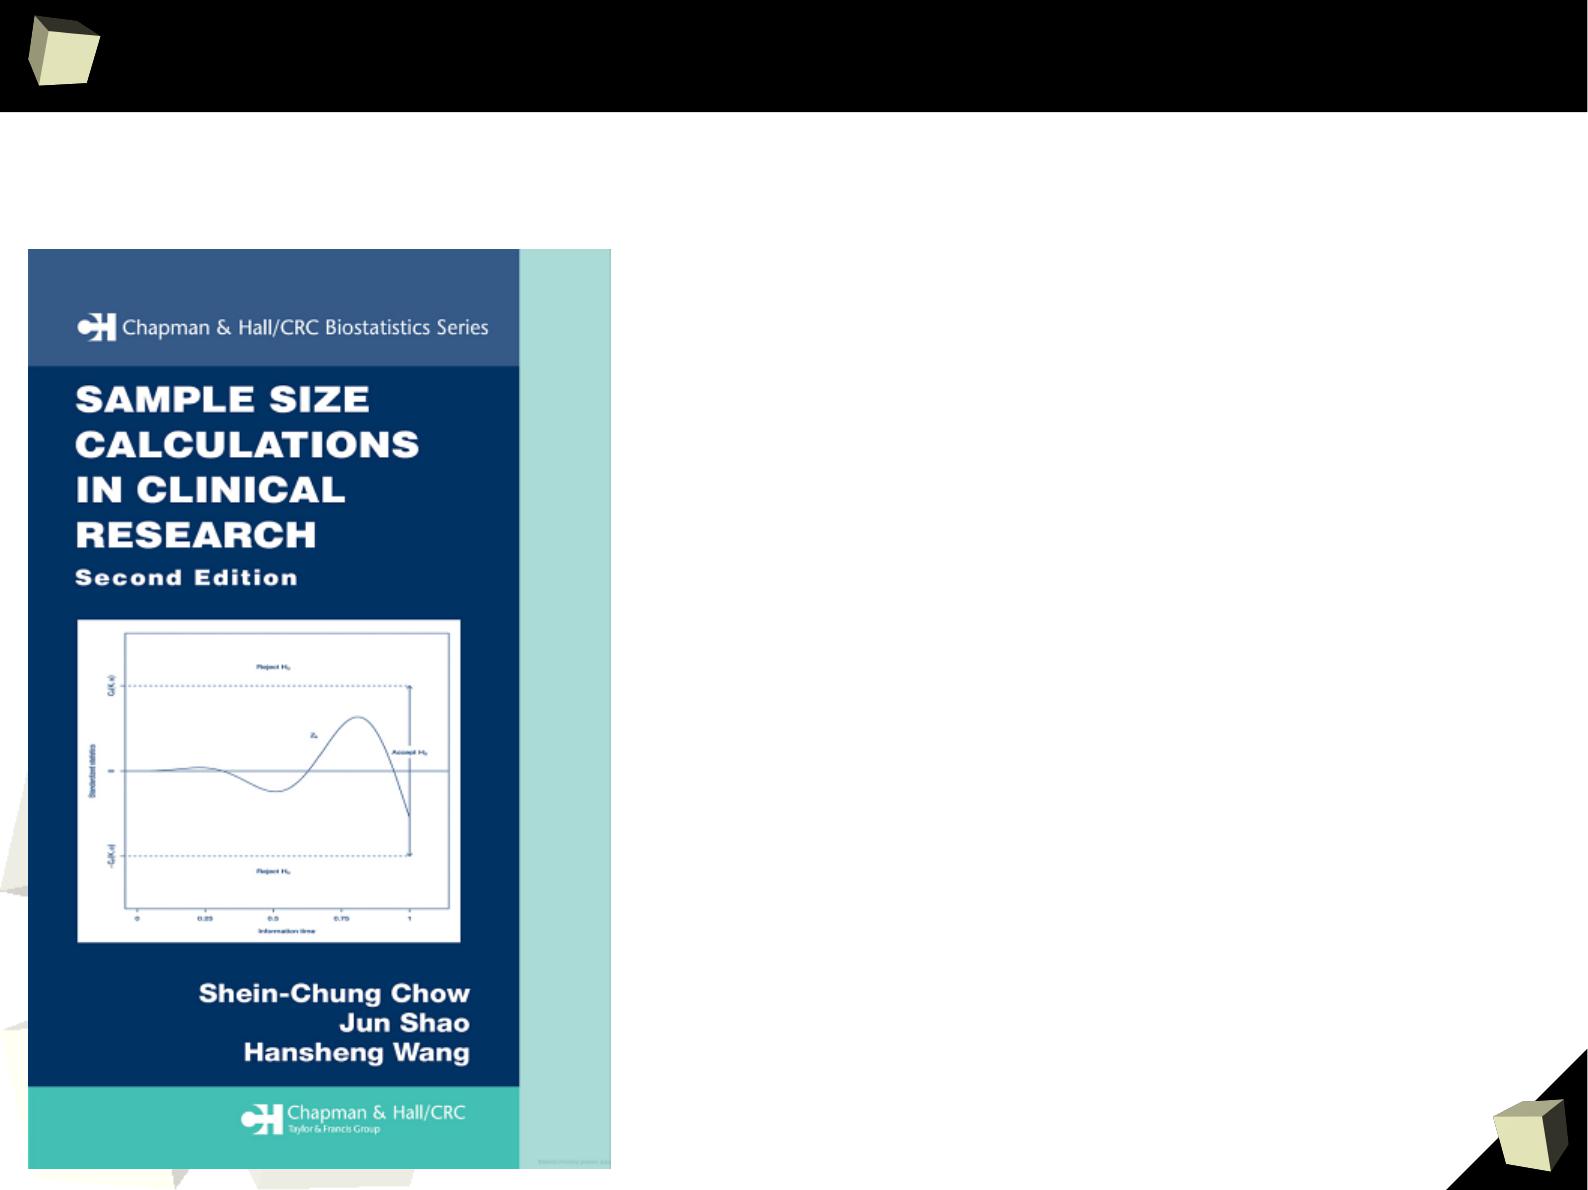
“More than 80 functions in this package are widely used to
calculate sample size in clinical trial research studies.
This package covers the functions in Chapter
3,4,6,7,9,10,11,12,14,15 of the reference book”
AB.withDescalation
AB.withoutDescalation
ABE
ANOVA.Repeat.Measure
Carry.Over
Cochran.Armitage/Trend
Cox.Equality
Cox.Equivalence
Cox.NIS
CrossOver.ISV.Equality
CrossOver.ISV.Equivalence
CrossOver.ISV.NIS
Dose.MinE.ffect
Dose.Response.binary
Dose.Response.Linear
Dose.Response.time.to.event
gof.Pearson
gof.Pearson.twoway
IBE
InterSV.Equality
InterSV.NIS
ISCV.Equality
ISCV.Equivalence
ISCV.NIS
ISV.Equality
ISV.Equivalence
ISV.NIS
McNemar.Test
MeanWilliamsDesign.Equality
MeanWilliamsDesign.Equivalence
MeanWilliamsDesign.NIS
Multiple.Testing
Nonpara.Independ
Nonpara.One.Sample
Nonpara.Two.Sample
OneSampleMean.Equality
OneSampleMean.Equivalence
OneSampleMean.NIS
OneSampleProportion.Equality
OneSampleProportion.Equivalence
OneSampleProportion.NIS
OneSide.fixEffect
OneSide.varyEffect
OneWayANOVA.pairwise
OneWayANOVA.PairwiseComparison
PBE
Propensity.Score.nostrata
Propensity.Score.strata
QOL
QT.crossover
QT.parallel
QT.PK.crossover
QT.PK.parallel
RelativeRisk.Equality
RelativeRisk.Equivalence
RelativeRisk.NIS
RelativeRiskCrossOver.Equality
RelativeRiskCrossOver.Equivalence
RelativeRiskCrossOver.NIS
Sensitivity.Index
Stuart.Maxwell.Test
TwoSampleCrossOver.Equality
TwoSampleCrossOver.Equivalence
TwoSampleCrossOver.NIS
TwoSampleMean.Equality
TwoSampleMean.Equivalence
TwoSampleMean.NIS
TwoSampleProportion.Equality
TwoSampleProportion.Equivalence
TwoSampleProportion.NIS
TwoSampleSeqCrossOver.Equality
TwoSampleSeqCrossOver.Equivalence
TwoSampleSeqCrossOver.NIS
TwoSampleSurvival.Conditional
TwoSampleSurvival.Equality
TwoSampleSurvival.Equivalence
TwoSampleSurvival.NIS
TwoSide.fixEffect
TwoSide.varyEffect
Vaccine.CEM
Vaccine.ELDI
Vaccine.RDI
Vitro.BE
WilliamsDesign.Equality
WilliamsDesign.Equivalence
WilliamsDesign.NIS
6
0
Clinical Research
6
1
ROC I
6
2
ROC II
6
3
Clinical Research
●
AdapEnetClass
●
AER
●
ahaz
●
AIM
●
asbio
●
aster
●
aster2
●
BaSTA
●
bayesSurv
●
BayHaz
●
BGPhazard
●
Biograph
●
BMA
●
boot
●
bpcp
●
censReg
●
changeLOS
●
clinfun
●
cmprsk
●
coarseDataTools
●
coin
●
compeir
●
complex.surv.dat.
sim
●
compound.Cox
●
concreg
●
condGEE
●
CoxBoost
●
coxme
●
coxphf
●
coxphw
●
CoxRidge
●
coxrobust
●
CPE
●
CPHshape
●
CR
●
crrSC
●
crrstep
●
currentSurvival
●
DAAG
●
dblcens
●
DPpackage
●
DTDA
●
dynpred
●
dynsurv
●
eha
●
emplik
●
Epi
●
epiR
●
etm
●
exactRankTests
●
fastcox
●
FHtest
●
fitdistrplus
●
flexsurv
●
frailtyHL
●
frailtypack
●
gamlss.cens
●
gbm
●
gems
●
genSurv
●
glmpath
●
globalboosttest
●
glrt
●
gof
●
gss
●
ICE
●
intcox
●
interval
●
ipdmeta
CRAN packages:
●
ipred
●
ipw
●
jackknifeKME
●
JM
●
JMbayes
●
jmec
●
JMLSD
●
joineR
●
JPSurv
●
kaps
●
km.ci
●
kmc
●
kmconfband
●
kmi
●
KMsurv
●
lava.tobit
●
lbiassurv
●
LearnBayes
●
lmec
●
locfit
●
logconcens
●
LogicReg
●
LogrankA
●
logspline
●
lpc
●
lss
●
MAMSE
●
maxstat
●
mboost
●
MCMCglmm
●
MCMCpack
●
Mets
●
mfp
●
mixAK
●
mixPHM
●
MLEcens
●
MRsurv
●
msm
●
msSurv
●
mstate
●
muhaz
●
multcomp
●
mvna
●
mvpart
●
NADA
●
NestedCohort
●
NPHMC
●
NPMLEcmprsk
●
OIsurv
●
OrdFacReg
●
OutlierDC
●
p3state.msm
●
pamr
●
parfm
●
party
●
pec
●
penalized
●
peperr
●
PermAlgo
●
phmm
●
plsRcox
●
polspline
●
powerSurvEpi
●
prodlim
●
psbcGroup
●
pseudo
●
quantreg
●
randomForestSRC
●
RandomSurvivalForest
●
rankhazard
●
relsurv
●
rhosp
●
riskRegression
●
risksetROC
●
rms
●
RobustAFT
●
ROCt
●
rpart
●
rsig
●
saws
●
SemiCompRisks
●
SemiMarkov
●
SGL
●
simexaft
●
simMSM
●
simPH
●
SMIR
●
SmoothHazard
●
smoothHR
●
smoothSurv
●
SMPracticals
●
spatstat
●
spatsurv
●
superpc
●
surv2sampleComp
●
survAUC
●
survBayes
●
survC1
●
survexp.fr
●
survey
●
Survgini
●
survIDINRI
●
survival
●
survivalBIV
●
survivalROC
●
survJamda
●
survMisc
●
survPresmooth
●
survrec
●
SurvRegCensCov
●
survsim
●
survSNP
●
SvyNom
●
TBSSurvival
●
TestSurvRec
●
timereg
●
timeROC
●
tlmec
●
TPmsm
●
tpr
●
TraMineR
●
TSHRC
●
uniCox
●
VGAM
●
wtcrsk
●
YPmodel
http://cran.r-project.org/web/views/ClinicalTrials.html
http://cran.r-project.org/web/views/ExperimentalDesign.html
http://cran.r-project.org/web/views/Pharmacokinetics.html
http://cran.r-project.org/web/views/Survival.html
6
4
Clinical Research
●
agricolae
●
AlgDesign
●
asd
●
BatchExperiments
●
BHH2
●
blockTools
●
BsMD
●
conf.design
●
crossdes
●
dae
●
desirability
●
DiceDesign
●
DiceEval
●
DiceKriging
●
DiceView
●
displayHTS
●
DoE.base
●
DoE.wrapper
●
DoseFinding
●
dynaTree
●
experiment
●
FrF2
●
FrF2.catlg128
●
GAD
●
granova
●
gsbDesign
●
gsDesign
●
ldDesign
●
lhs
●
mixexp
●
mkssd
●
mxkssd
●
odprism
●
osDesign
●
planor
●
plgp
●
qtlDesign
●
qualityTools
●
RcmdrPlugin.DoE
●
rsm
●
SensoMineR
●
support.CEs
●
TEQR
●
tgp
●
Vdgraph
CRAN packages:
http://cran.r-project.org/web/views/ClinicalTrials.html
http://cran.r-project.org/web/views/Pharmacokinetics.html
http://cran.r-project.org/web/views/Survival.html
http://cran.r-project.org/web/views/ExperimentalDesign.html
6
5
let's
gs
Design it!
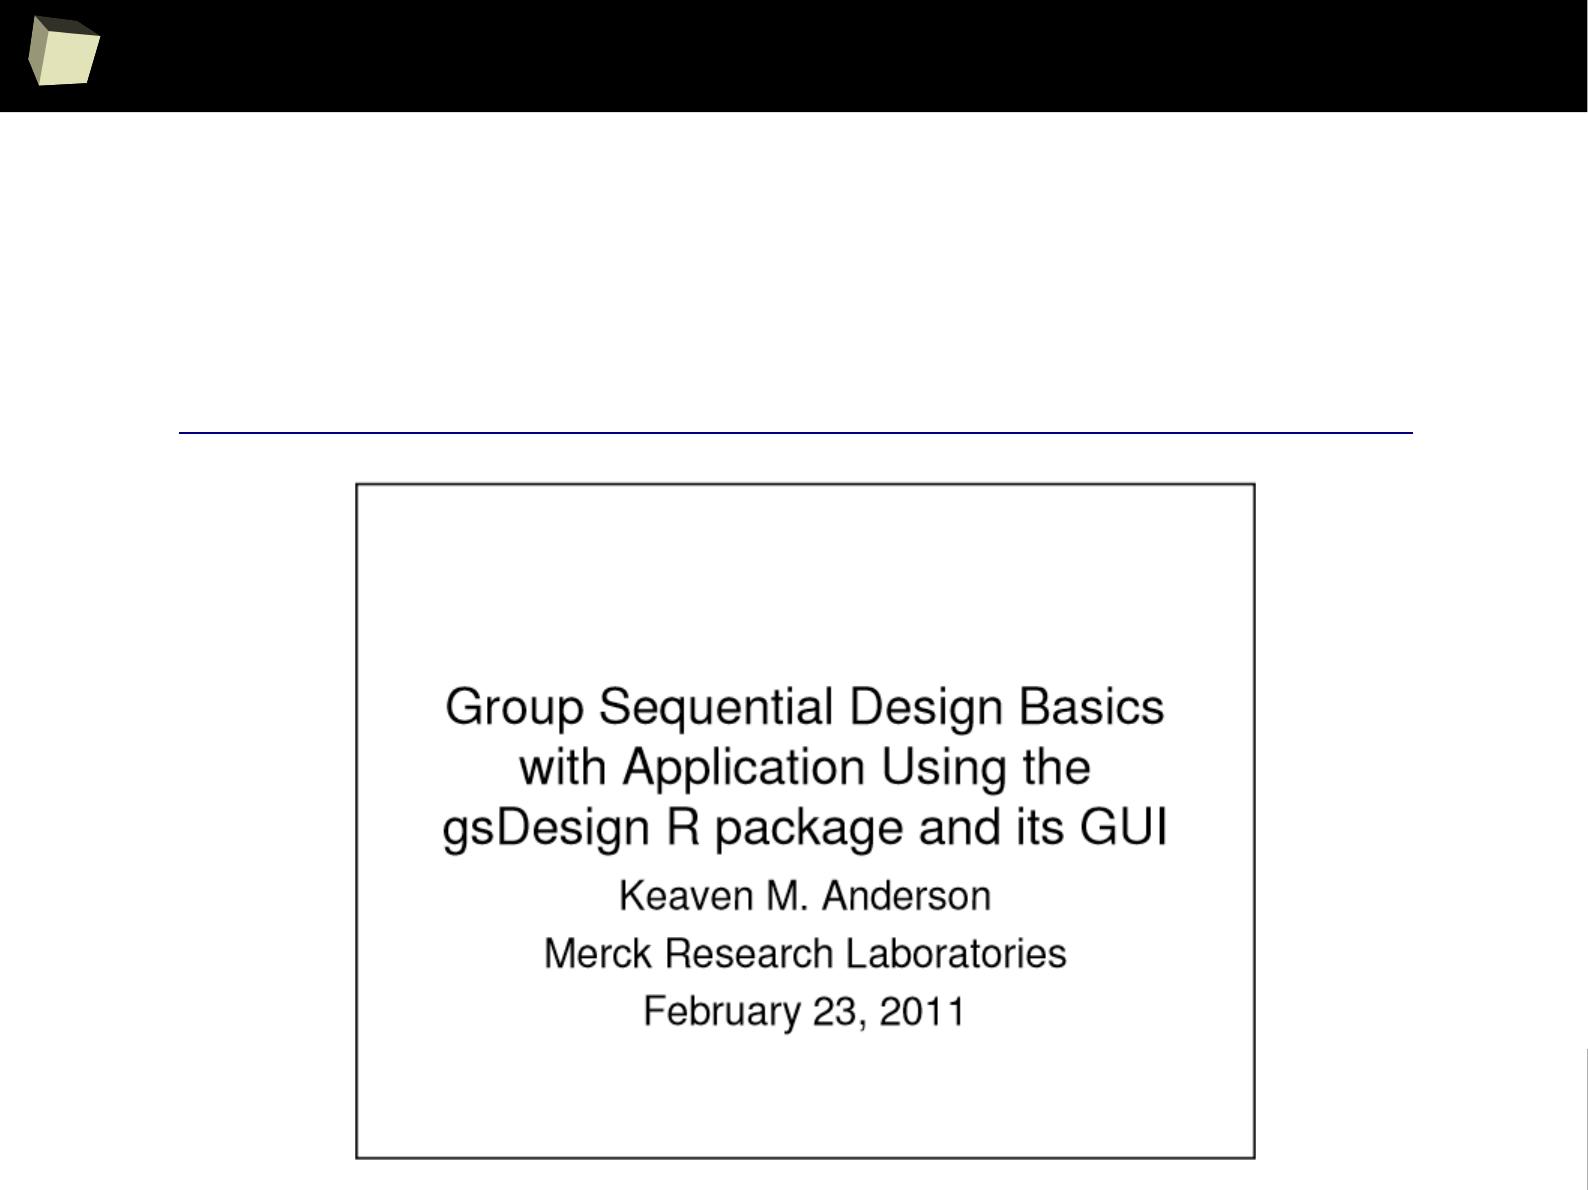
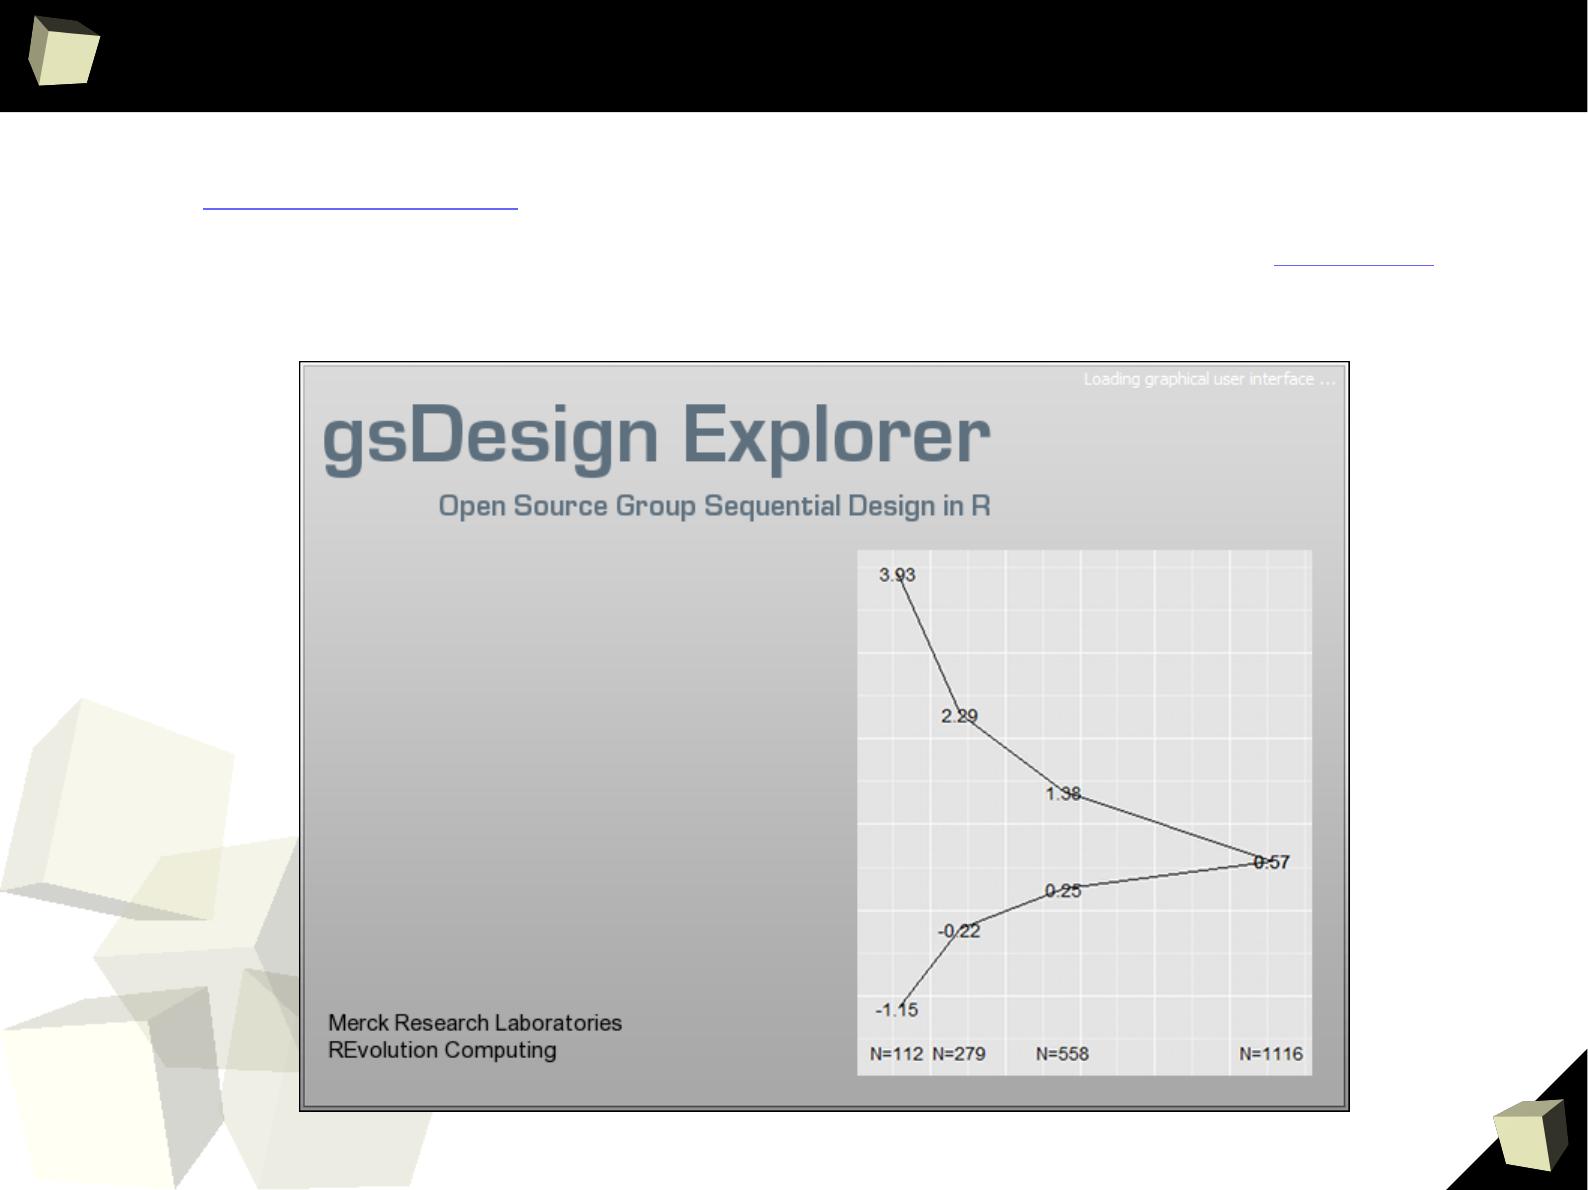
Some R packages are real gems! Meet gsDesign, a package for deriving and
describing group sequential designs, created by Keaven Anderson (Merck) and
REVOlution Computing to optimize Merck's clinical trial process...
http://www.amstat.org/sections/sbiop/webinars/2011/AndersonWebinar2-23-2011.pdf
6
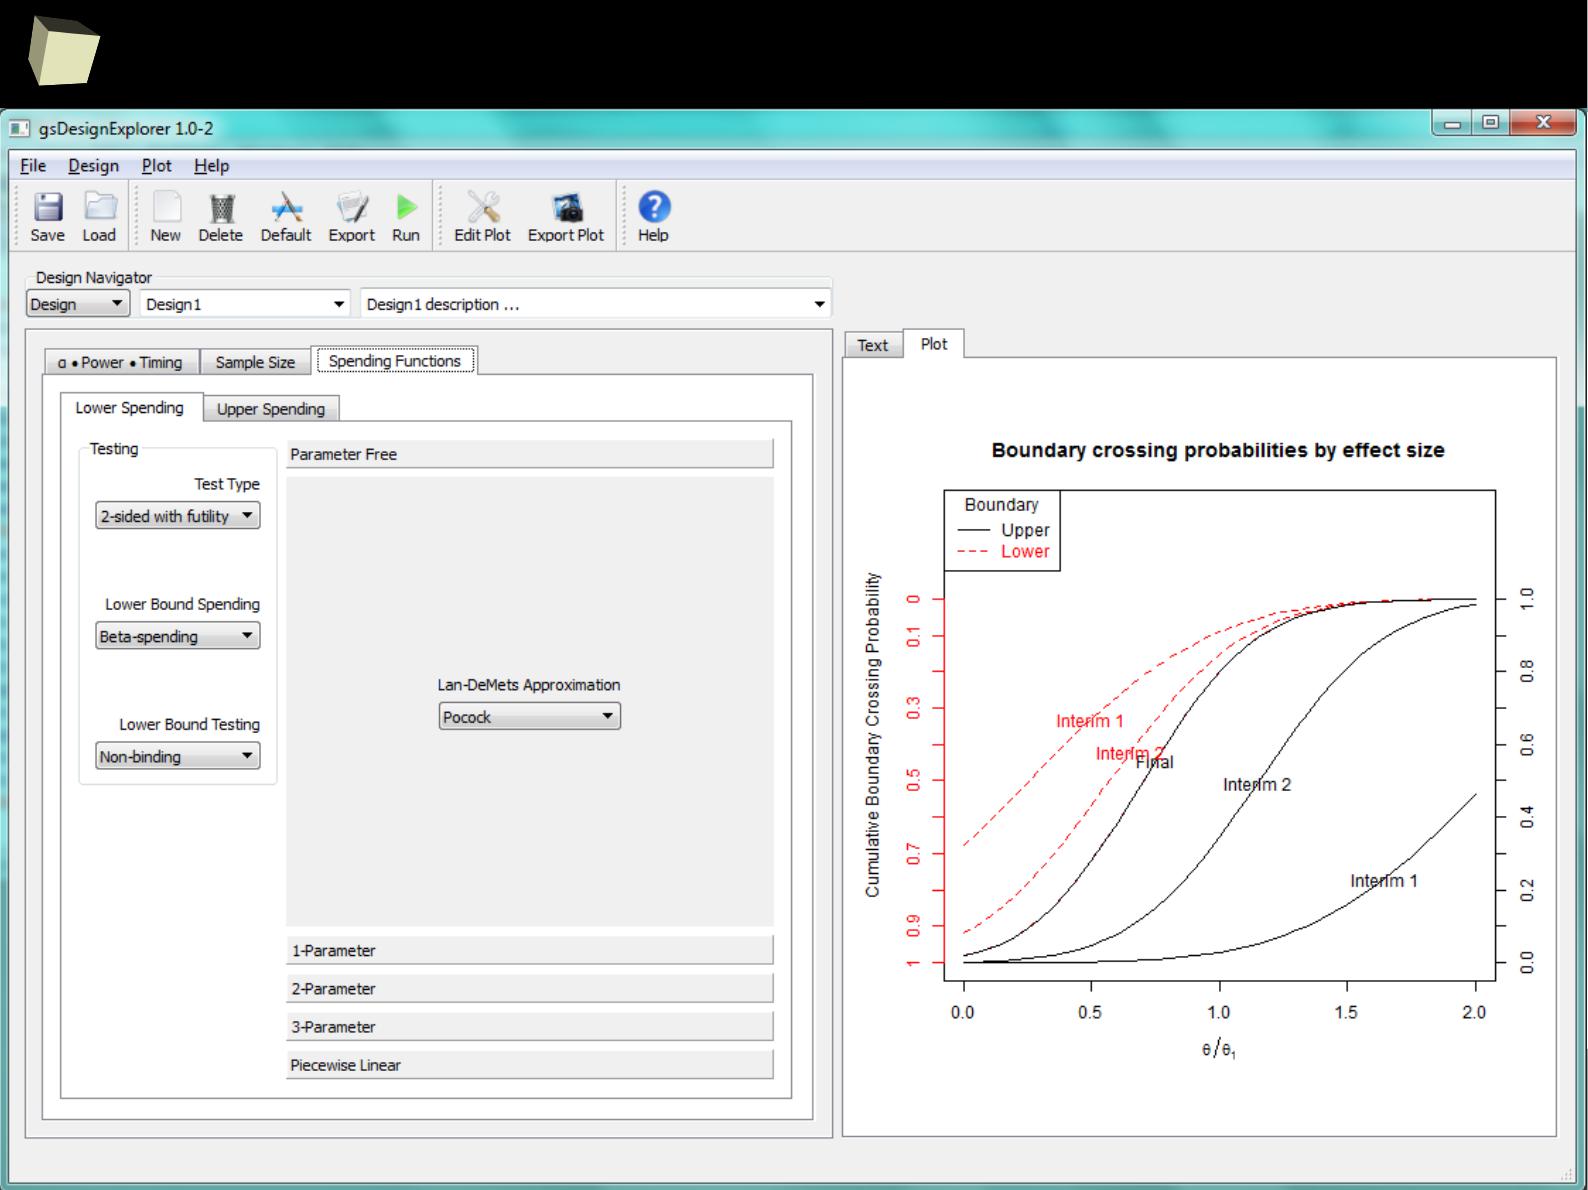
7
gsDesignExplorer
6
8
Clinical Research
http://cran.r-project.org/web/views/ClinicalTrials.html
http://cran.r-project.org/web/views/ExperimentalDesign.html
http://cran.r-project.org/web/views/Survival.html
http://cran.r-project.org/web/views/Pharmacokinetics.html
●
deSolve
●
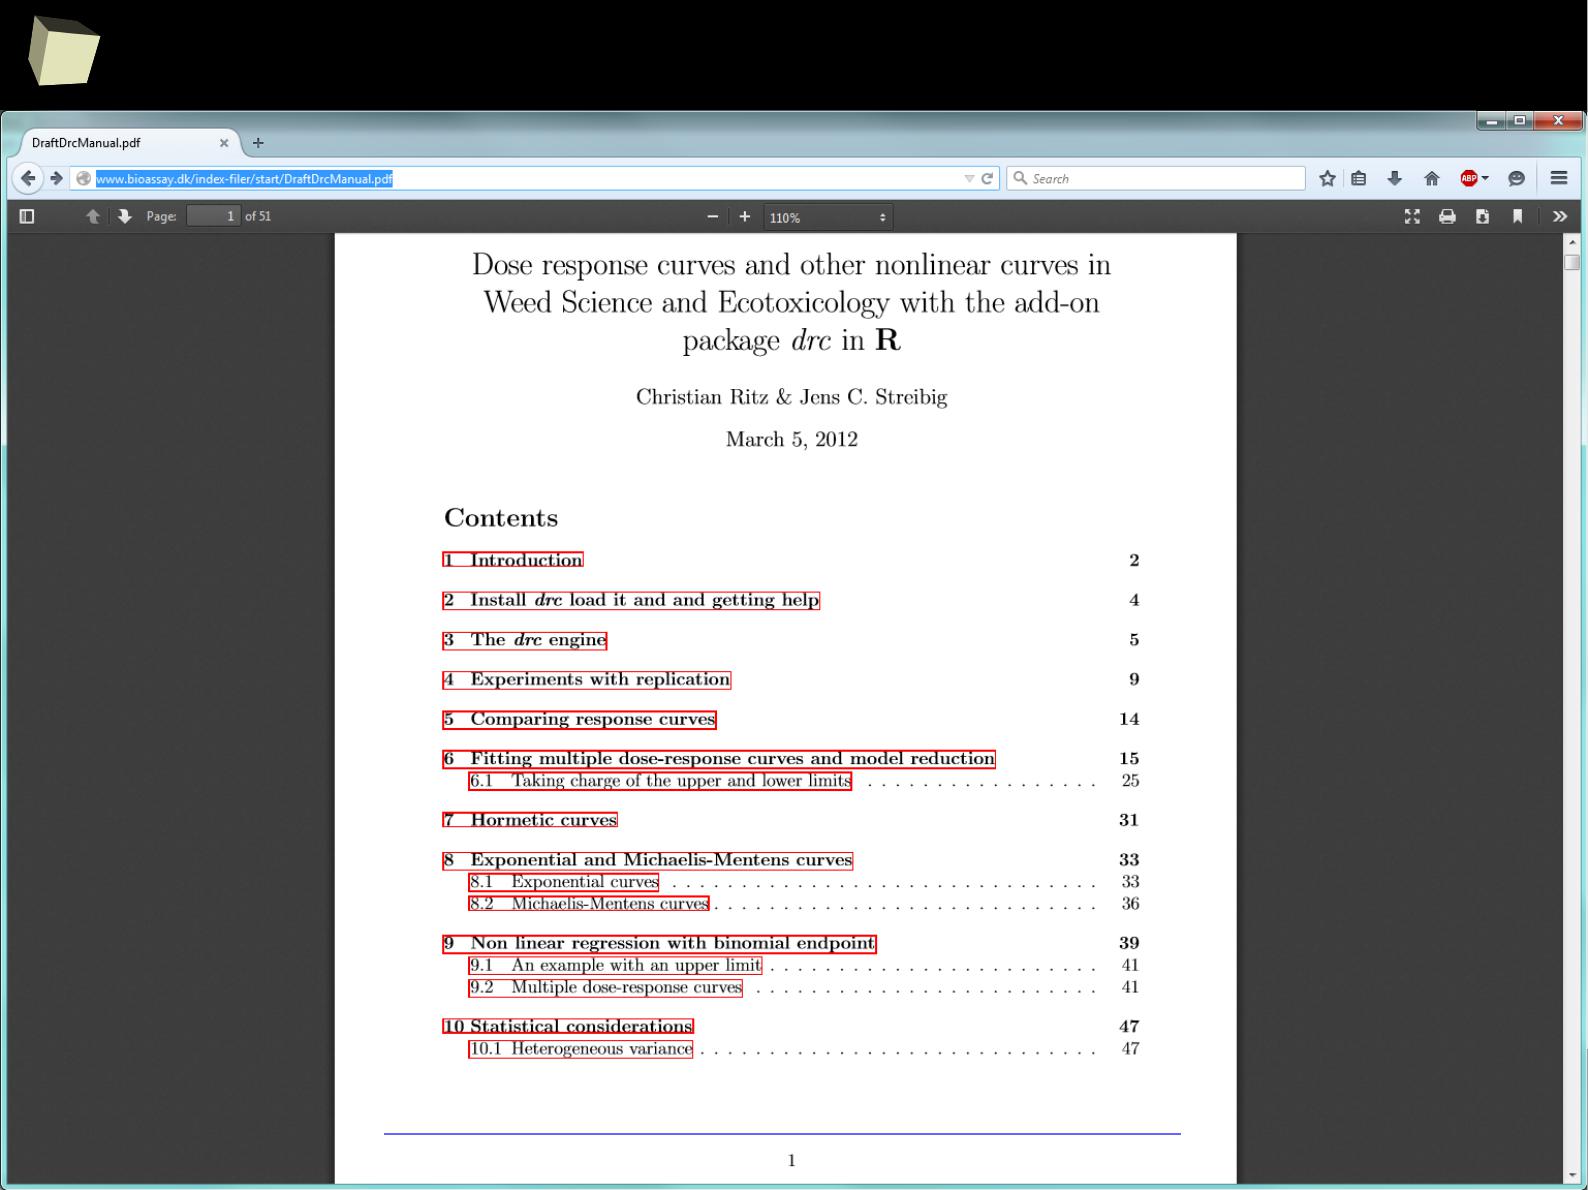
drc
●
lattice
●
MASS
●
nlme
●
nlmeODE
●
PK
●
PKfit
●
PKPDmodels
●
PKtools
CRAN packages:

7
0
Analysis of dose-Response curves
●
actimL Model function for the universal response surface approach (URSA) for the
quantitative assessment of drug interaction
●
anova.drc ANOVA for dose-response model fits
●
AR.2 Asymptotic regression model
●
AR.3 Asymptotic regression model
●
baro5 The modified baro5 function
●
BC.4 The Brain-Cousens hormesis models
●
BC.5 The Brain-Cousens hormesis models
●
bcl3 The Brain-Cousens hormesis models
●
bcl4 The Brain-Cousens hormesis models
●
boxcox.drc Transform-both-sides Box-Cox transformation
●
braincousens The Brain-Cousens hormesis models
●
cedergreen The Cedergreen-Ritz-Streibig model
●
coef.drc Extract Model Coefficients
●
comped Comparison of effective dose values
●
compParm Comparison of parameters
●
confint.drc Confidence Intervals for model parameters
●
CRS.4a The Cedergreen-Ritz-Streibig model
●
CRS.4b The Cedergreen-Ritz-Streibig model
●
CRS.4c The Cedergreen-Ritz-Streibig model
●
CRS.5a Cedergreen-Ritz-Streibig dose-reponse model for describing hormesis
●
CRS.5b Cedergreen-Ritz-Streibig dose-reponse model for describing hormesis
●
CRS.5c Cedergreen-Ritz-Streibig dose-reponse model for describing hormesis
●
CRS.6 The Cedergreen-Ritz-Streibig model
●
diagnostics Information on estimation
●
drm Fitting dose-response models
●
drmc Sets control arguments
●
ED Estimating effective doses
●
ED.drc Estimating effective doses
●
ED.mrdrc Estimating effective doses
●
estfun.drc Bread and meat for the sandwich
●
EXD.2 Exponential decay model
●
EXD.3 Exponential decay model
●
fitted.drc Extract fitted values from model
●
FPL.4 Fractional polynomial-logistic dose-response models
●
fplogistic Fractional polynomial-logistic dose-response models
●
G.2 Mean function for the Gompertz dose-response or growth curve
●
G.3 Mean function for the Gompertz dose-response or growth curve
●
G.3u Mean function for the Gompertz dose-response or growth curve
●
G.4 Mean function for the Gompertz dose-response or growth curve
●
genBliss Model function for the universal response surface approach (URSA) for the
quantitative assessment of drug interaction
●
genBliss2 Model function for the universal response surface approach (URSA) for the
quantitative assessment of drug interaction
●
genLoewe Model function for the universal response surface approach (URSA) for the
quantitative assessment of drug interaction
●
genLoewe2 Model function for the universal response surface approach (URSA) for the
quantitative assessment of drug interaction
●
genursa Model function for the universal response surface approach (URSA) for the
quantitative assessment of drug interaction
●
getInitial Showing starting values used
●
getMeanFunctions Display available dose-response models
●
gompertz Mean function for the Gompertz dose-response or growth curve
●
gompertzd The derivative of the Gompertz function
●
gompGrowth.1 Gompertz growth models
●
gompGrowth.2 Gompertz growth models
●
gompGrowth.3 Gompertz growth models
●
iceLoewe.1 Model function for the universal response surface approach
(URSA) for the quantitative assessment of drug interaction
●
iceLoewe2.1 Model function for the universal response surface approach
(URSA) for the quantitative assessment of drug interaction
●
isobole Creating isobolograms
●
L.3 The logistic model
●
L.4 The logistic model
●
L.5 The logistic model
●
l2 The two-parameter log-logistic function
●
l3 The three-parameter log-logistic function
●
l3u The three-parameter log-logistic function
●
l4 The four-parameter log-logistic function
●
l5 The five-parameter log-logistic function
●
lin.test Lack-of-fit test for the mean structure based on cumulated
residuals
●
LL.2 The two-parameter log-logistic function
●
LL.3 The three-parameter log-logistic function
●
LL.3u The three-parameter log-logistic function
●
LL.4 The four-parameter log-logistic function
●
LL.5 The five-parameter log-logistic function
●
LL2.2 The two-parameter log-logistic function
●
LL2.3 The three-parameter log-logistic function
●
LL2.3u The three-parameter log-logistic function
●
LL2.4 The four-parameter log-logistic function
●
LL2.5 The five-parameter log-logistic function
●
llogistic The log-logistic function
●
llogistic2 The log-logistic function
●
LN.2 Log-normal dose-response model
●
LN.3 Log-normal dose-response model
●
LN.3u Log-normal dose-response model
●
LN.4 Log-normal dose-response model
●
lnormal Log-normal dose-response model
●
logistic The logistic model
●
logLik.drc Extracting the log likelihood
●
maED Estimation of ED values using model-averaging
●
MAX Maximum mean response
●
mixture Fitting binary mixture models
●
ml3a The Cedergreen-Ritz-Streibig model
●
ml3b The Cedergreen-Ritz-Streibig model
●
ml3c The Cedergreen-Ritz-Streibig model
●
ml4a Cedergreen-Ritz-Streibig dose-reponse model for describing
hormesis
●
ml4b Cedergreen-Ritz-Streibig dose-reponse model for describing
hormesis
●
ml4c Cedergreen-Ritz-Streibig dose-reponse model for describing
hormesis
●
MM.2 Michaelis-Menten model
●
MM.3 Michaelis-Menten model
●
modelFit Assessing the model fit

7
1
Analysis of dose-Response curves [cont'd]
●
mr.test Mizon-Richard test for dose-response models
●
mrdrm Model-robust dose-response modelling
●
mselect Model selection
●
NEC Dose-response model for estimation of no effect concentration (NEC).
●
NEC.2 Dose-response model for estimation of no effect concentration (NEC).
●
NEC.3 Dose-response model for estimation of no effect concentration (NEC).
●
NEC.4 Dose-response model for estimation of no effect concentration (NEC).
●
neill.test Neill's lack-of-fit test for dose-response models
●
plot.drc Plotting fitted curves for a 'drc' or 'mrdrc' object
●
plot.mrdrc Plotting fitted curves for a 'drc' or 'mrdrc' object
●
PR Expected or predicted response
●
predict.drc Prediction
●
predict.mrdrc Prediction
●
print.drc Printing key features
●
print.mrdrc Printing key features
●
print.summary.drc Printing summary of non-linear model fits
●
rdrm Simulating a dose-response curve
●
relpot Comparing selectivity indices across curves
●
residuals.drc Extracting residuals from model
●
ryegrass Effect of ferulic acid on growth of ryegrass
●
S.capricornutum Effect of cadmium on growth of green alga
●
searchdrc Searching through a range of initial parameter values to obtain
convergence
●
secalonic Root length measurements
●
SI Comparing selectivity indices across curves
●
simDR Simulating ED values under various scenarios
●
summary.drc Summarising non-linear model fits
●
twophase Two-phase dose-response model
●
ucedergreen The Cedergreen-Ritz-Streibig model
●
UCRS.4a The Cedergreen-Ritz-Streibig model
●
UCRS.4b The Cedergreen-Ritz-Streibig model
●
UCRS.4c The Cedergreen-Ritz-Streibig model
●
UCRS.5a Cedergreen-Ritz-Streibig dose-reponse model for describing hormesis
●
UCRS.5b Cedergreen-Ritz-Streibig dose-reponse model for describing hormesis
●
UCRS.5c Cedergreen-Ritz-Streibig dose-reponse model for describing hormesis
●
uml3a The Cedergreen-Ritz-Streibig model
●
uml3b The Cedergreen-Ritz-Streibig model
●
uml3c The Cedergreen-Ritz-Streibig model
●
uml4a Cedergreen-Ritz-Streibig dose-reponse model for describing hormesis
●
uml4b Cedergreen-Ritz-Streibig dose-reponse model for describing hormesis
●
uml4c Cedergreen-Ritz-Streibig dose-reponse model for describing hormesis
●
update.drc Updating and re-fitting a model
●
ursa Model function for the universal response surface approach (URSA) for the
quantitative assessment of drug interaction
●
vcov.drc Calculating variance-covariance matrix for objects of class 'drc'
●
W1.2 The two-parameter Weibull functions
●
W1.3 The three-parameter Weibull functions
●
W1.3u The three-parameter Weibull functions
●
W1.4 The four-parameter Weibull functions
●
w2 The two-parameter Weibull functions
●
W2.2 The two-parameter Weibull functions
●
W2.3 The three-parameter Weibull functions
●
W2.3u The three-parameter Weibull functions
●
W2.4 The four-parameter Weibull functions
●
W2x.3 The three-parameter Weibull functions
●
W2x.4 The four-parameter Weibull functions
●
w3 The three-parameter Weibull functions
●
w4 The four-parameter Weibull functions
●
weibull1 Weibull model functions
●
weibull2 Weibull model functions
●
weibull2x Weibull model functions
●
yieldLoss Calculating yield loss parameters

7
4
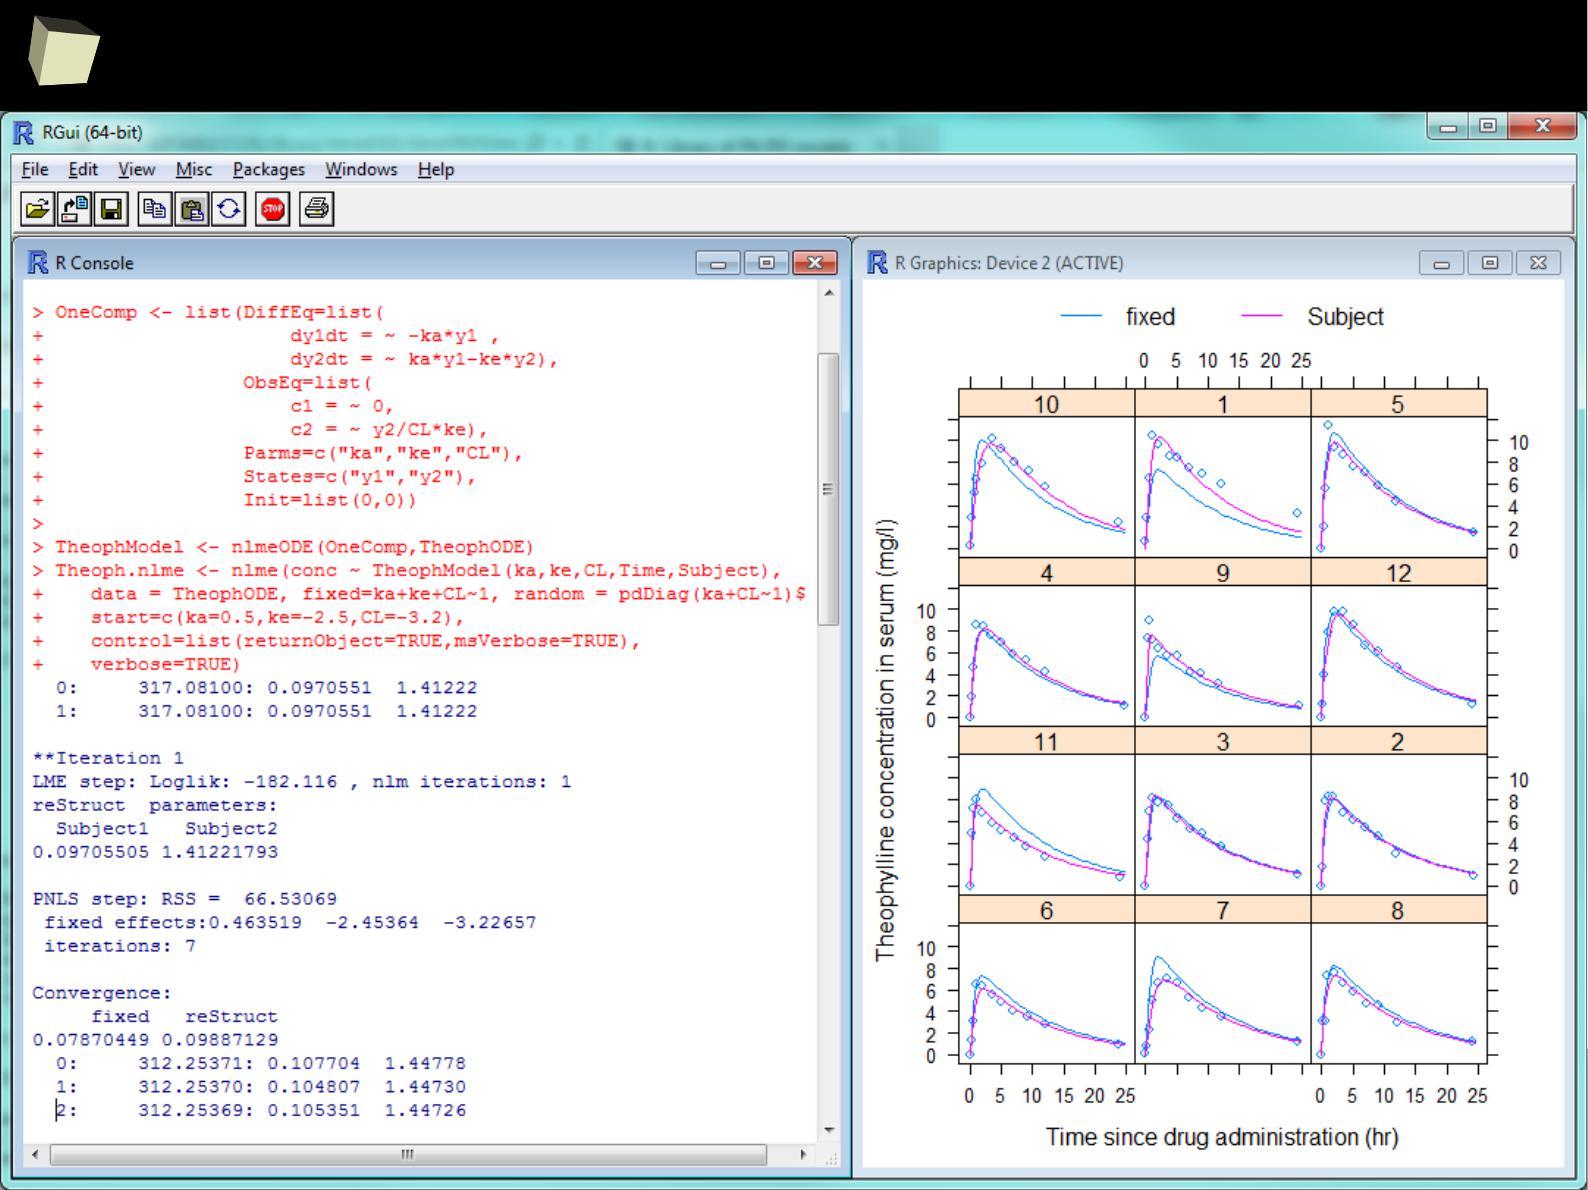
Advanced PK modeling with mixed effects
nlmeODE is a powerful combination of the famous nlme package with deSolve
(an ordinary differential equations solver) for non-linear, mixed-effects
modelling, designed especially for pharmaceutical research.
The package also includes several PK examples such as one- and two-
compartment models with multiple doses and infusions.
●
Pharmacokinetics of Theophylline
●
Pharmacokinetics of Indomethacine
●
Absorption model with estimation of time/rate of infusion
●
Simulation and simultaneous estimation of PK/PD data
●
Minimal Model of Glucose and Insulin
●
Minimal Model of Glucose using observed insulin as forcing function
http://www.inside-r.org/packages/cran/nlmeODE/docs/PKPDmodels
7
5
Advanced PK modeling with mixed effects
7
6
R + ADMB (automatic diffeRentiation!)
7
7
R + ADMB (automatic diffeRentiation!)
8
2
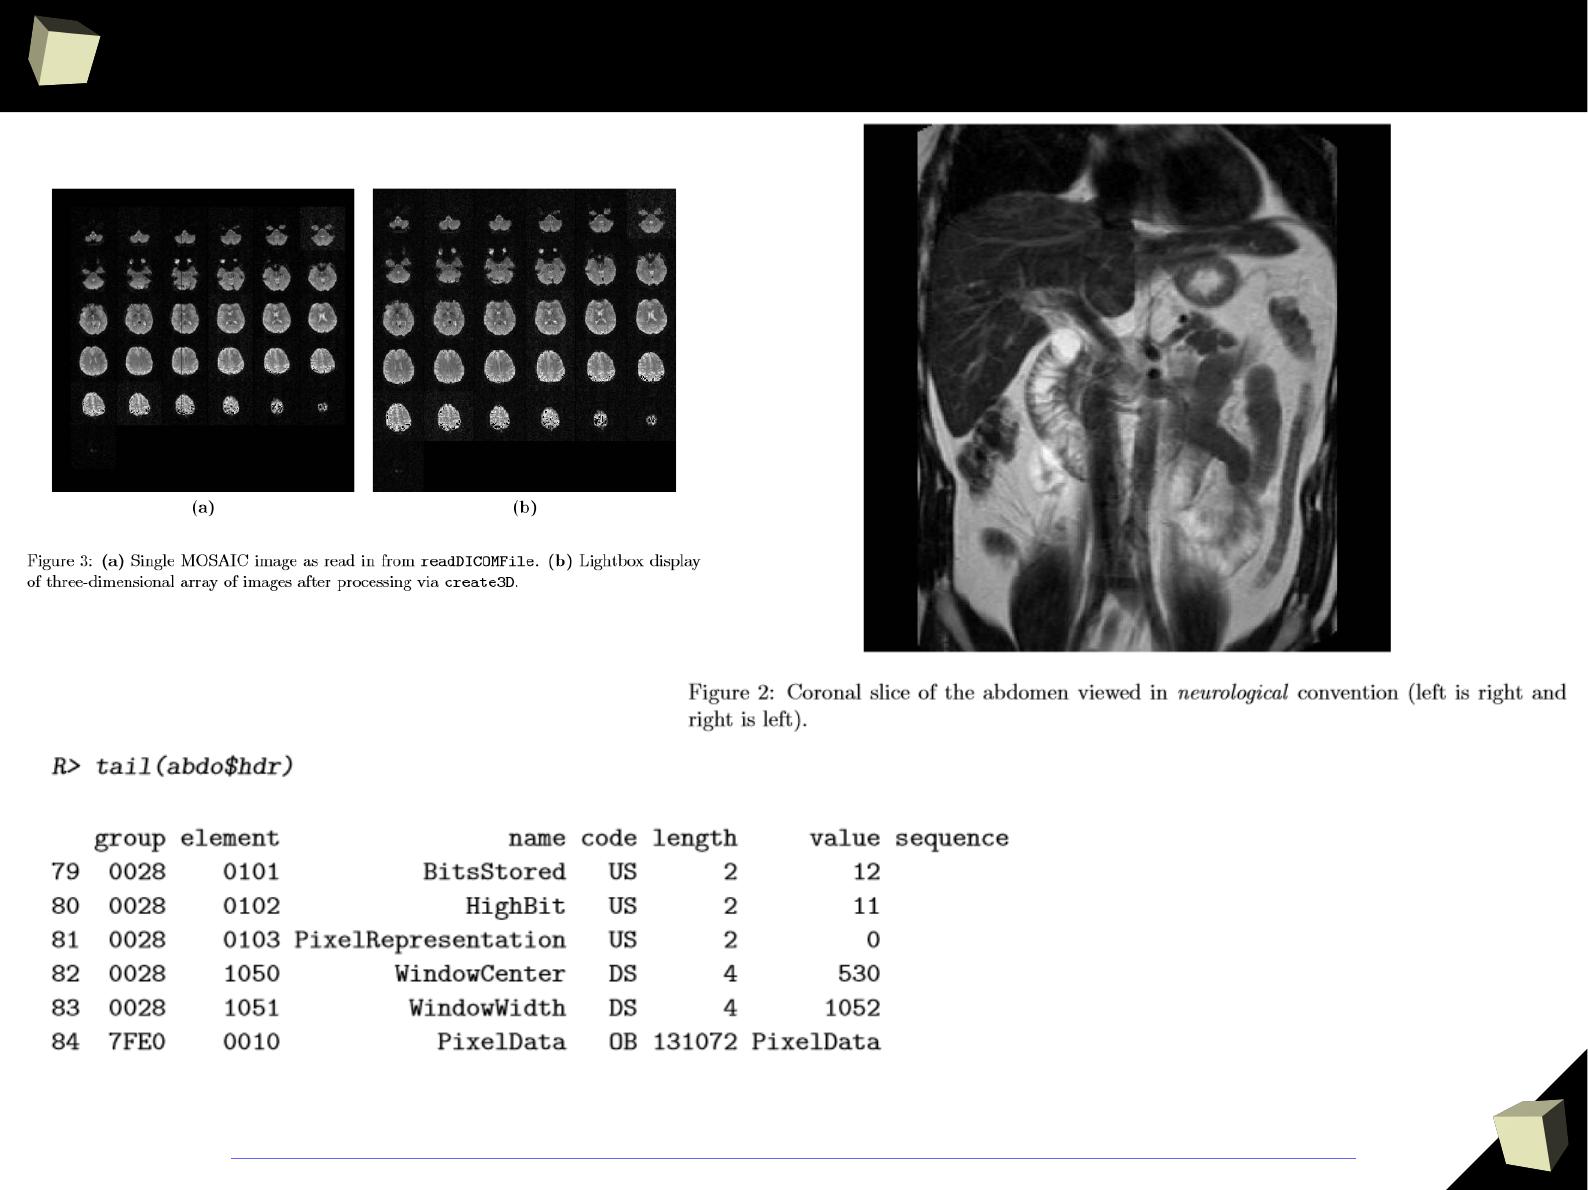
Process DICOM data with oro.dicom
8
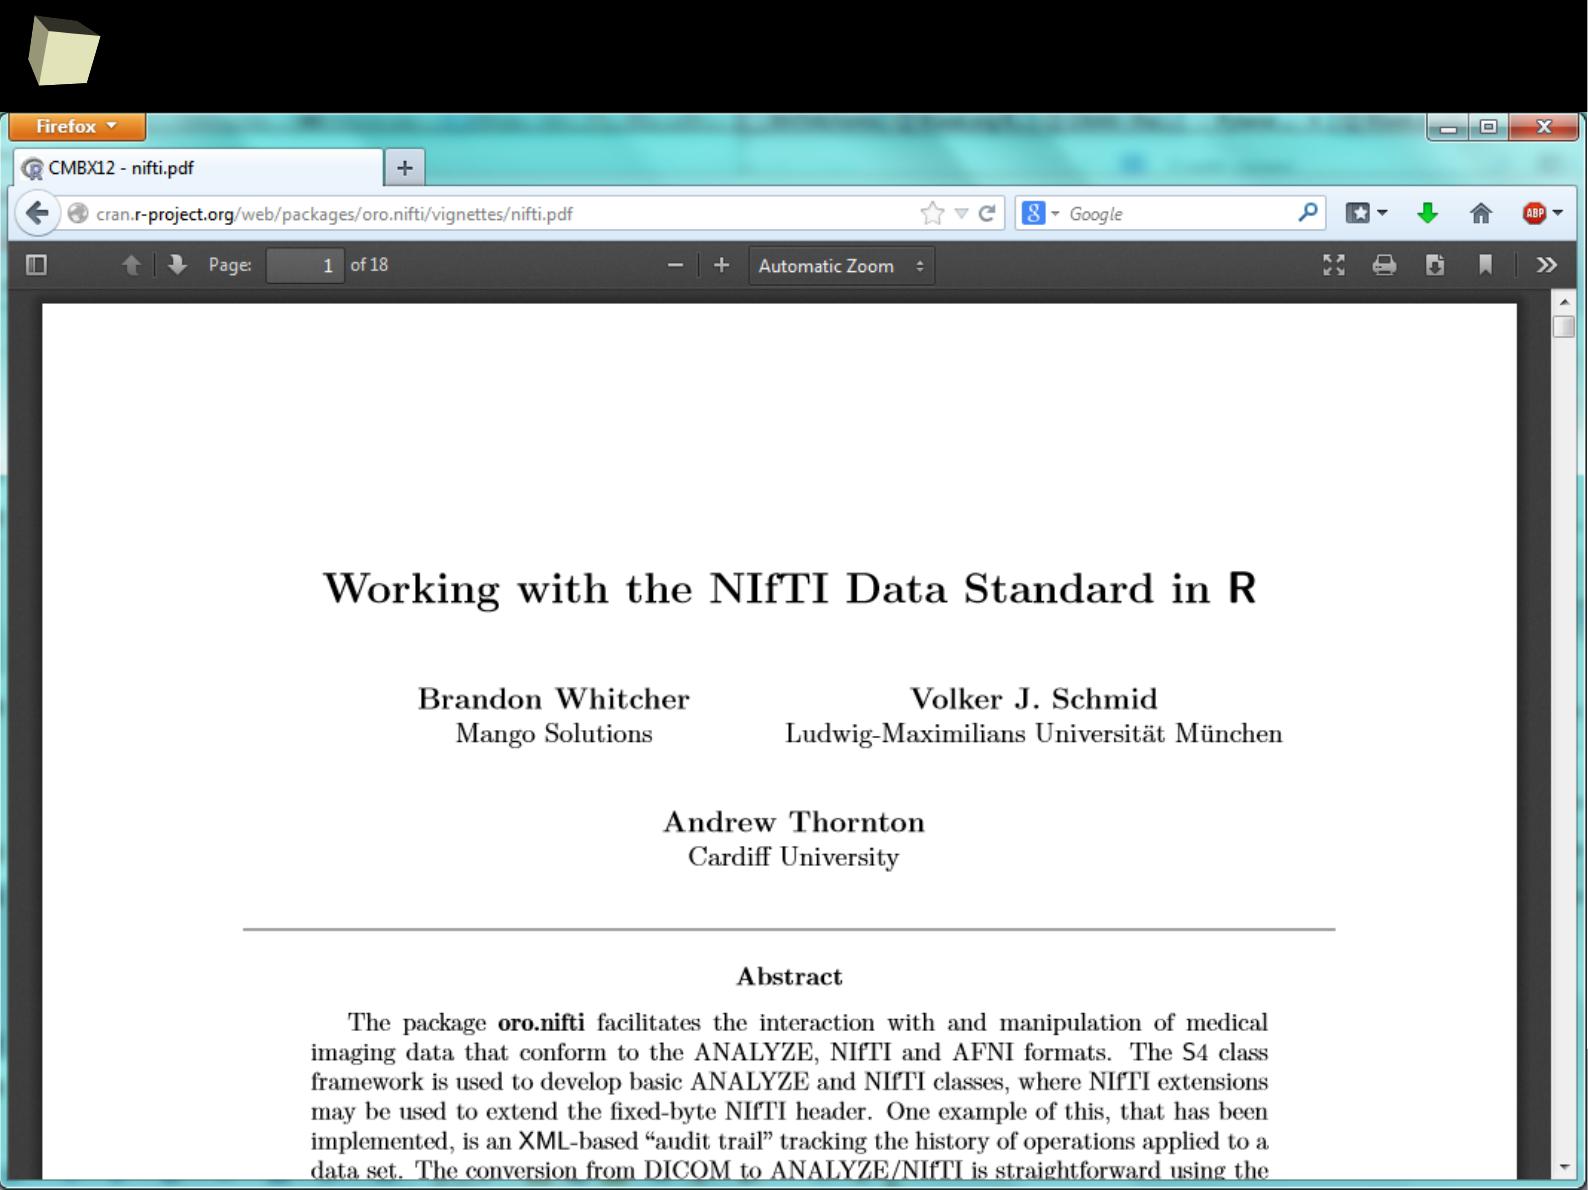
4
Process NIfTI data with oro.nifti
8
5
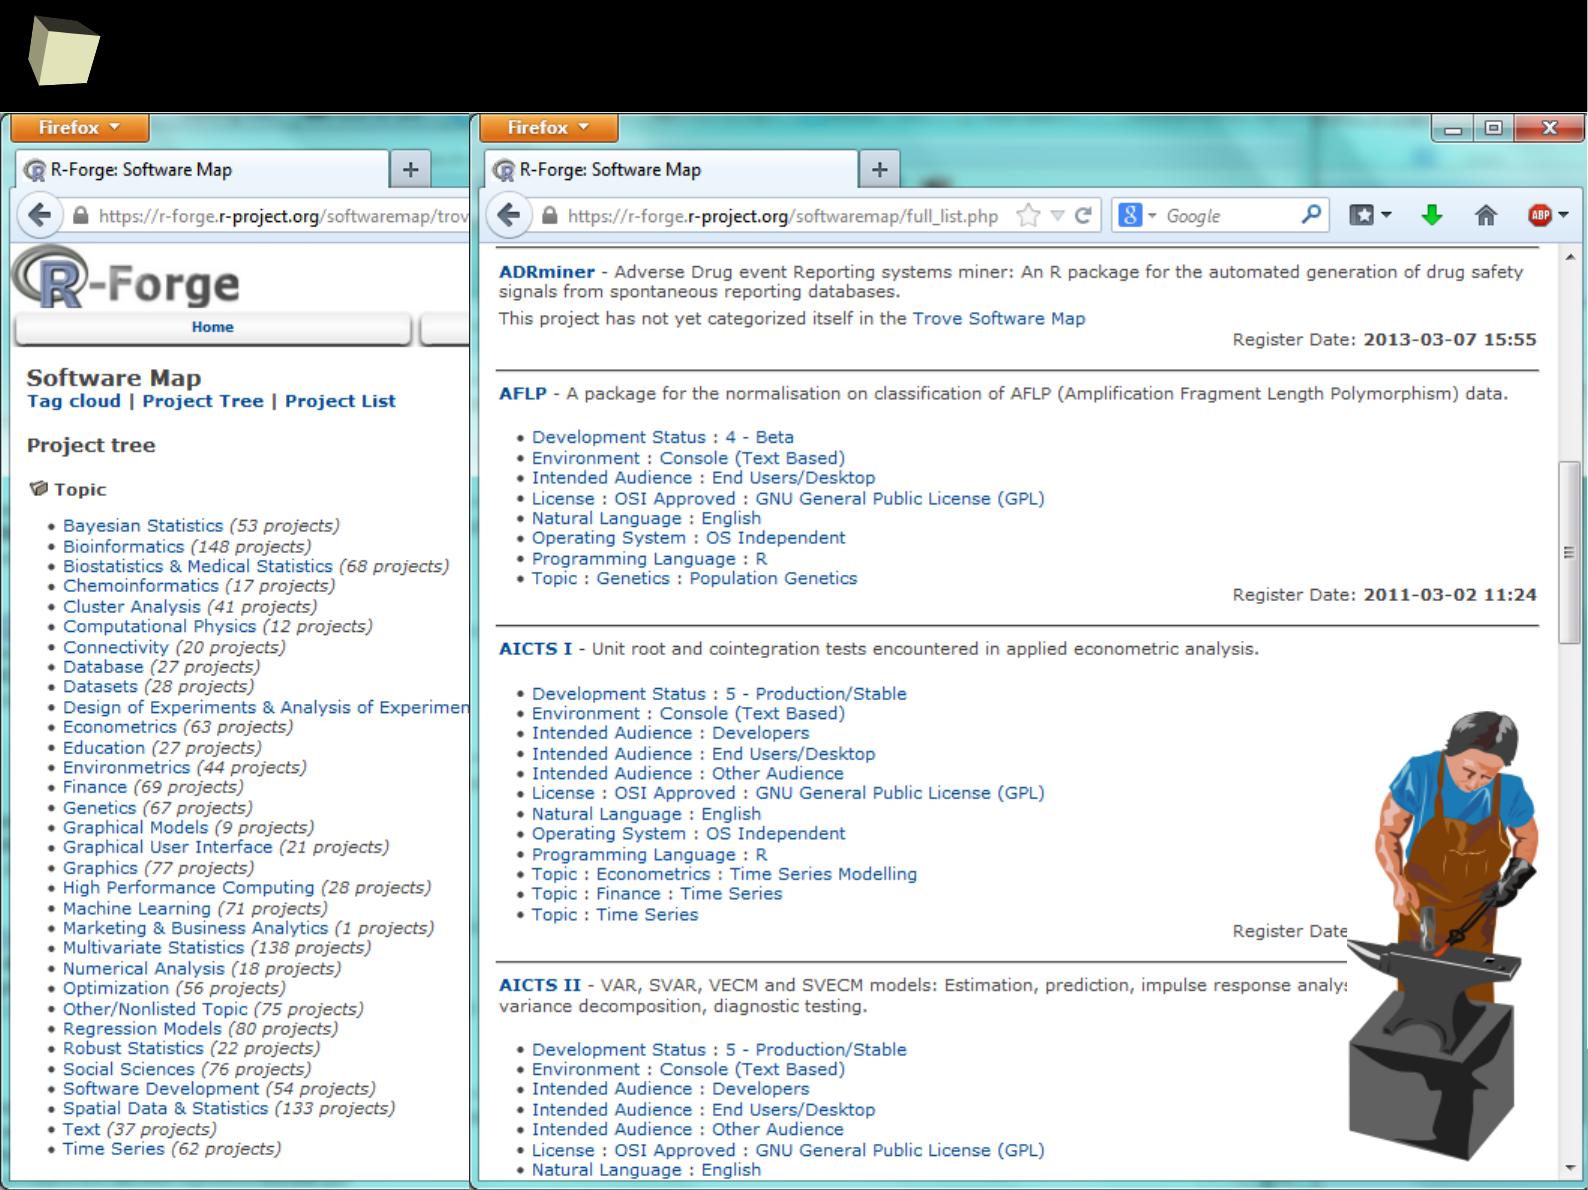
The Origin Of Things - RForge
8
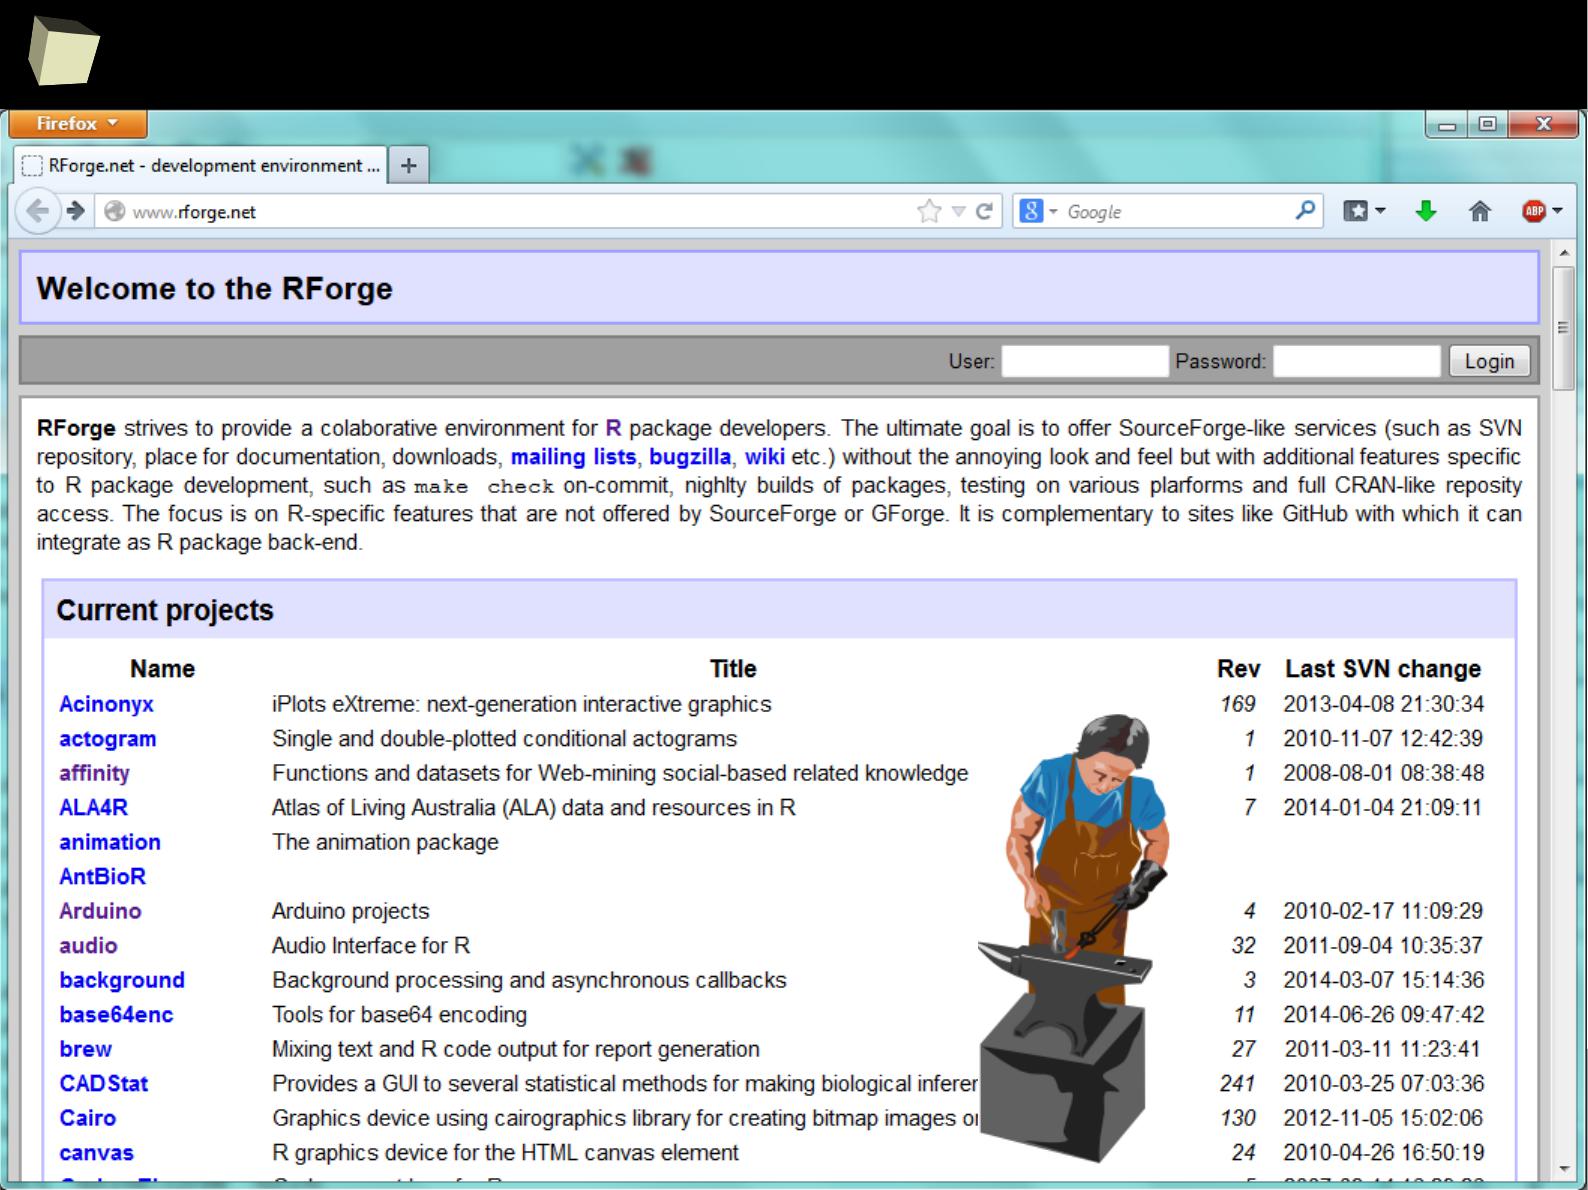
6
The Origin Of Things - RForge
8
7
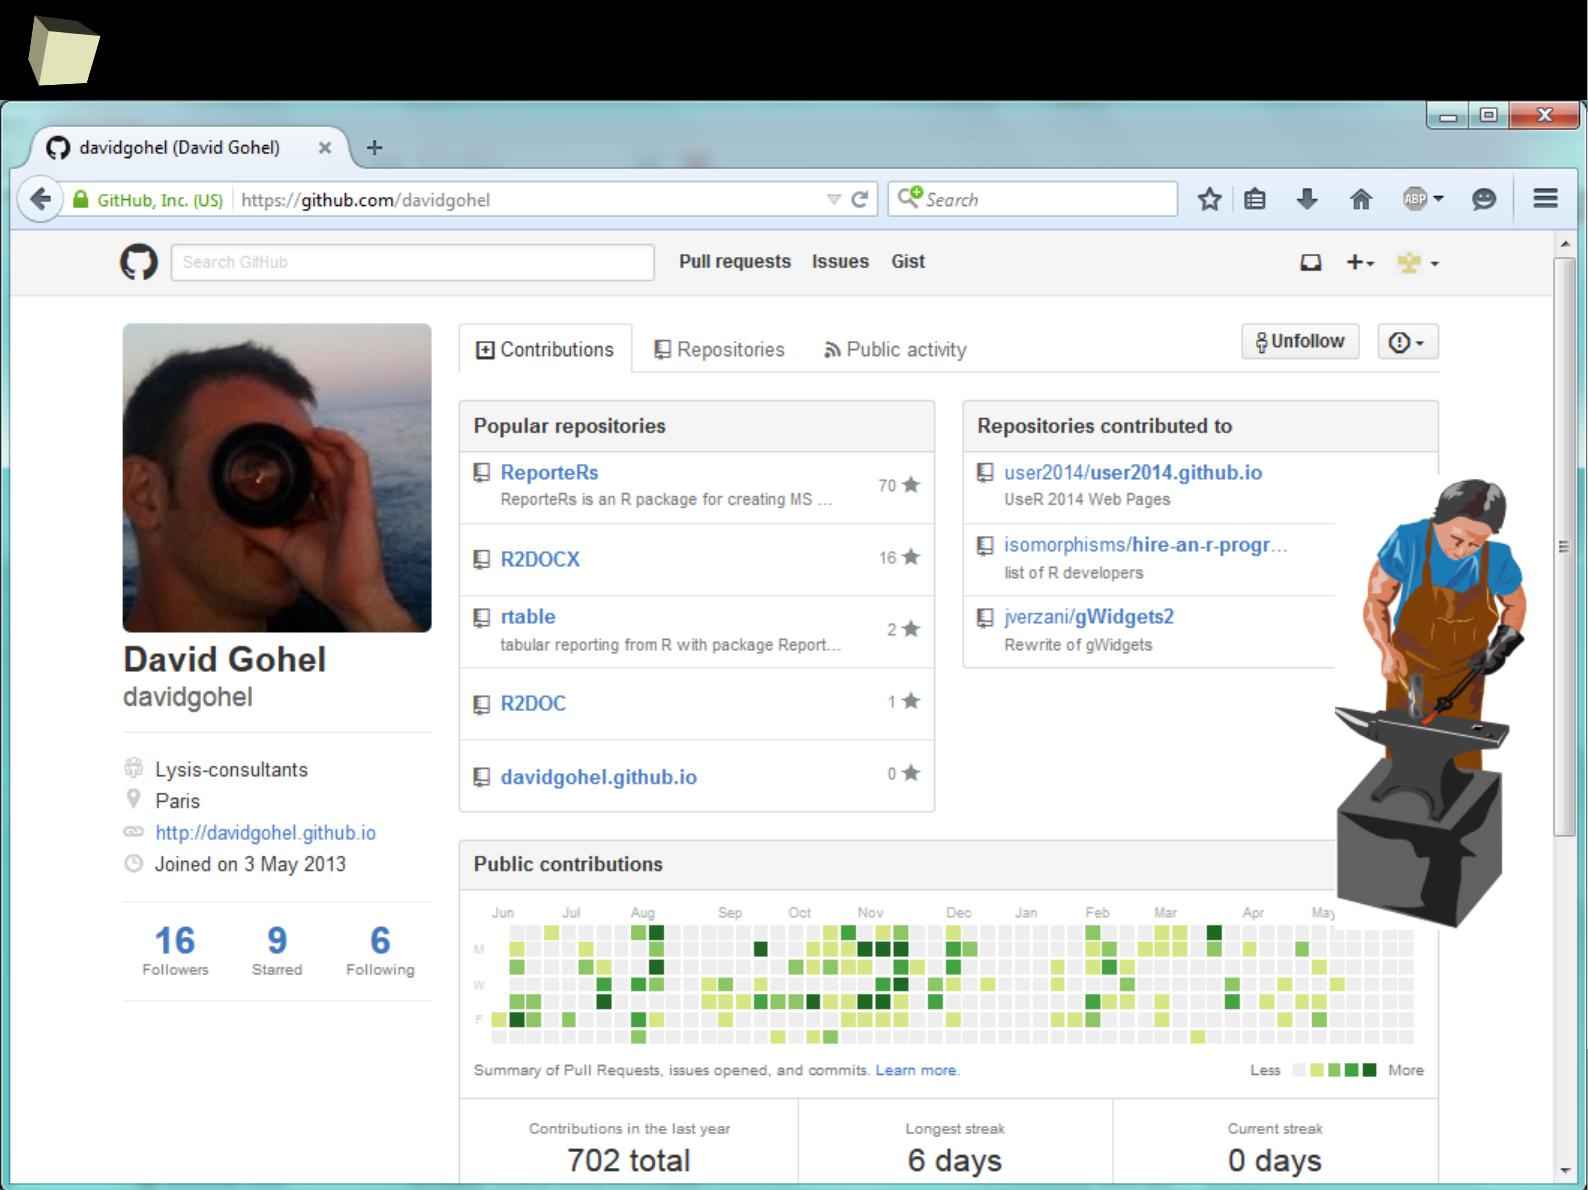
The Origin Of Things - GitHub

8
9
13 reasons why you will love GNU R
I R is (extremely) cheap. In fact - it's free :)
II R has (extremely) wide range of capabilities
II 1/3 :) R is easy to maintain!
IV R is supported by the community
V R is supported by the business
VI R is able to read data in many formats
VII Interoperability is easy to achieve
VIII R is truly cross-platform
IX R offers numerous ways of presenting data
X There are many options to optimize the code
XI R is able to handle large amount of data
XII R has a set of fancy tools and IDEs
XII FDA accepted using R for drug trials!

9
0
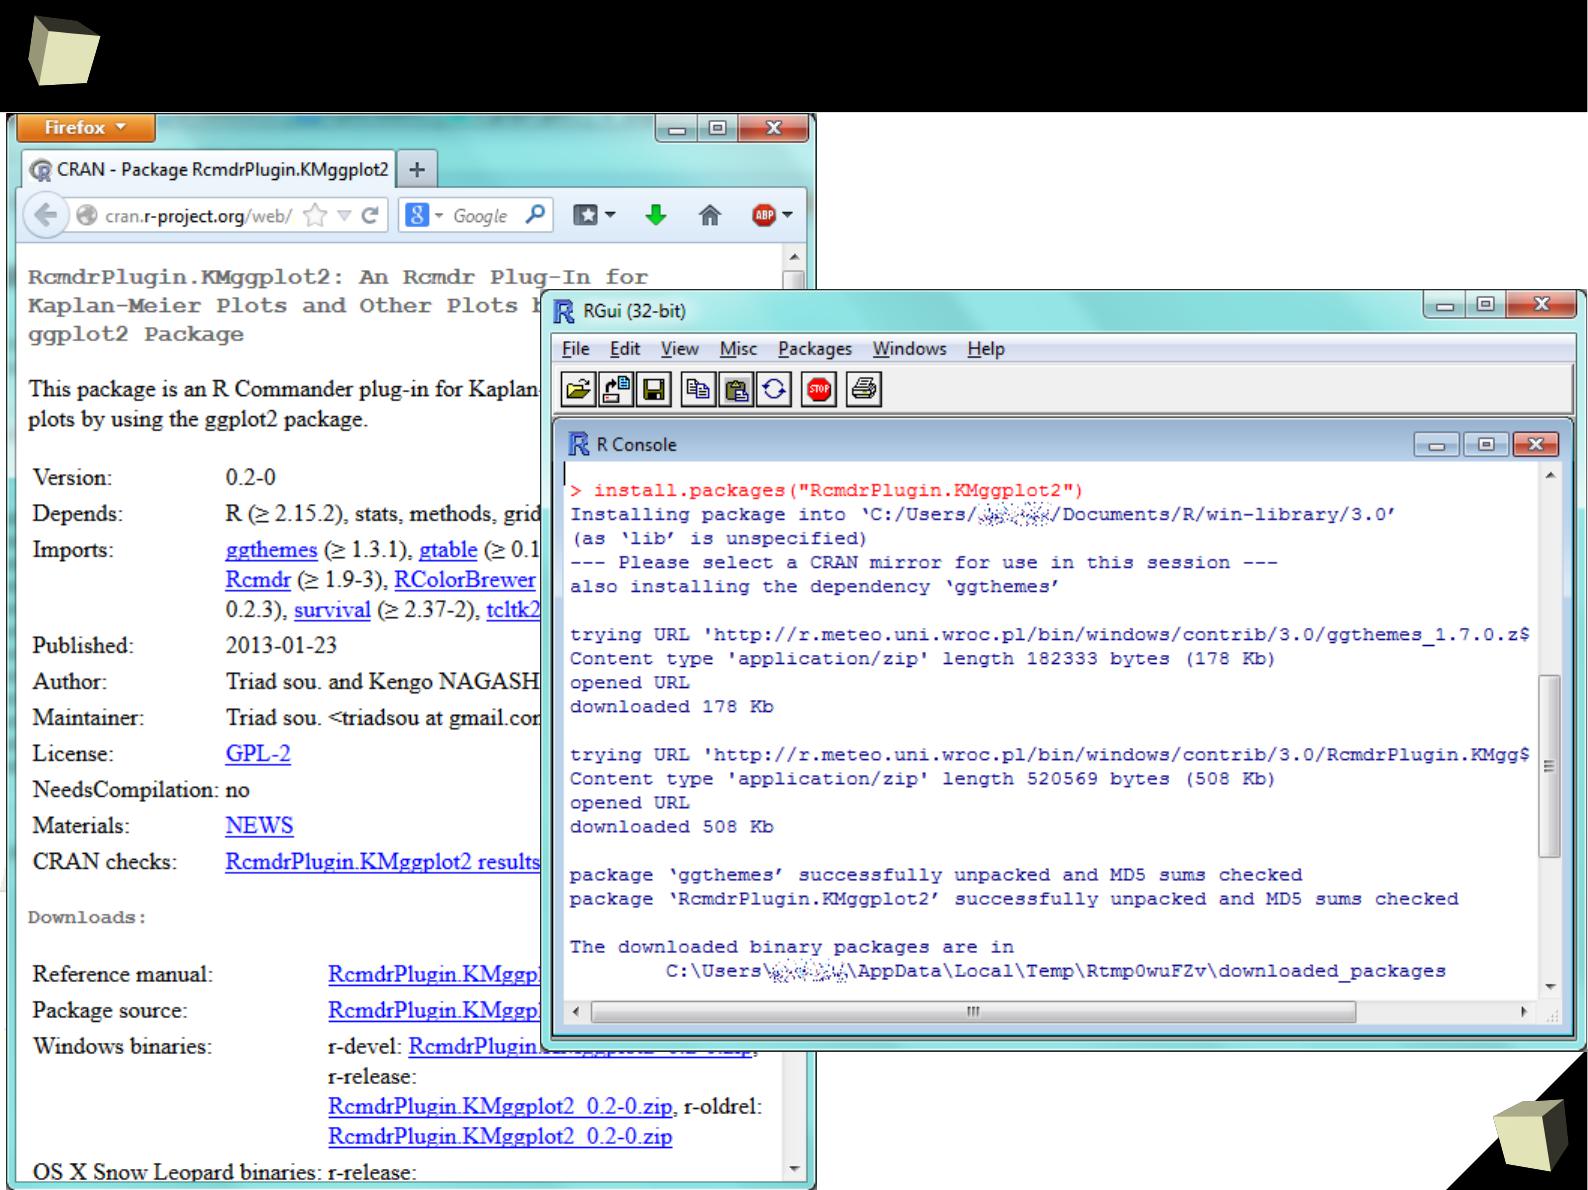
R is easy to maintain!
R is easy to maintain. Managing installed packages and keeping them up-to-
date becomes a piece of cake:
●
Packages are available in CRAN, GitHub, BioConductor and Omegahat
repositories. CRAN Repositories are mirrored in more than 50 countries.
●
Dependencies between packages are resolved automatically.
Just type install.packages(“package_name”) in the console and R will
download necessary packages, validate
MD5
and install them.
●
Packages in a binary form can be installed from local .zip archives
●
Packages can be also built from sources (common approach on Linux)
●
Stay up-to-date with update.packages(). This could not be easier.
●
By the use of installr package entire environment can be updated at once.
●
One can have multiple libraries of packages in order to organize them
9
1
R is easy to maintain!

9
2
CRAN D.I.Y.
With the miniCRAN package one can build his own, private mini repository of
R packages. This is a perfect solution for creating dedicated, in-house
production environments for the following reasons:
●
You may wish to mirror only a subset of CRAN, for security, legal
compliance or any other in-house reason
●
You may wish to restrict internal package use to a subset of public
packages, to minimize package duplication, or other reasons of coding
standards
●
You may wish to make packages available from public repositories other
than CRAN, e.g. BioConductor, r-forge, OmegaHat, etc.
●
You may wish to add custom in-house packages to your repository
www.r-bloggers.com/introducing-minicran-an-r-package-to-create-a-private-cran-repository/
Do not forget to visit the quick introduction to miniCRAN.
9
3
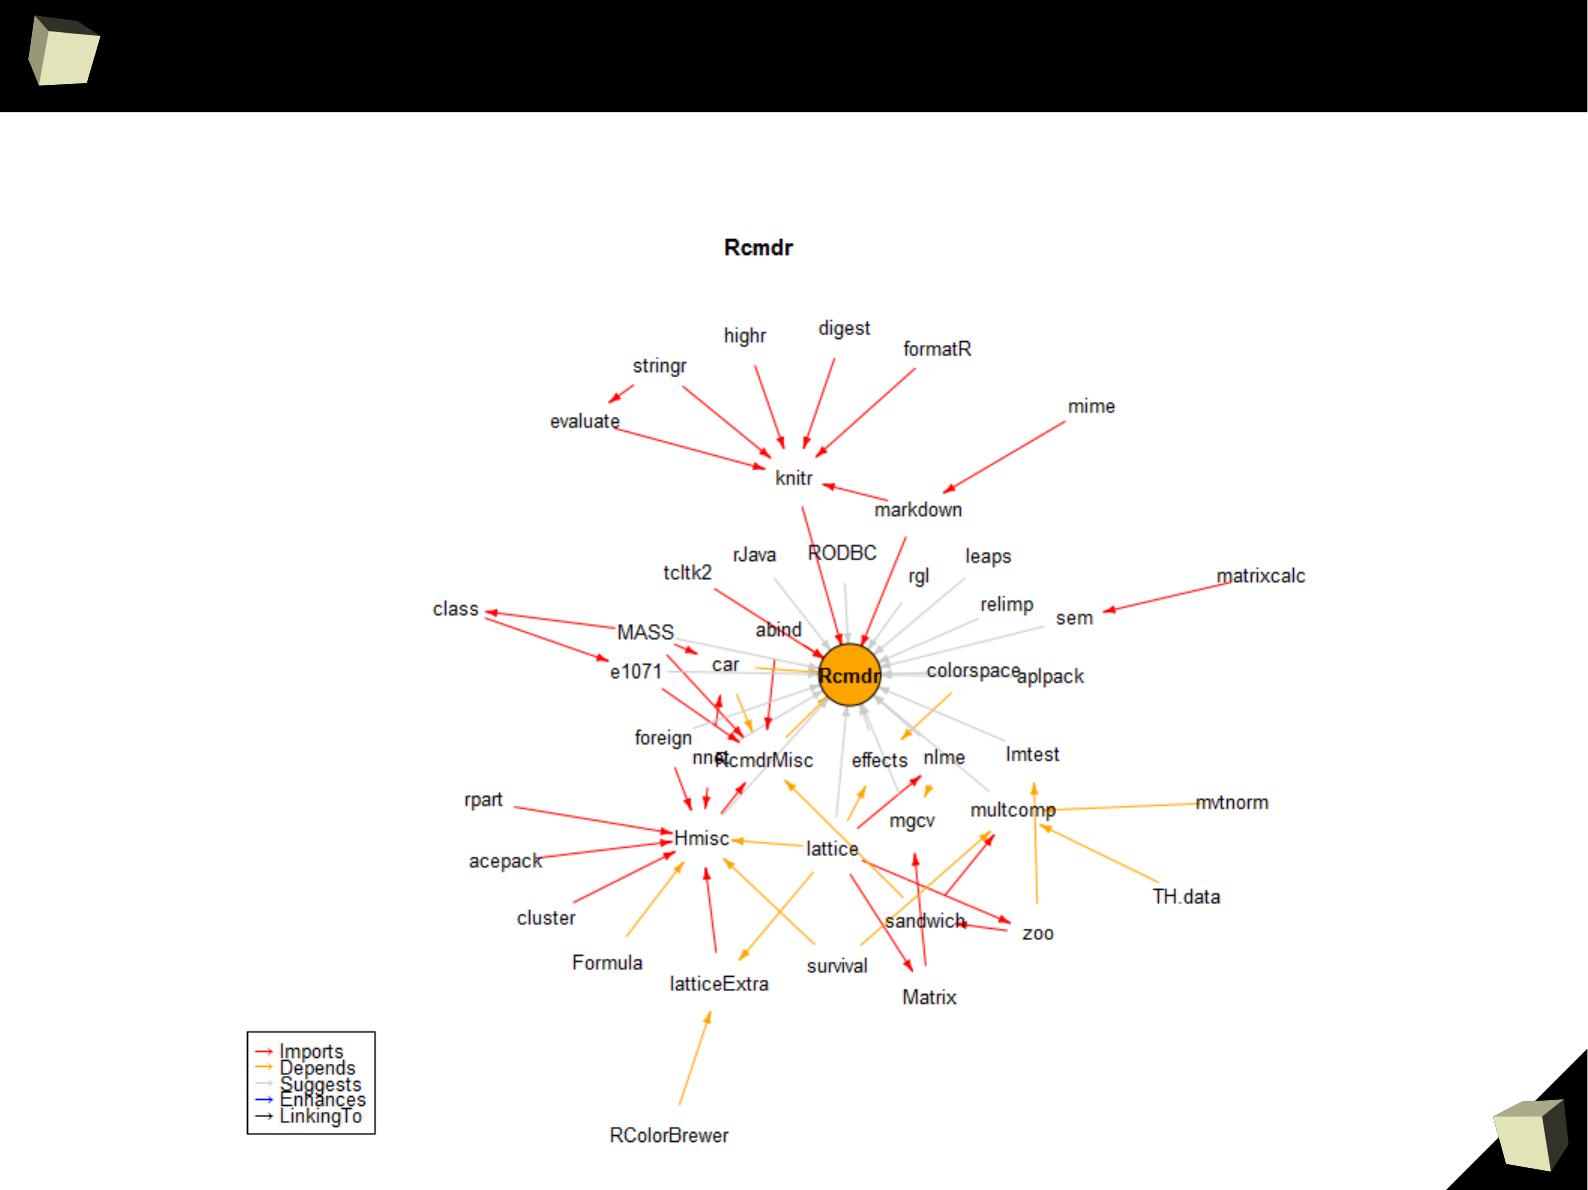
CRAN D.I.Y.
MiniCRAN also helps you to track dependencies between packages.
9
4
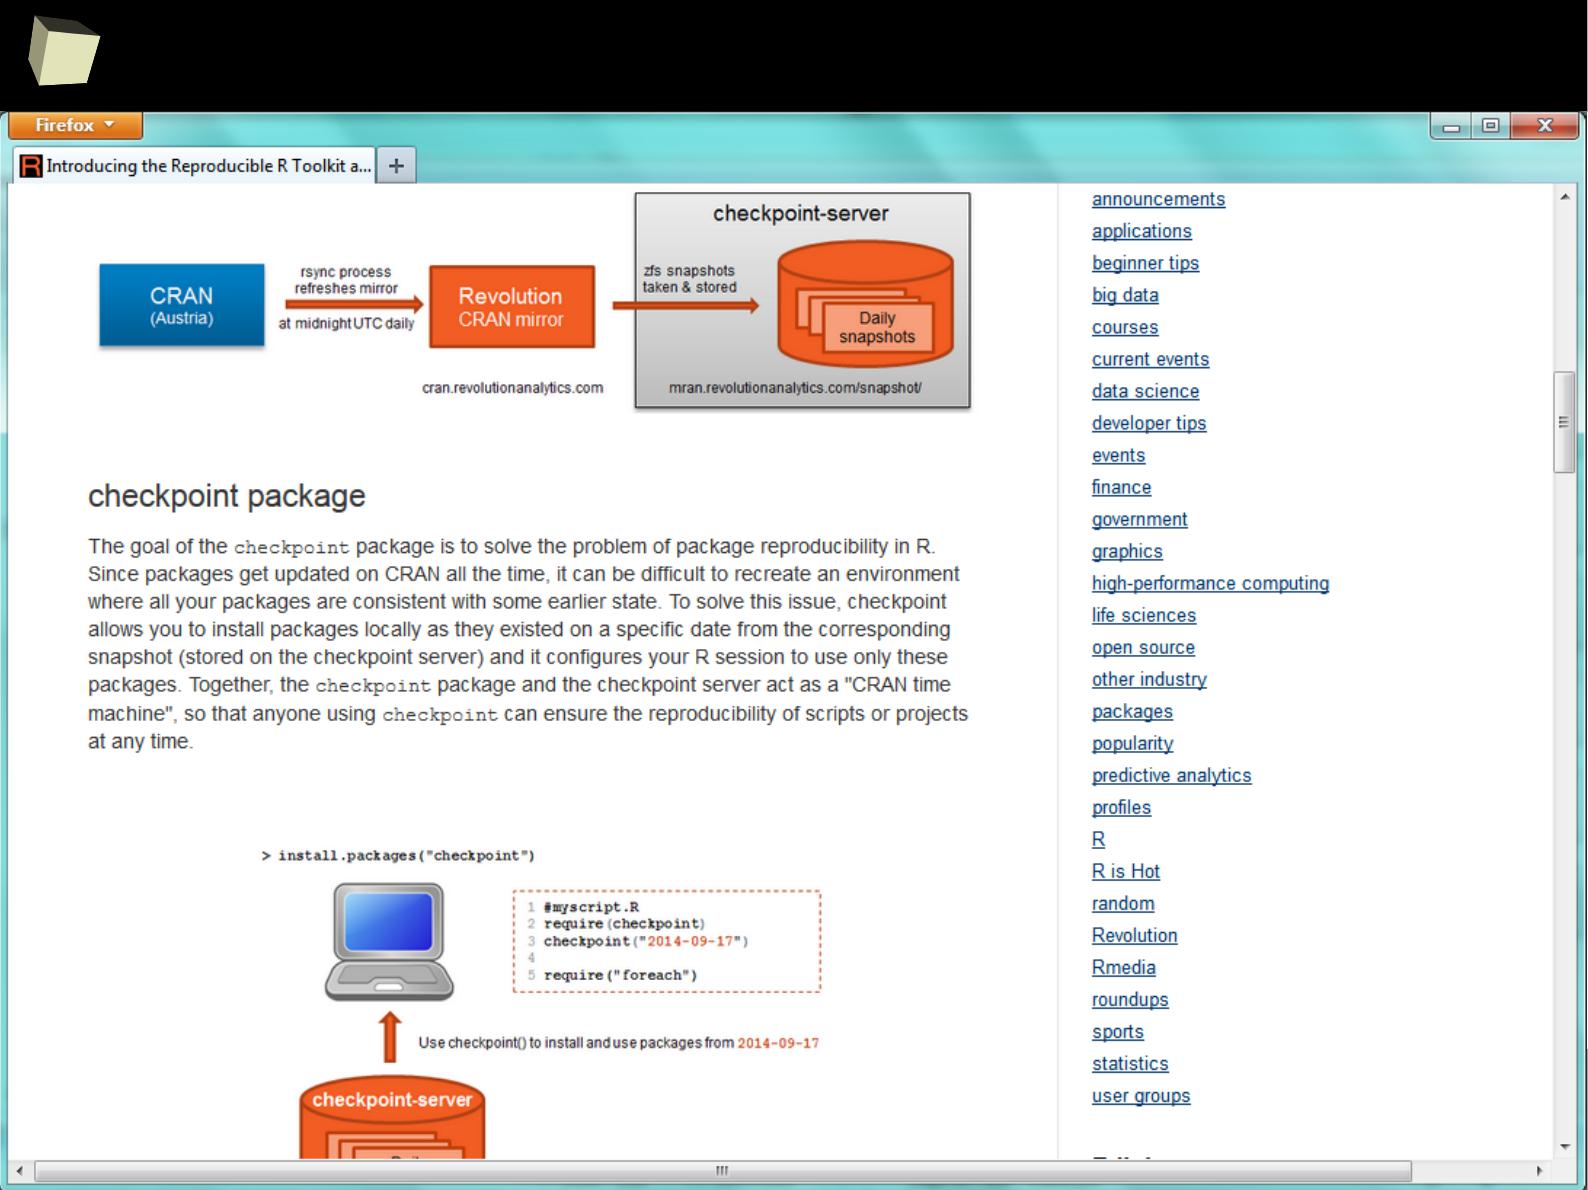
Versioned CRAN – meet Revolution::checkpoint

9
5
13 reasons why you will love GNU R
I R is (extremely) cheap. In fact - it's free :)
II R has (extremely) wide range of capabilities
II 2/3 :) R is not resource consuming!
IV R is supported by the community
V R is supported by the business
VI R is able to read data in many formats
VII Interoperability is easy to achieve
VIII R is truly cross-platform
IX R offers numerous ways of presenting data
X There are many options to optimize the code
XI R is able to handle large amount of data
XII R has a set of fancy tools and IDEs
XII FDA accepted using R for drug trials!
9
6
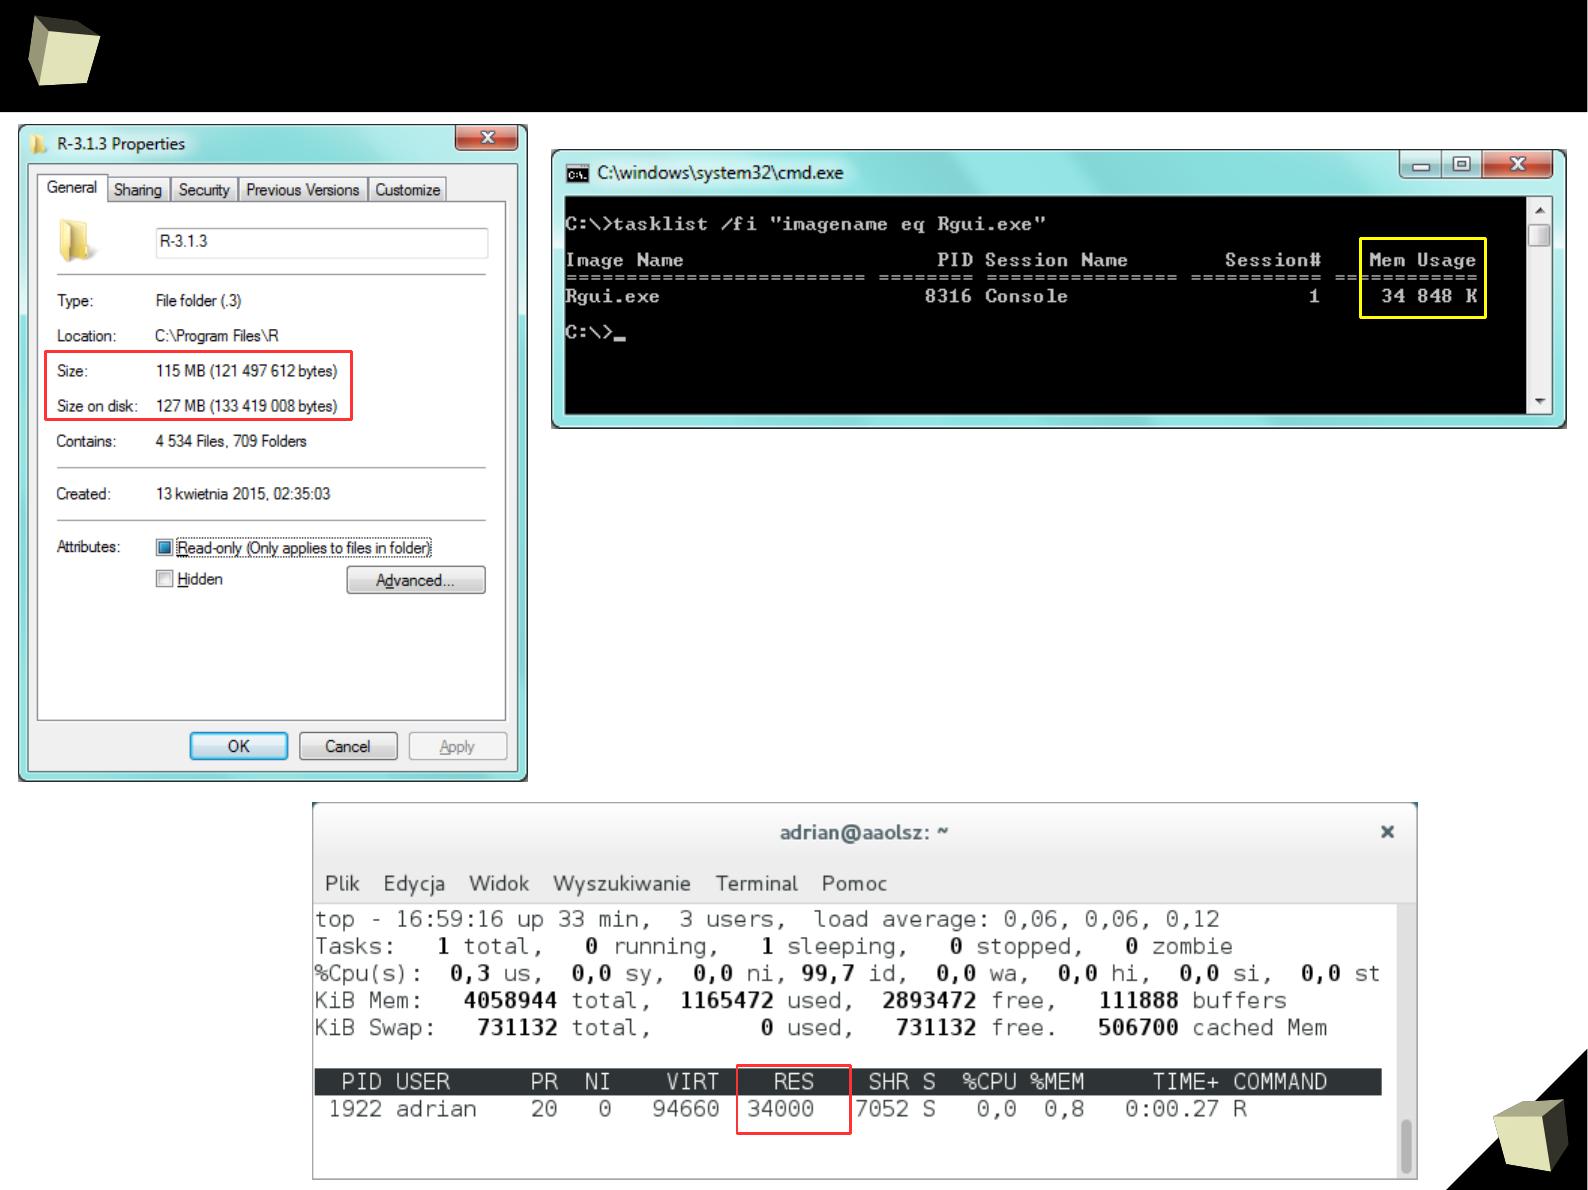
R is not resouRce consuming!
Fresh installation:
●
Disk space: ~ 130MiB
●
RAM: ~ 35MiB
9
7
R is not resouRce consuming!

9
8
13 reasons why you will love GNU R
I R is (extremely) cheap. In fact - it's free :)
II R has (extremely) wide range of capabilities
III R is supported by the world of science
IV R is supported by the community
V R is supported by the business
VI R is able to read data in many formats
VII Interoperability is easy to achieve
VIII R is truly cross-platform
IX R offers numerous ways of presenting data
X There are many options to optimize the code
XI R is able to handle large amount of data
XII R has a set of fancy tools and IDEs
XII FDA accepted using R for drug trials!

9
9
...supported by the science
At the center of the R Community is the R Core Group of approximately 20
developers who maintain R and guide its evolution. They are experienced
statisticians, well-known in the world of science, with significant achievements.
Each thematic section has its own academic supervisor.
Robert Gentleman's articles about R and Bioconductor are among the most cited
in bioinformatics: over 5200 citations according to Google Scholar
April 2014
There are numerous e-learning materials on the Internet which provide valuable
assistance in data analysis with R. These are often provided by prestigious
academic centers like Pricenton, Stanford or Hopkins.
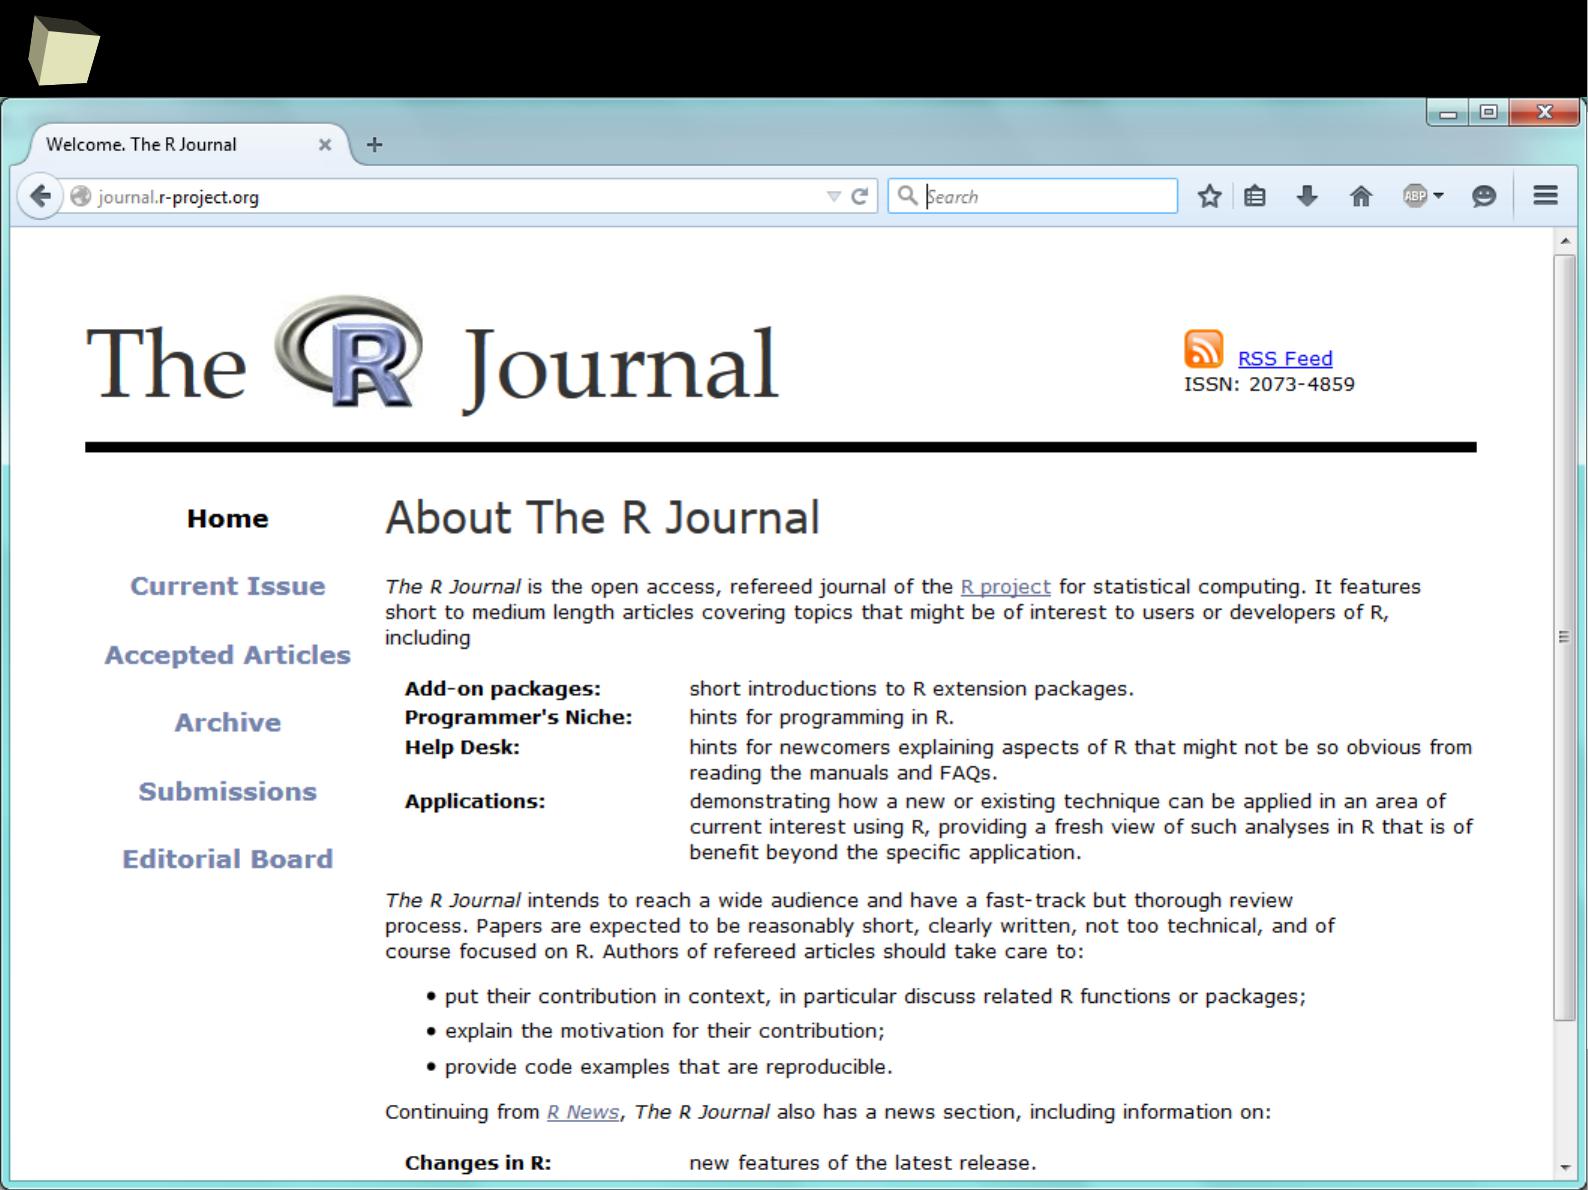
The R project is closely linked with “the R Journal” which is a mine of scientific
knowledge of using R for professional data analysis.
1
0
0
...supported by the science
1
0
1
where to leaRn?
1. http://cran.r-project.org/manuals.html
2. http://cran.r-project.org/other-docs.html
3. http://cran.r-project.org/doc/manuals/r-patched/R-intro.html
4. http://stats.stackexchange.com/questions/138/resources-for-learning-r
5. http://www.youtube.com/results?search_query=R+learn+statistics
6. http://www.statmethods.net - Quick R
7. http://adv-r.had.co.nz - Advanced R by Hadley Wickham
8. http://www.cookbook-r.com
9. http://rseek.org/?q=learn+R
10. http://www.google.pl/search?q=learn+R
There are hundreds of places containing e-learning materials devoted to R.
Good places to start learning R:
1
0
2
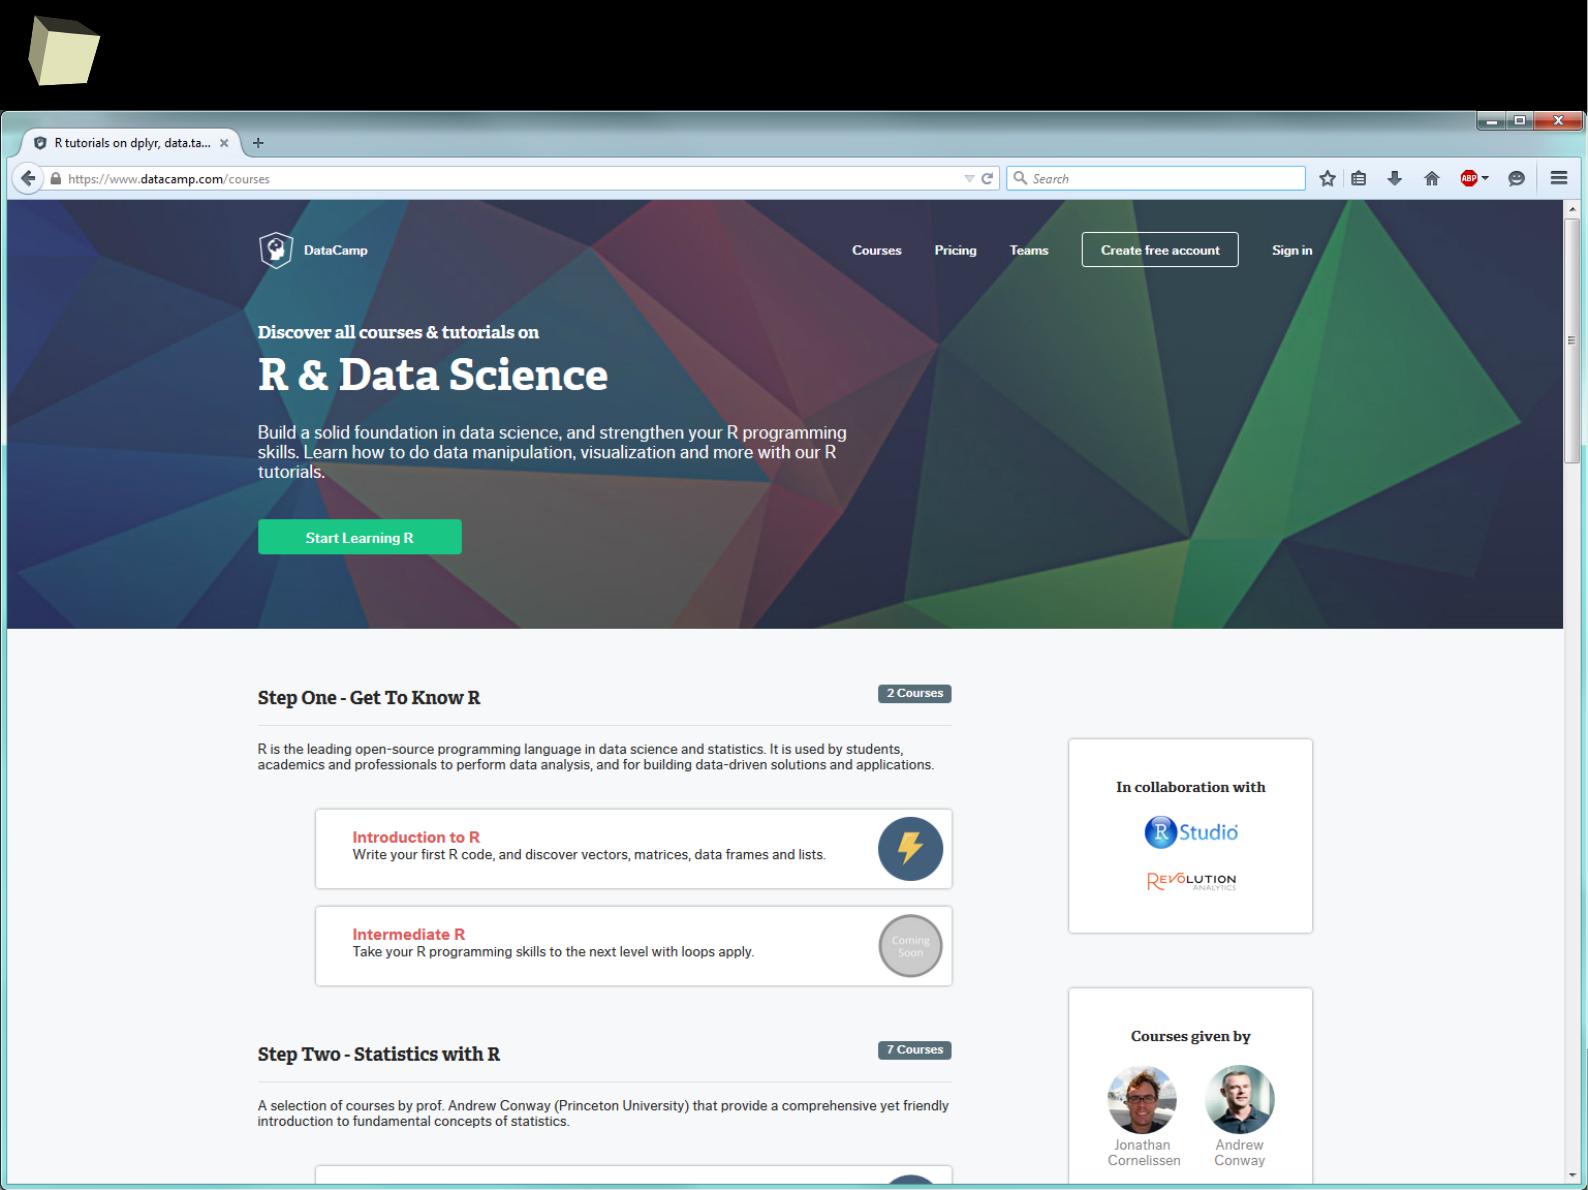
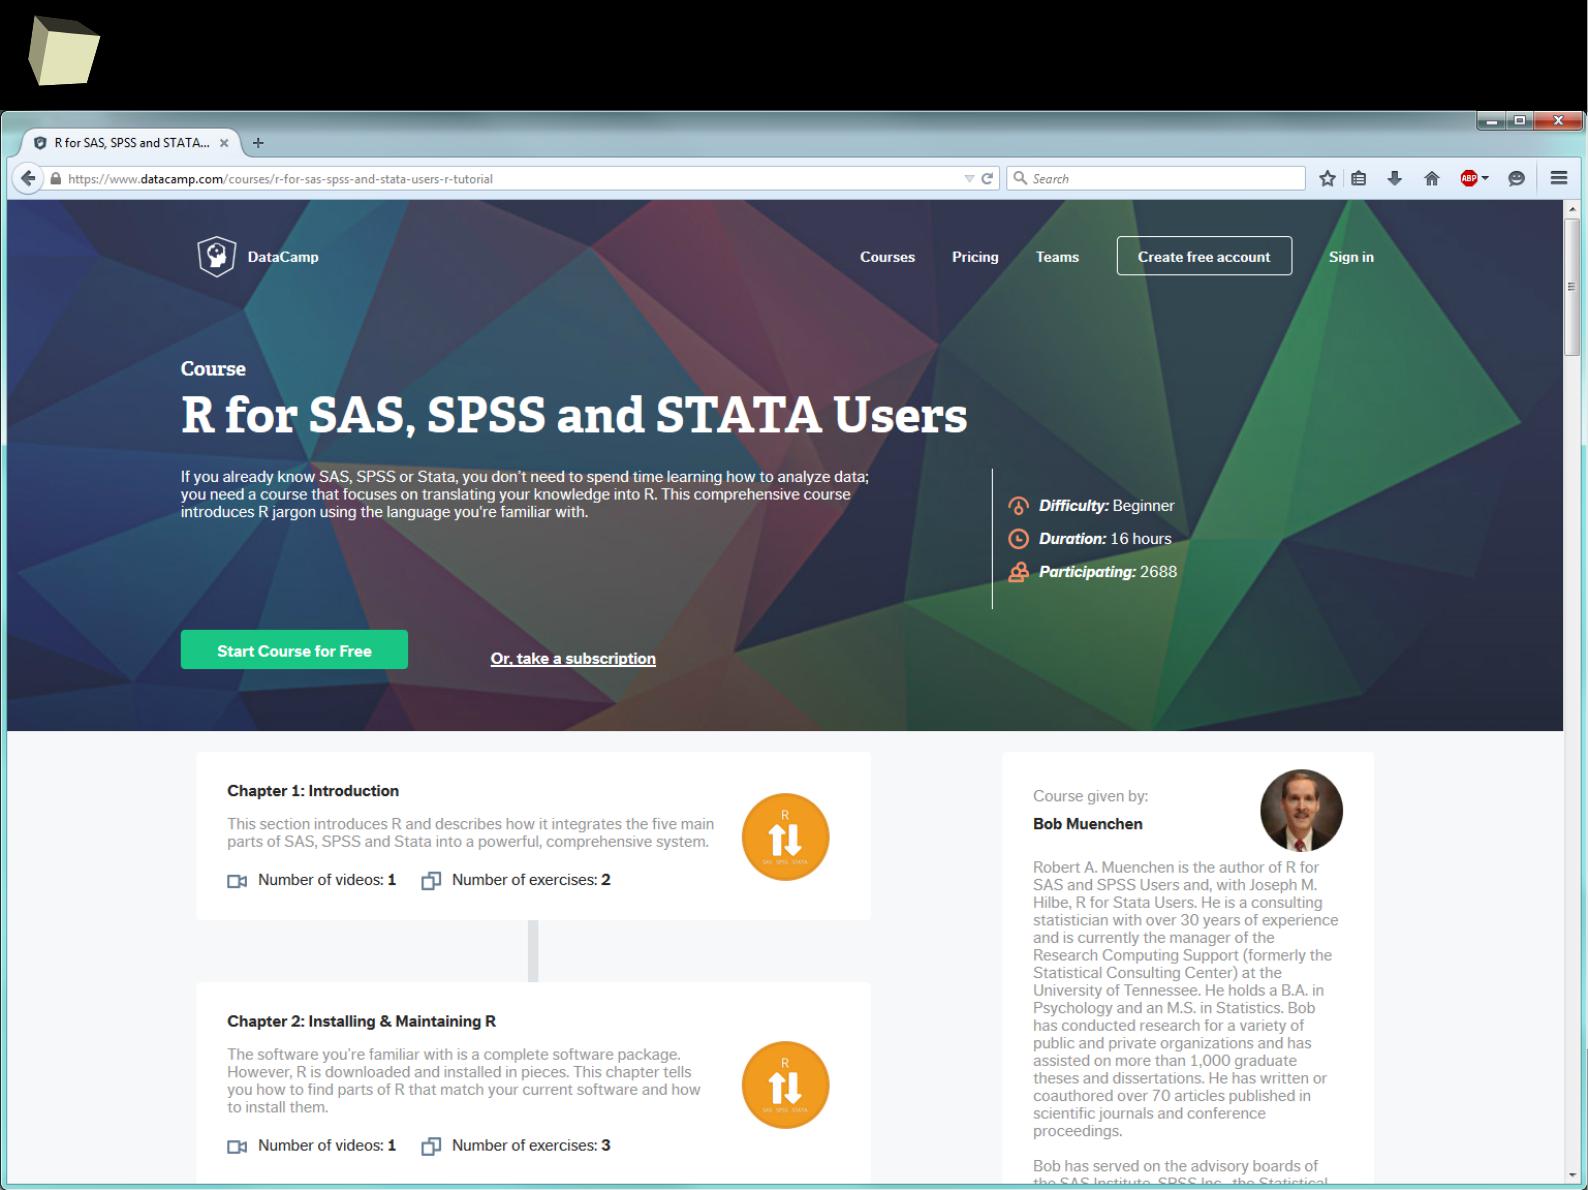
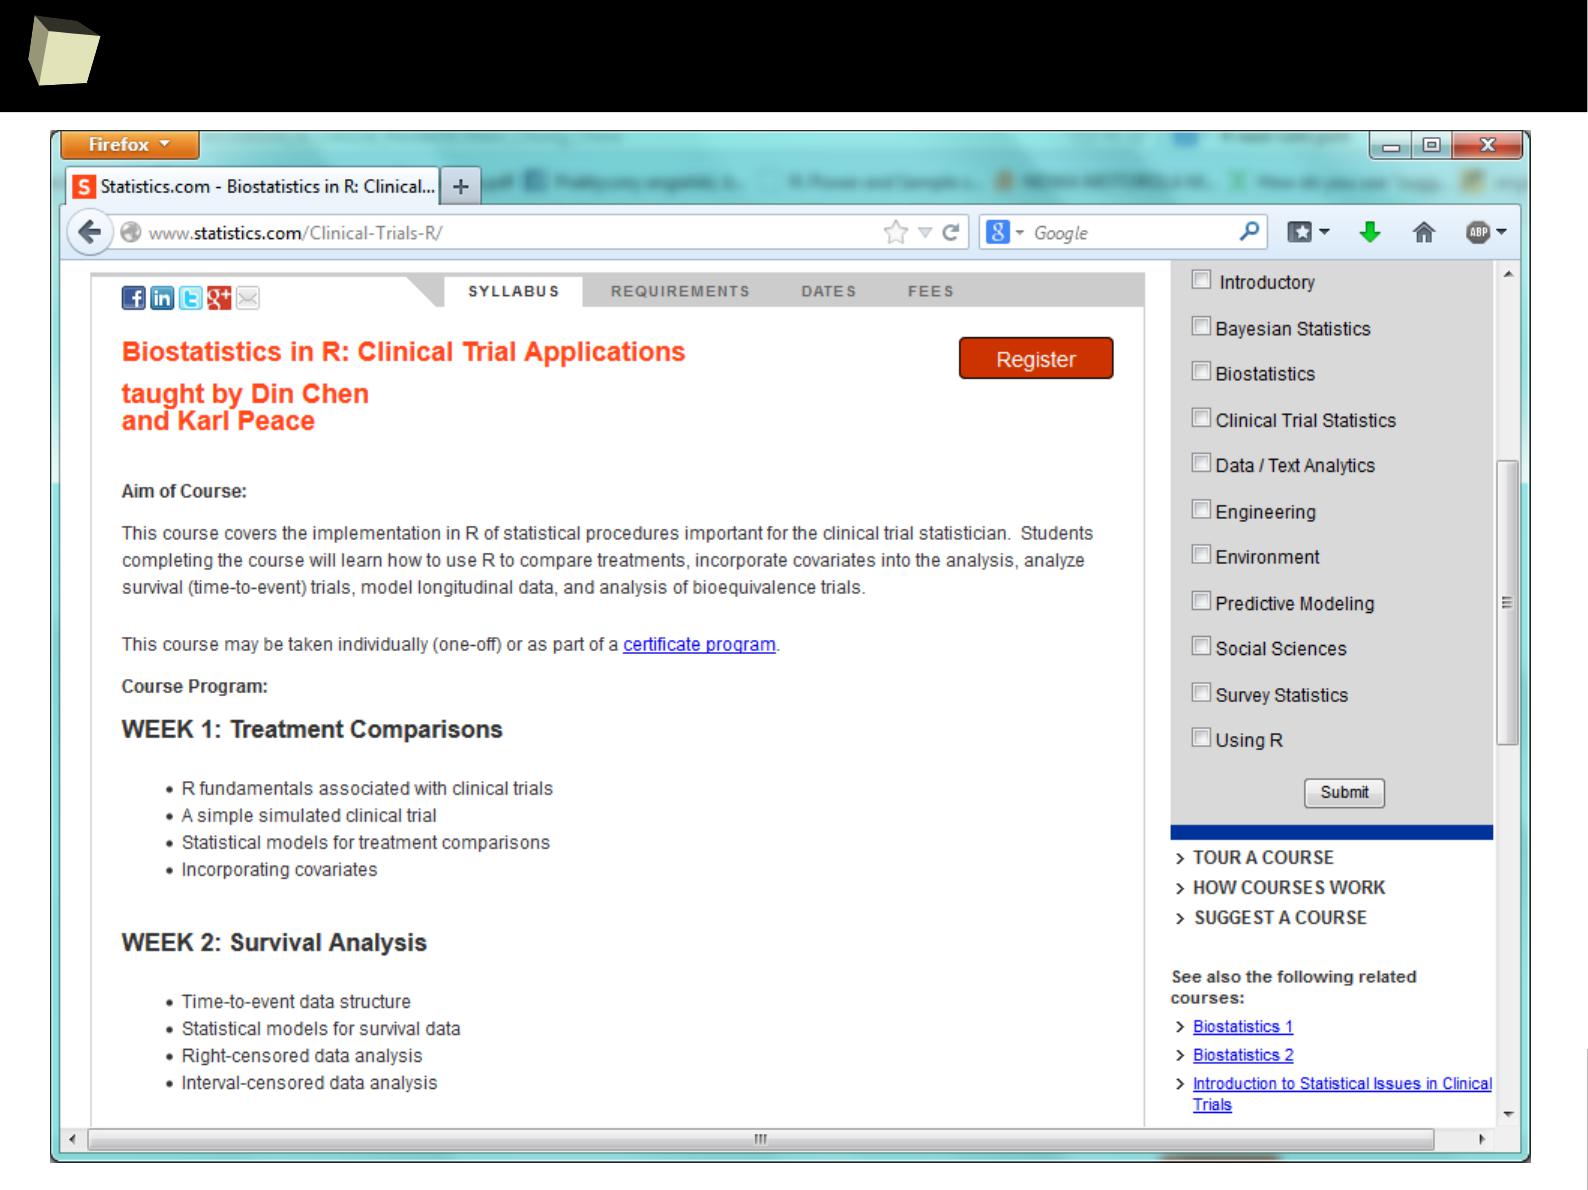
Take a couRse!
1
0
3
Take a couRse!
1
0
4
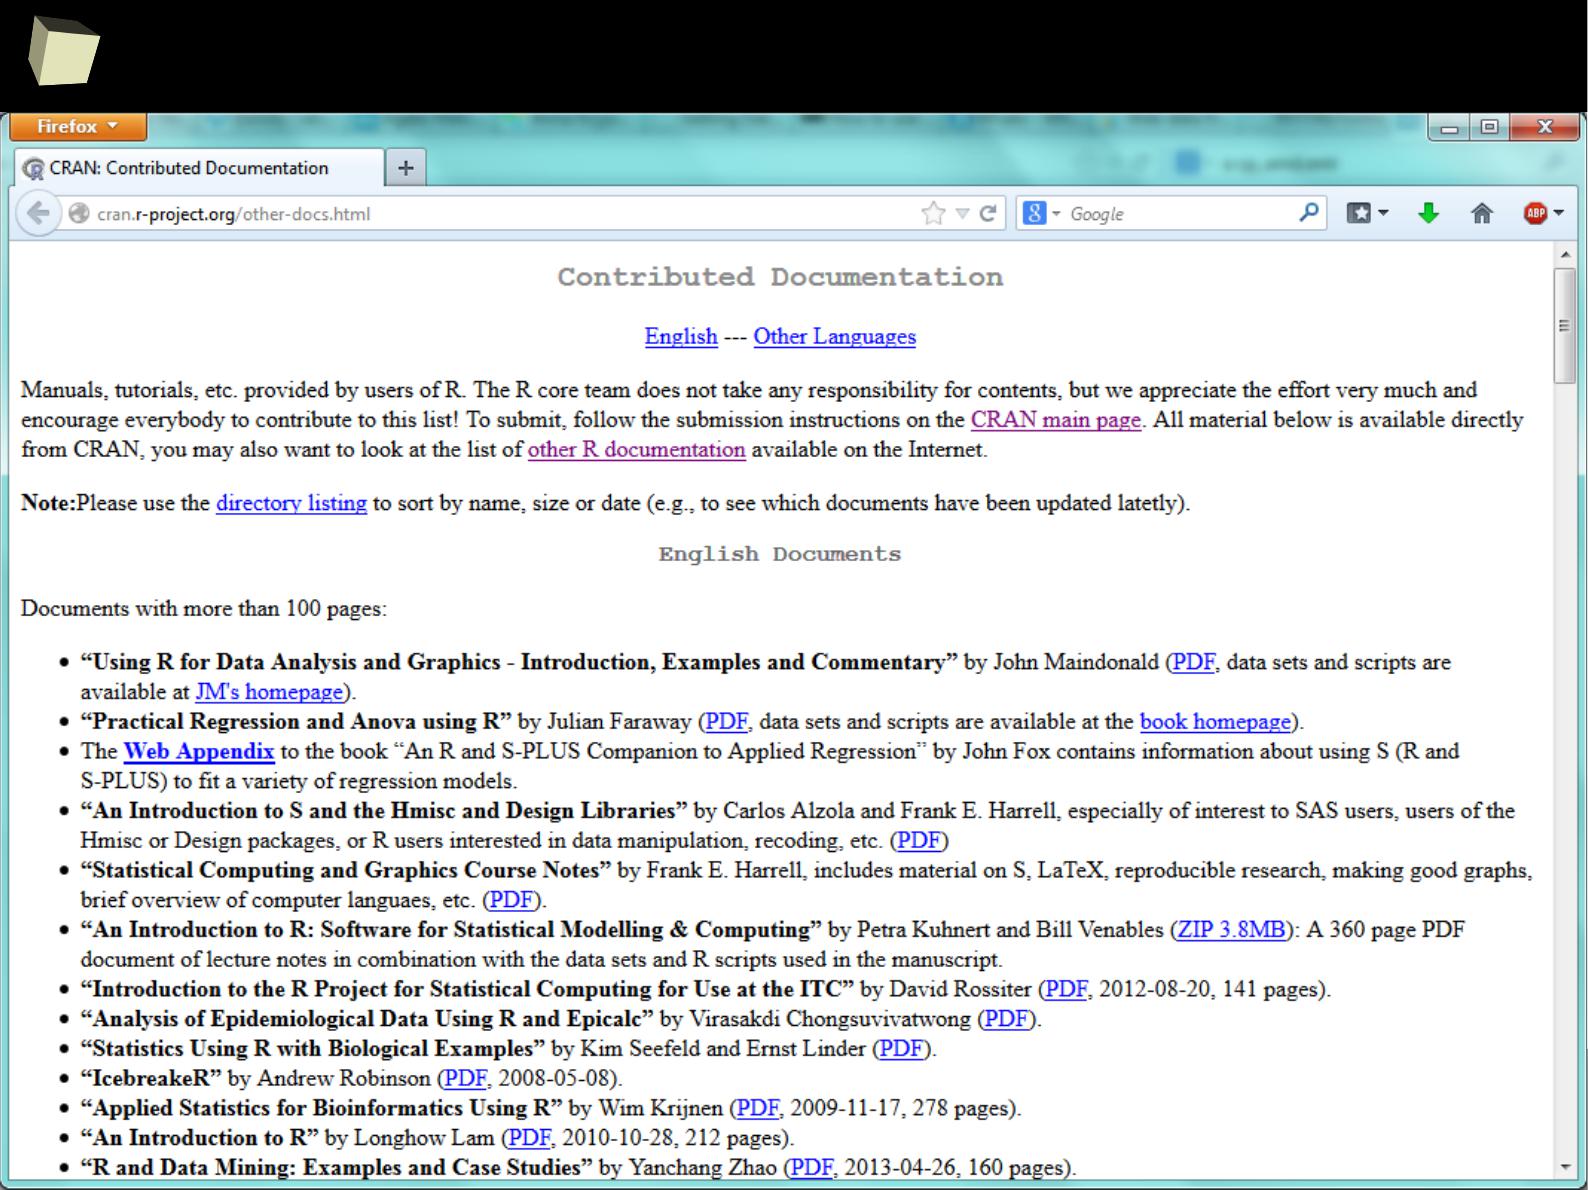
Look! This library contains pRiceless resources!
1
0
5
...thousands of valuable papeRs at our fingertips
1
0
6
...thousands of valuable papeRs at our fingertips
1
0
7
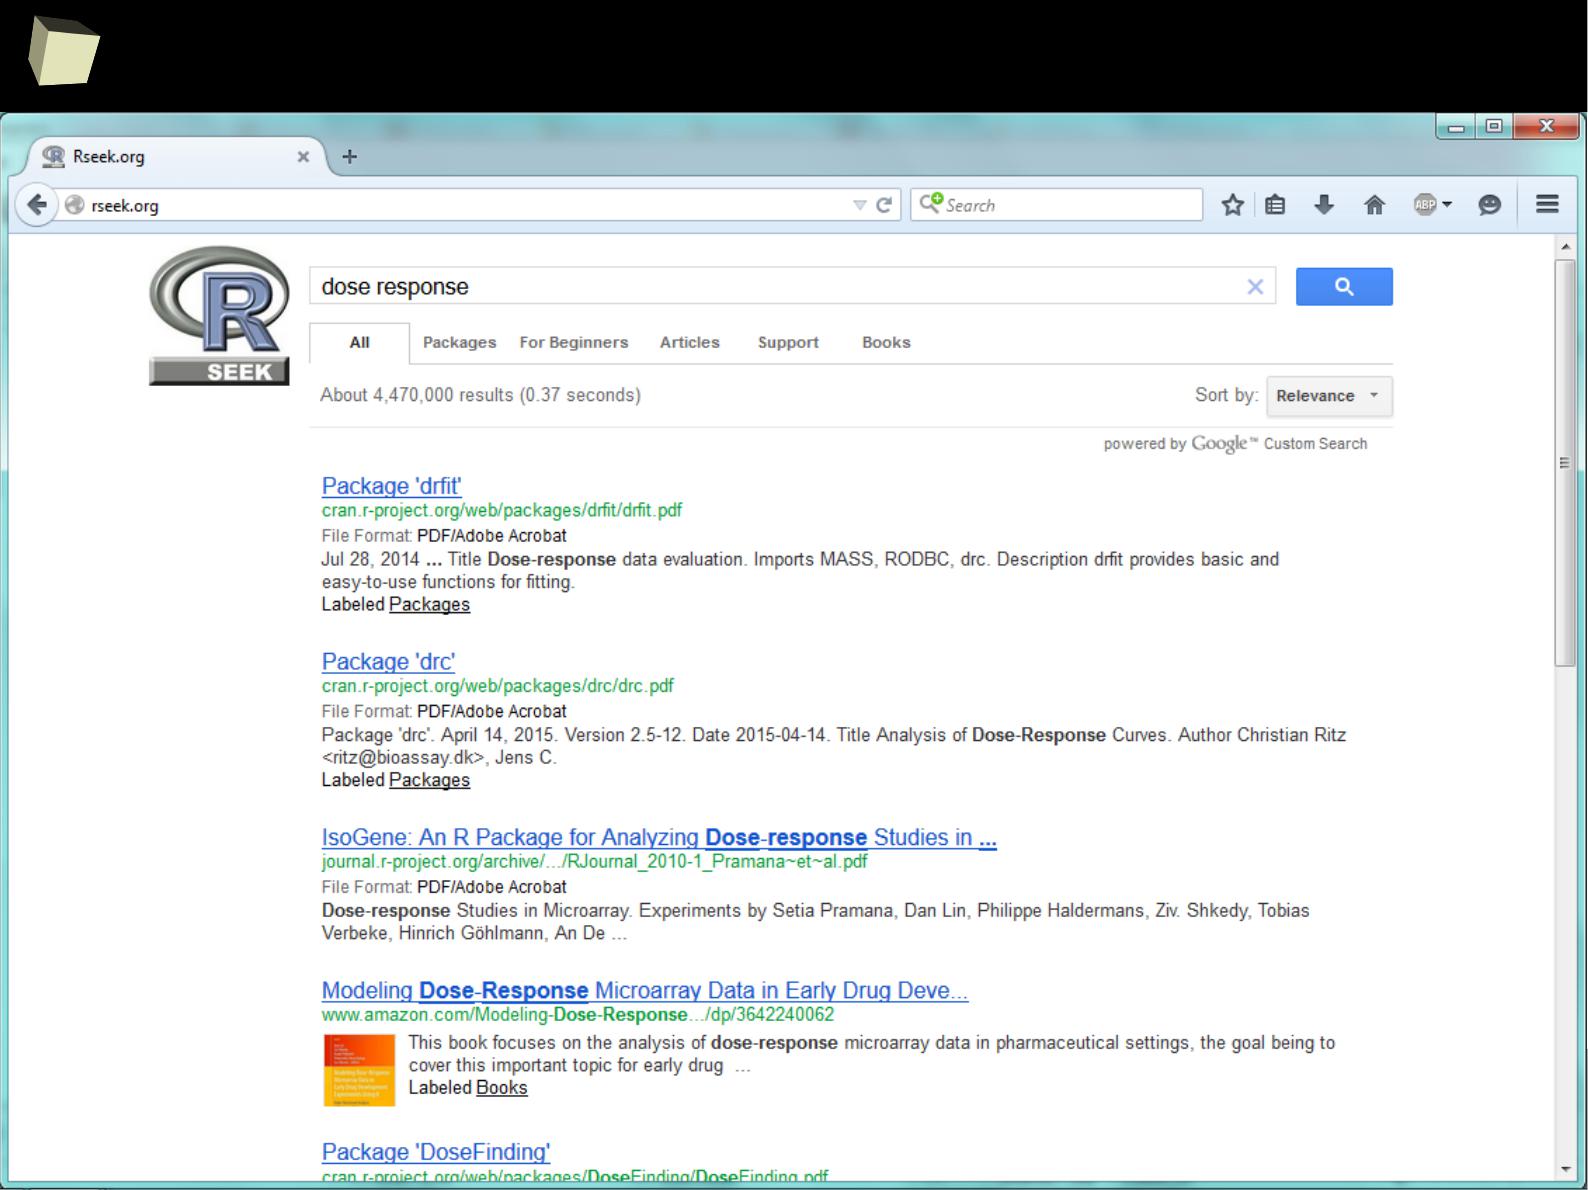
Where to seaRch? → Rseek.org

1
0
8
Where to seaRch? → R Site Search
1
0
9
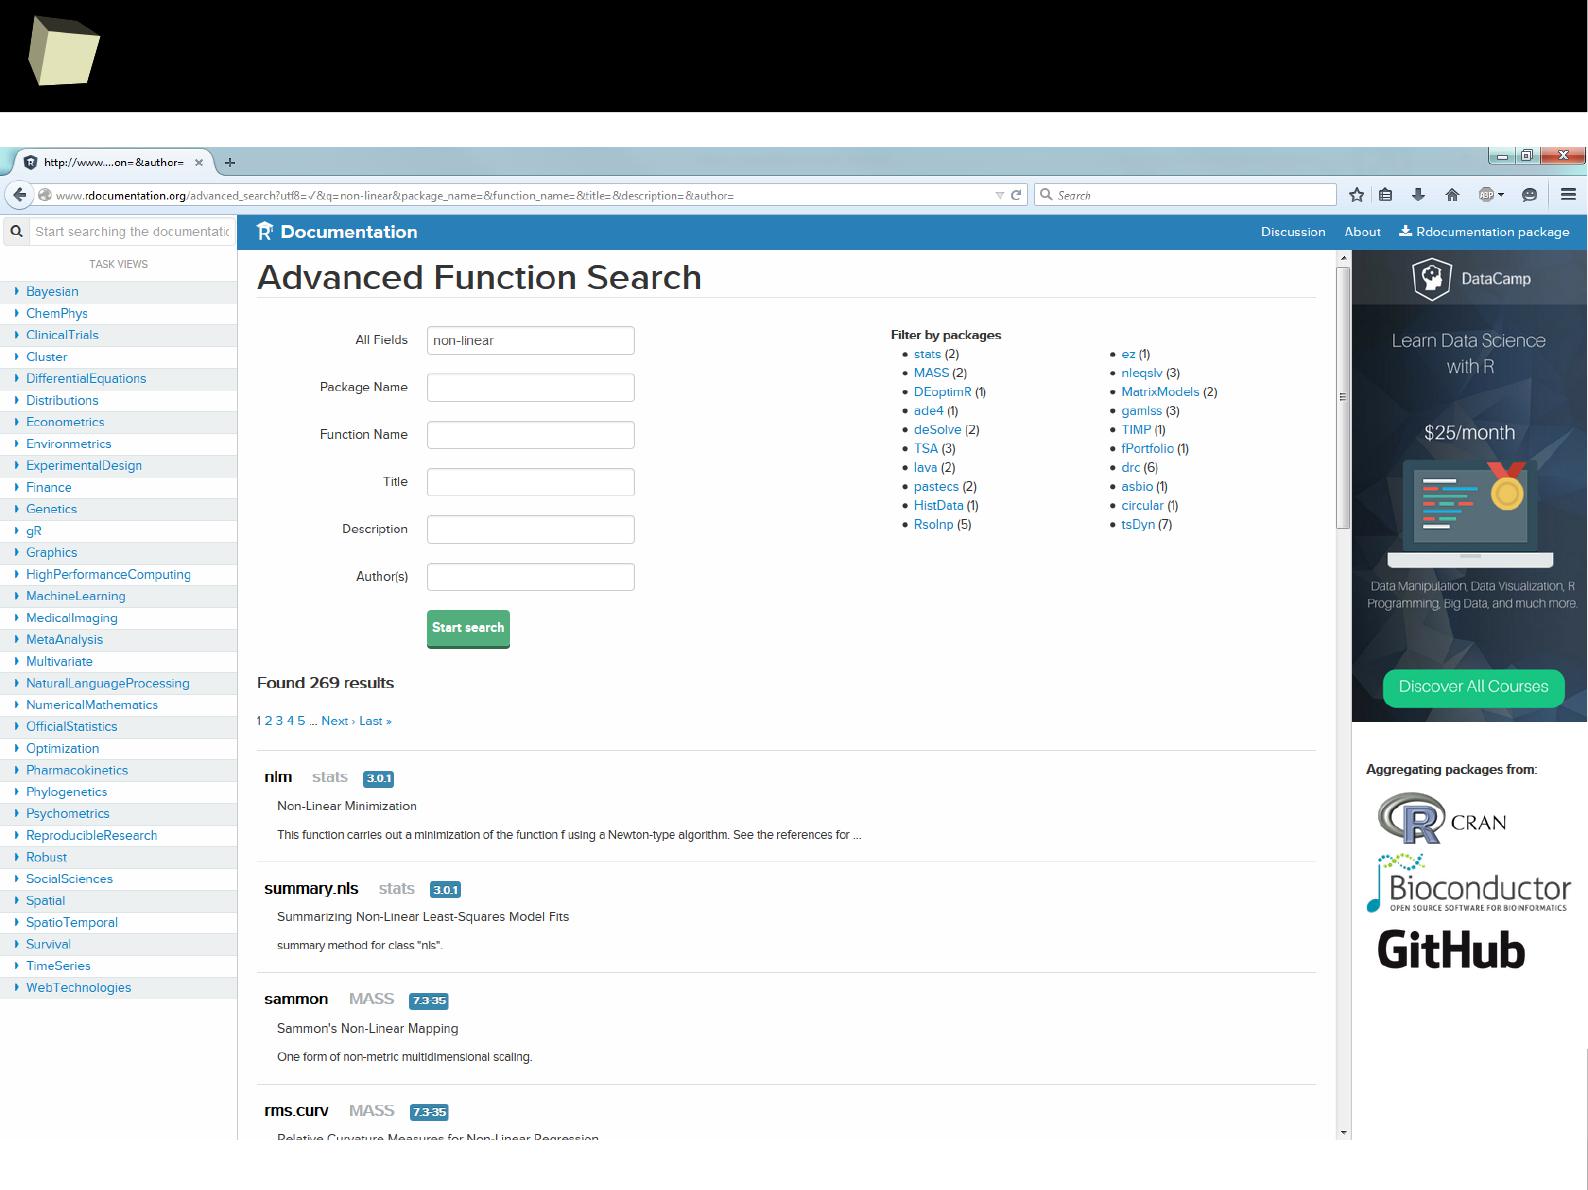
Where to seaRch? → R Documentation

1
1
0
13 reasons why you will love GNU R
I R is (extremely) cheap. In fact - it's free :)
II R has (extremely) wide range of capabilities
III R is supported by the world of science
IV R is supported by the community
V R is supported by the business
VI R is able to read data in many formats
VII Interoperability is easy to achieve
VIII R is truly cross-platform
IX R offers numerous ways of presenting data
X There are many options to optimize the code
XI R is able to handle large amount of data
XII R has a set of fancy tools and IDEs
XII FDA accepted using R for drug trials!

1
1
1
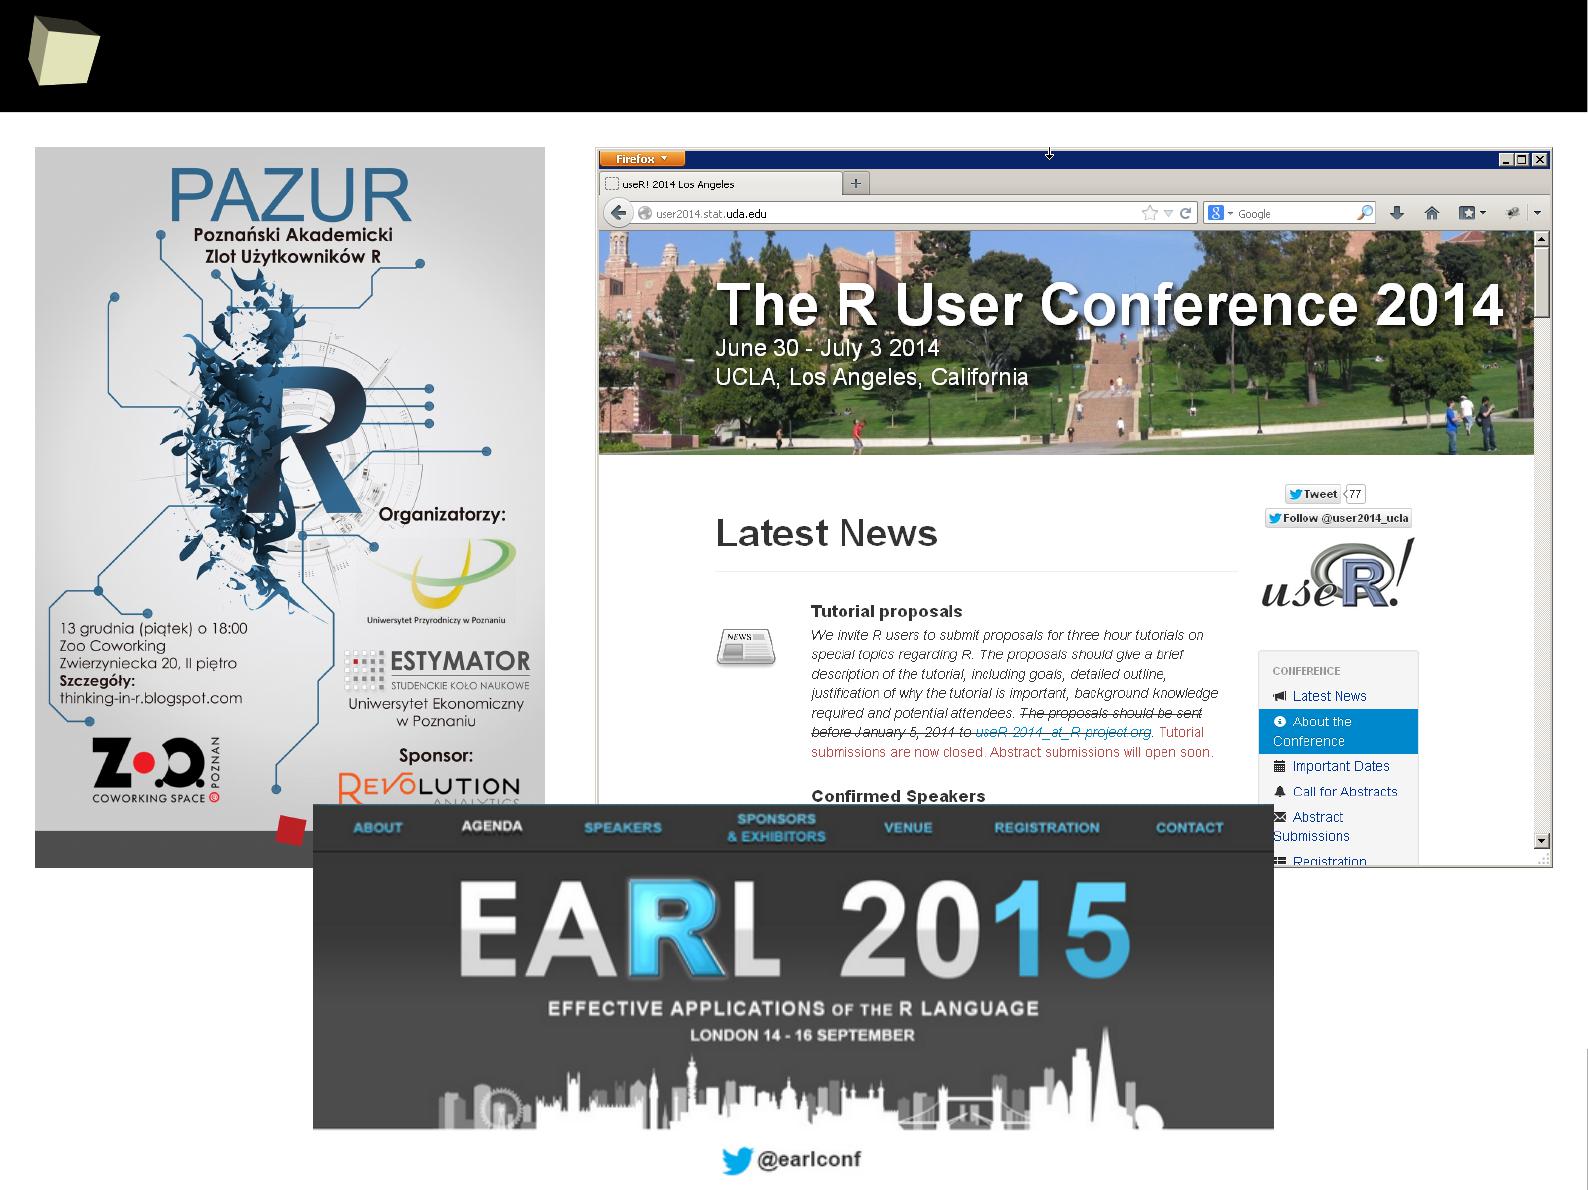
...supported by the community
R is a global community of more than 2 million
and still growing!
users
(2012, Oracle)
and
developers who voluntarily contribute their time and technical expertise to
maintain, support, test and extend the R language and its environment, tools
and infrastructure (e.g. CRAN). Among them are experienced statisticians, often
employed in the well-known pharmaceutical companies like Merck or Amgen.
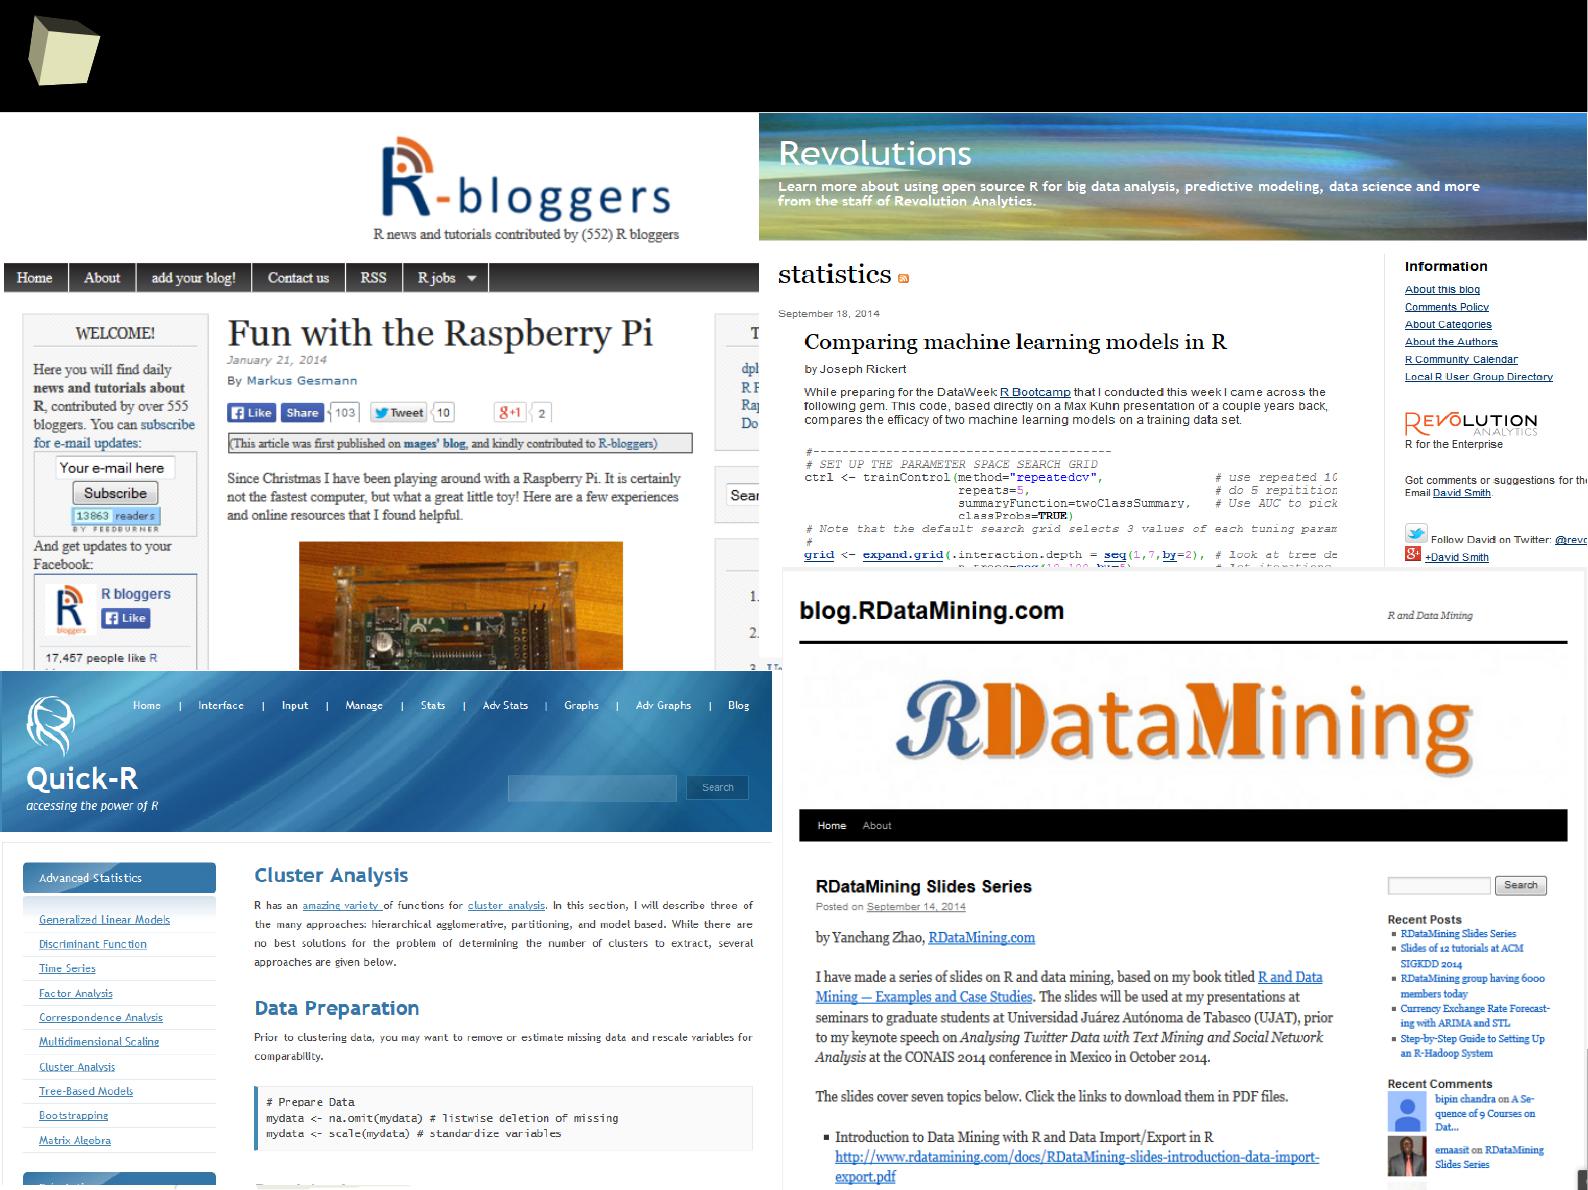
Hundreds of bloggers maintain their webpages, take active part in communities
both online and offline through hundreds of forums and mailing lists, building
knowledge base (visit rseek.org). UseRs also organize meetings and conferences.
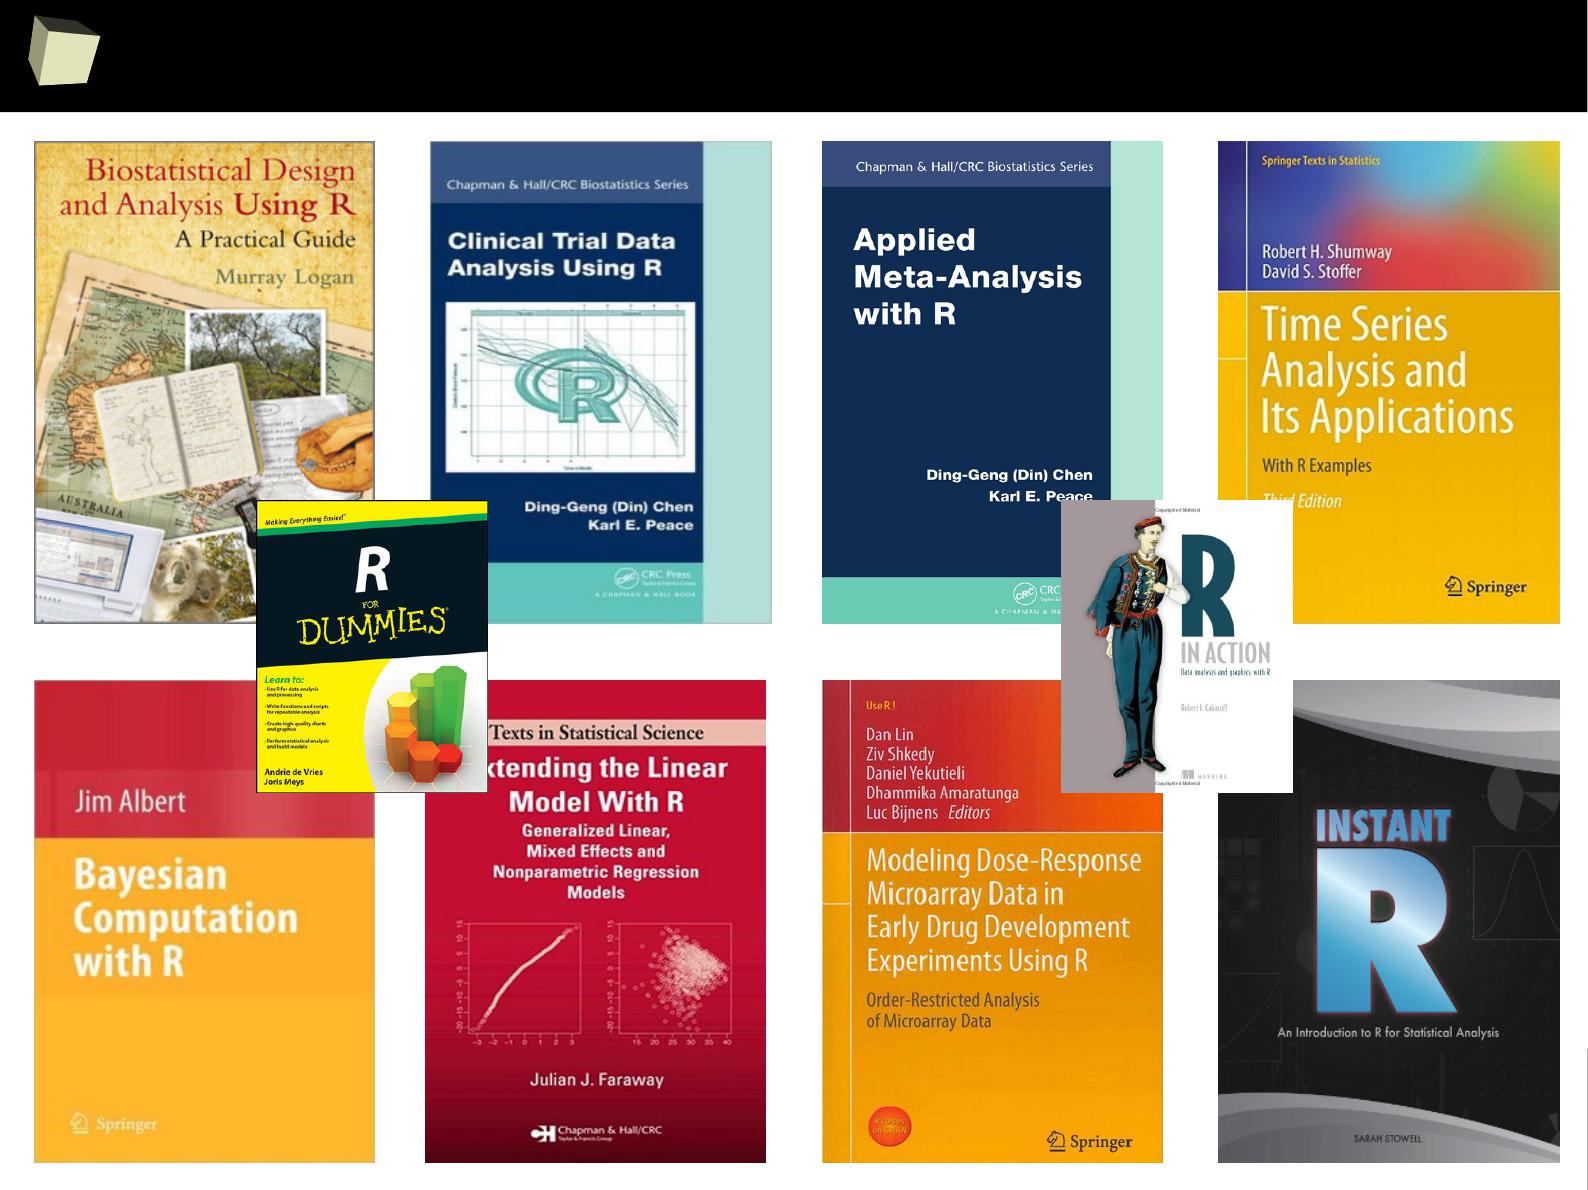
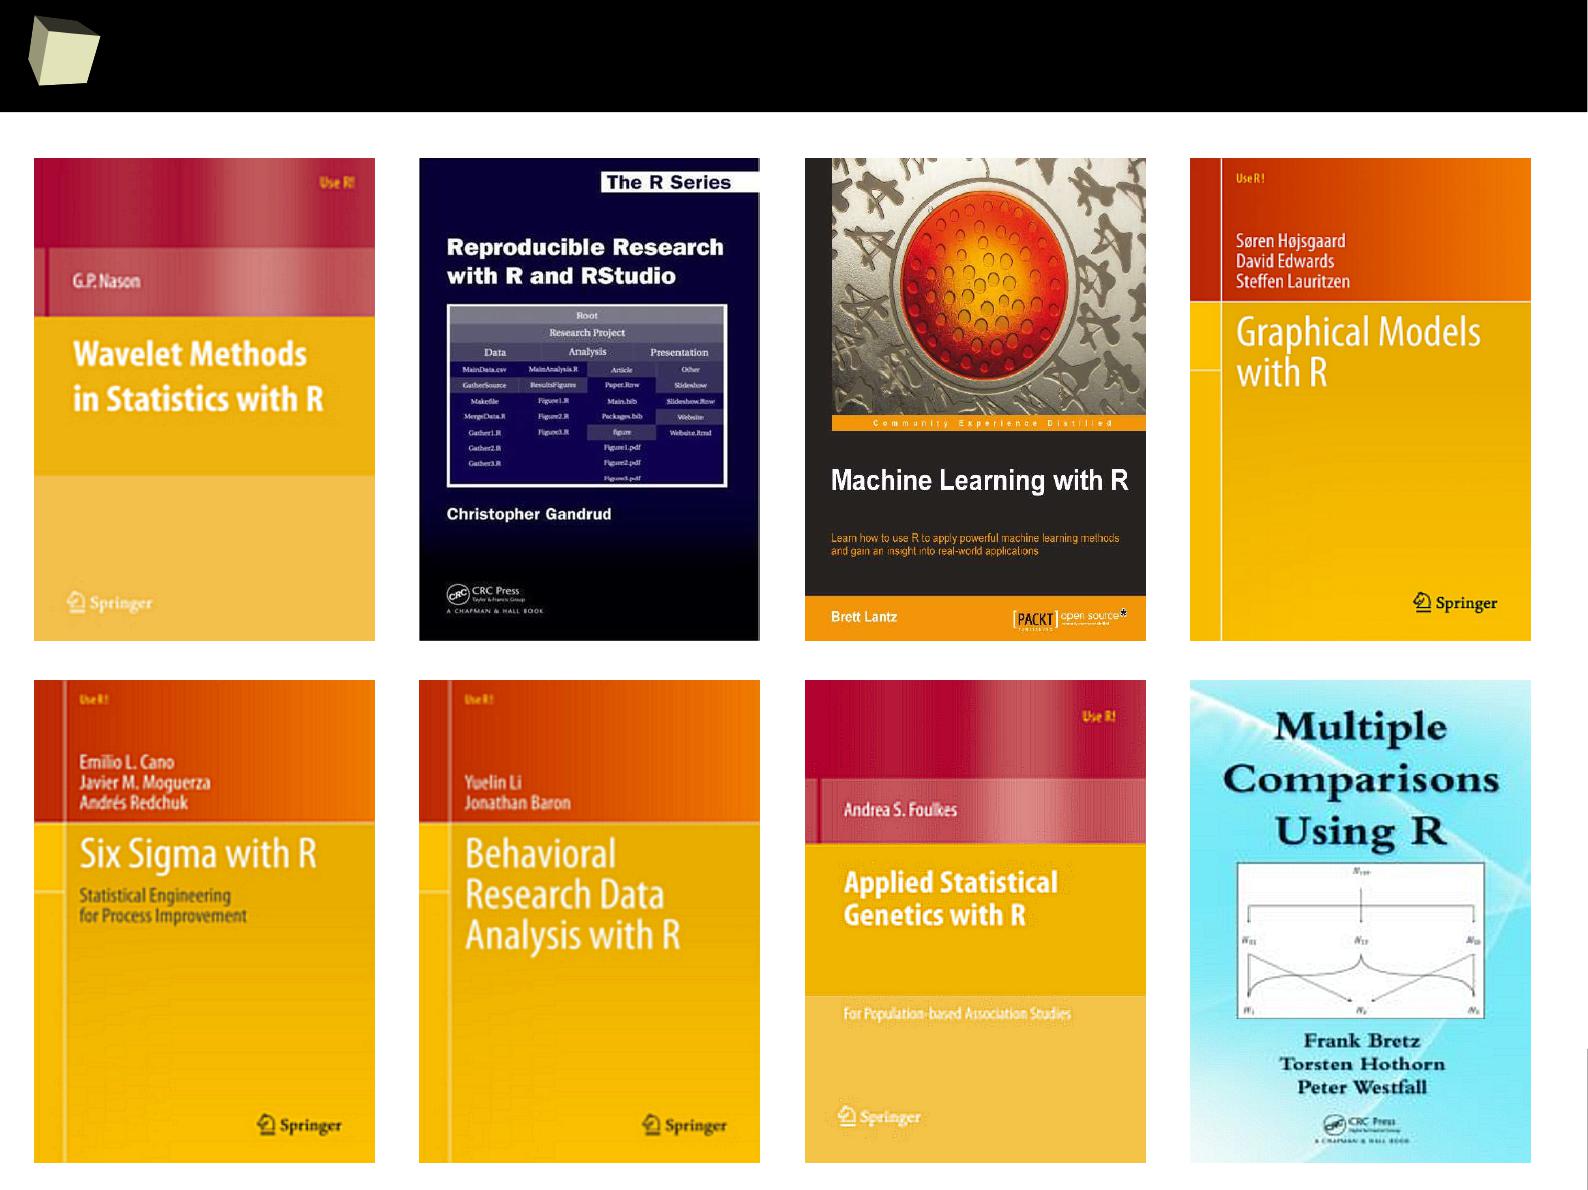
There are dozens of valuable books written both by academics, researchers and
“regular” R users. These books are issued by the prestigious publishing houses
like Springer Verlag and Wiley & Sons.

1
1
2
...supported by the community
The size of the R user community (diffcult to define precisely, because
there are no sales transactions, but conservatively estimated as being in
the tens of thousands, with some independent estimates in the hundreds of
thousands), provides for extensive review of source code and testing in
“real world" settings outside the connes of the formalized testing performed
by R Core.
This is a key distinction, related to product quality, between R and
similar software that is only available to end users in a binary, executable
format. In conjunction with detailed documentation and references
provided to end users, the size of the R user community, all having full
access to the source code, enables a superior ability to anticipate and verify
R's performance and the results produced by R.
http://www.r-project.org/doc/R-FDA.pdf
1
1
3
...supported by the community
1
1
4
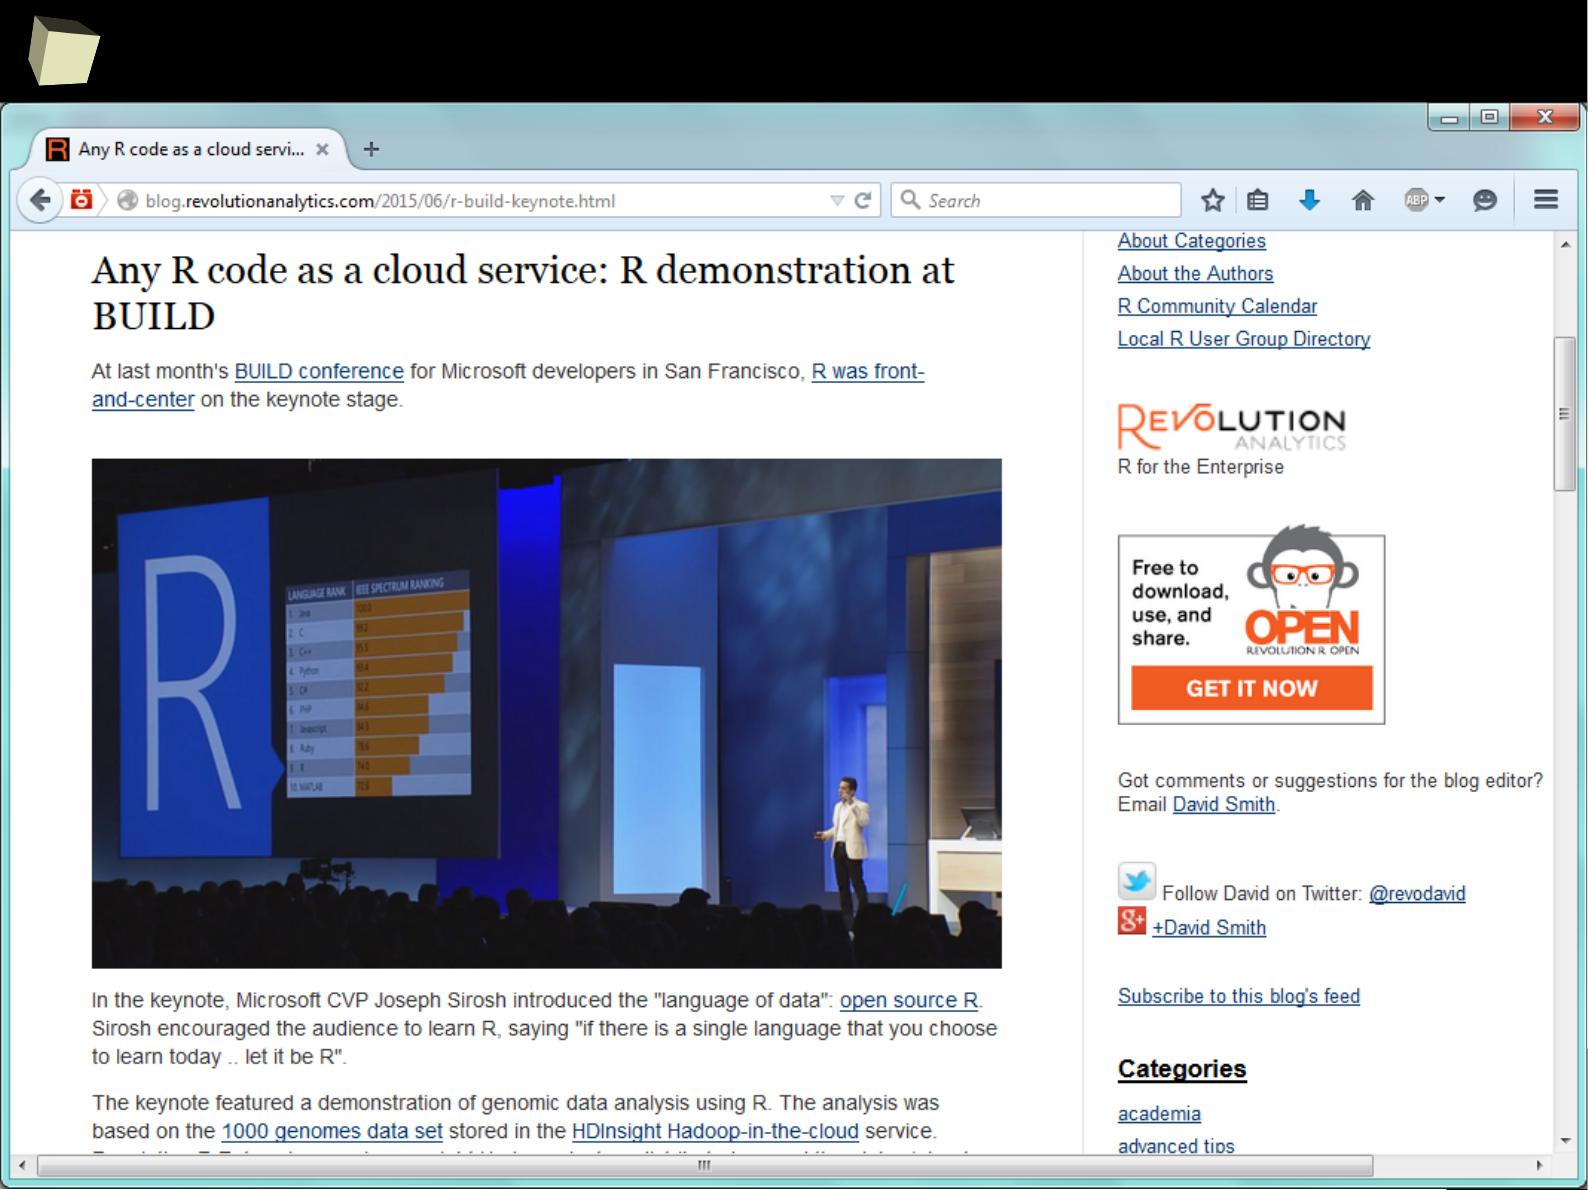
R at Microsoft's BUILD 2015 conference
say “wow!”
1
1
5
...supported by the community

1
1
6
13 reasons why you will love GNU R
I R is (extremely) cheap. In fact - it's free :)
II R has (extremely) wide range of capabilities
III R is supported by the world of science
IV ½ :) Books
V R is supported by the business
VI R is able to read data in many formats
VII Interoperability is easy to achieve
VIII R is truly cross-platform
IX R offers numerous ways of presenting data
X There are many options to optimize the code
XI R is able to handle large amount of data
XII R has a set of fancy tools and IDEs
XII FDA accepted using R for drug trials!

1
1
7
...some Polish books
1
1
8
...some foReign books...
1
1
9
...and courses provided by their authors...

1
2
0
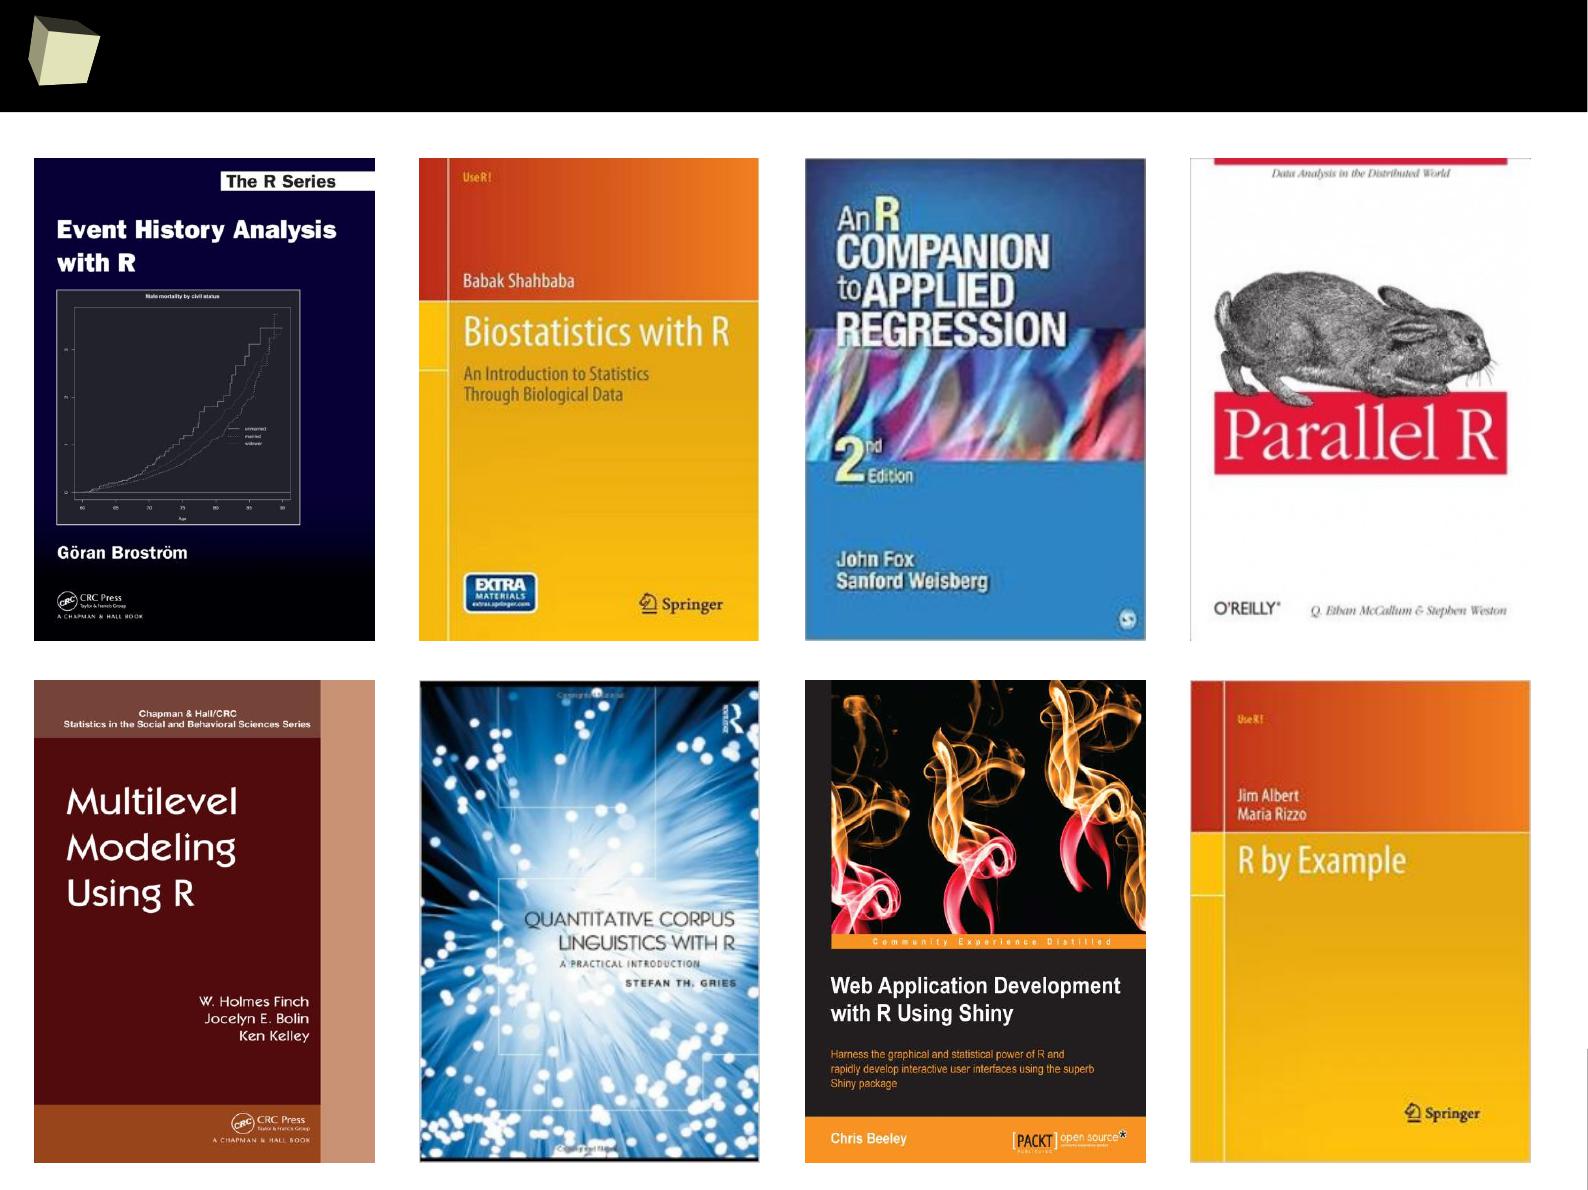
...more foreign books...
1
2
1
...and more foreign books...
1
2
2
...and more foreign books...

1
2
5
13 reasons why you will love GNU R
I R is (extremely) cheap. In fact - it's free :)
II R has (extremely) wide range of capabilities
III R is (widely) supported by the world of science
IV R is supported by the community
V R is (increasingly) supported by the business
VI R is able to read data in many formats
VII Interoperability is easy to achieve
VIII R is truly cross-platform
IX R offers numerous ways of presenting data
X There are many options to optimize the code
XI R is able to handle large amount of data
XII R has a set of fancy tools and IDEs
XII FDA accepted using R for drug trials!
1
2
6
...supported by the business
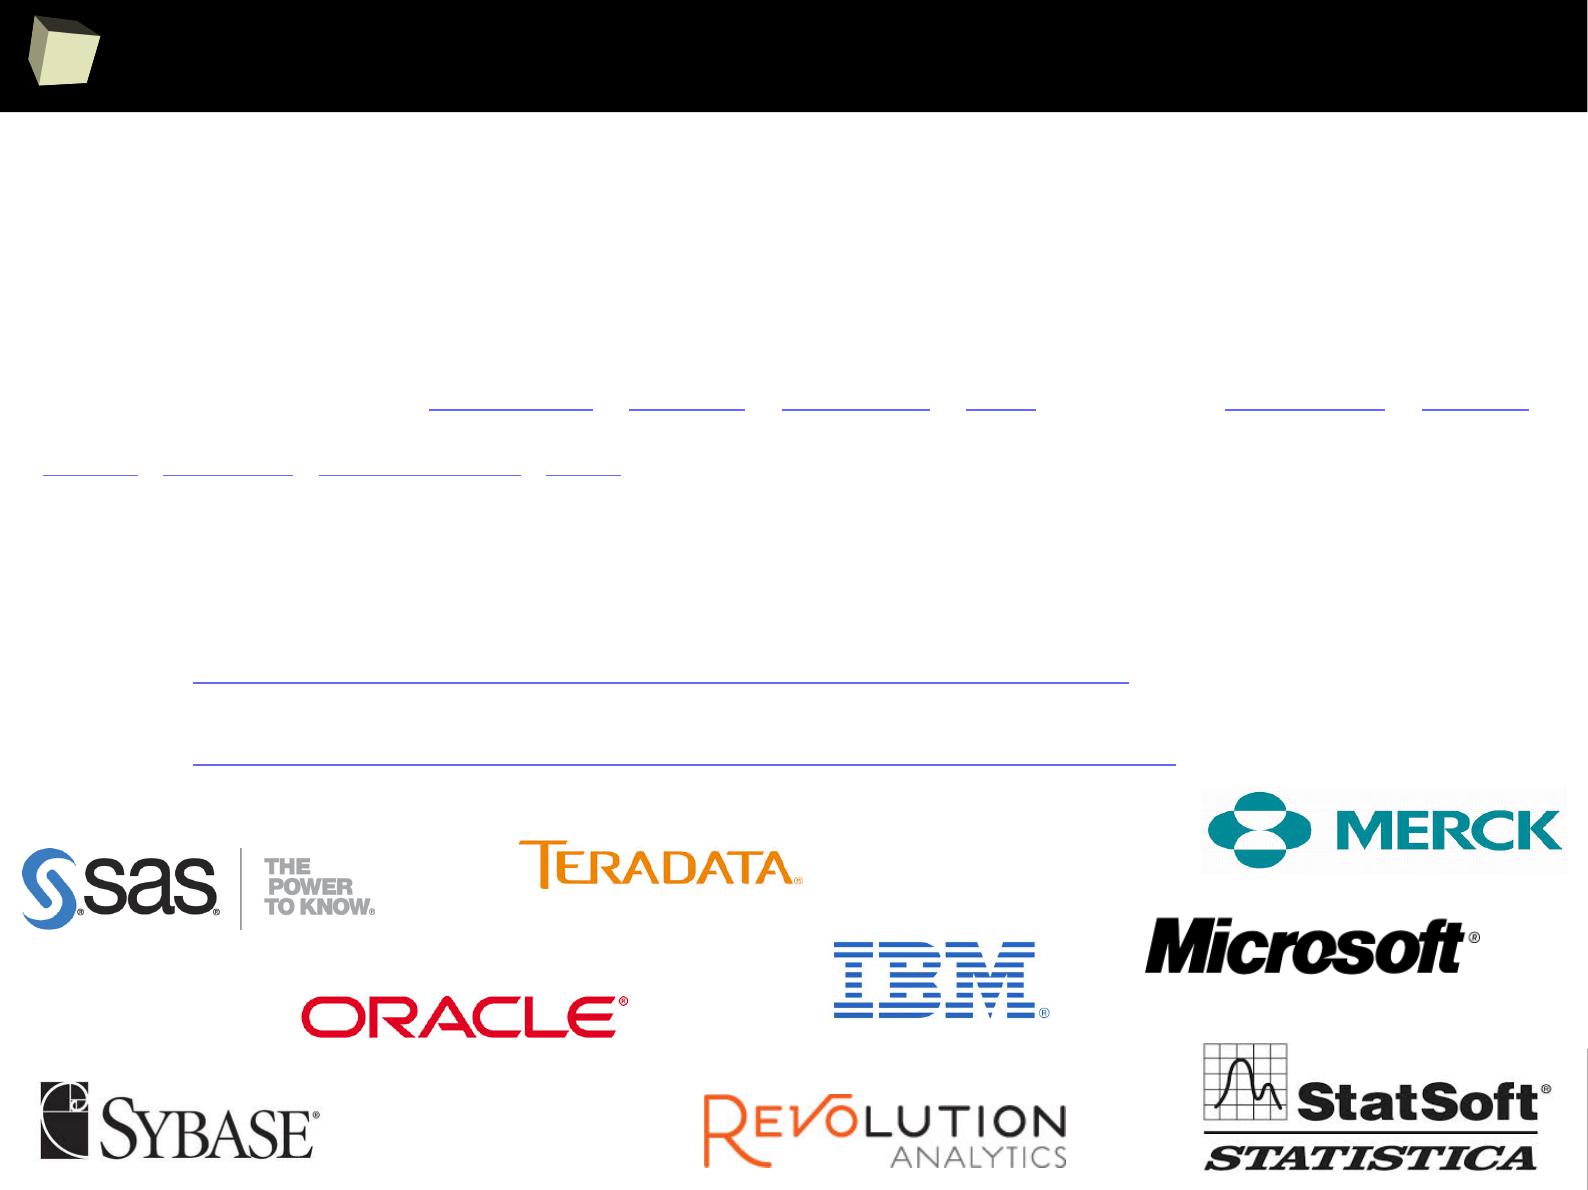
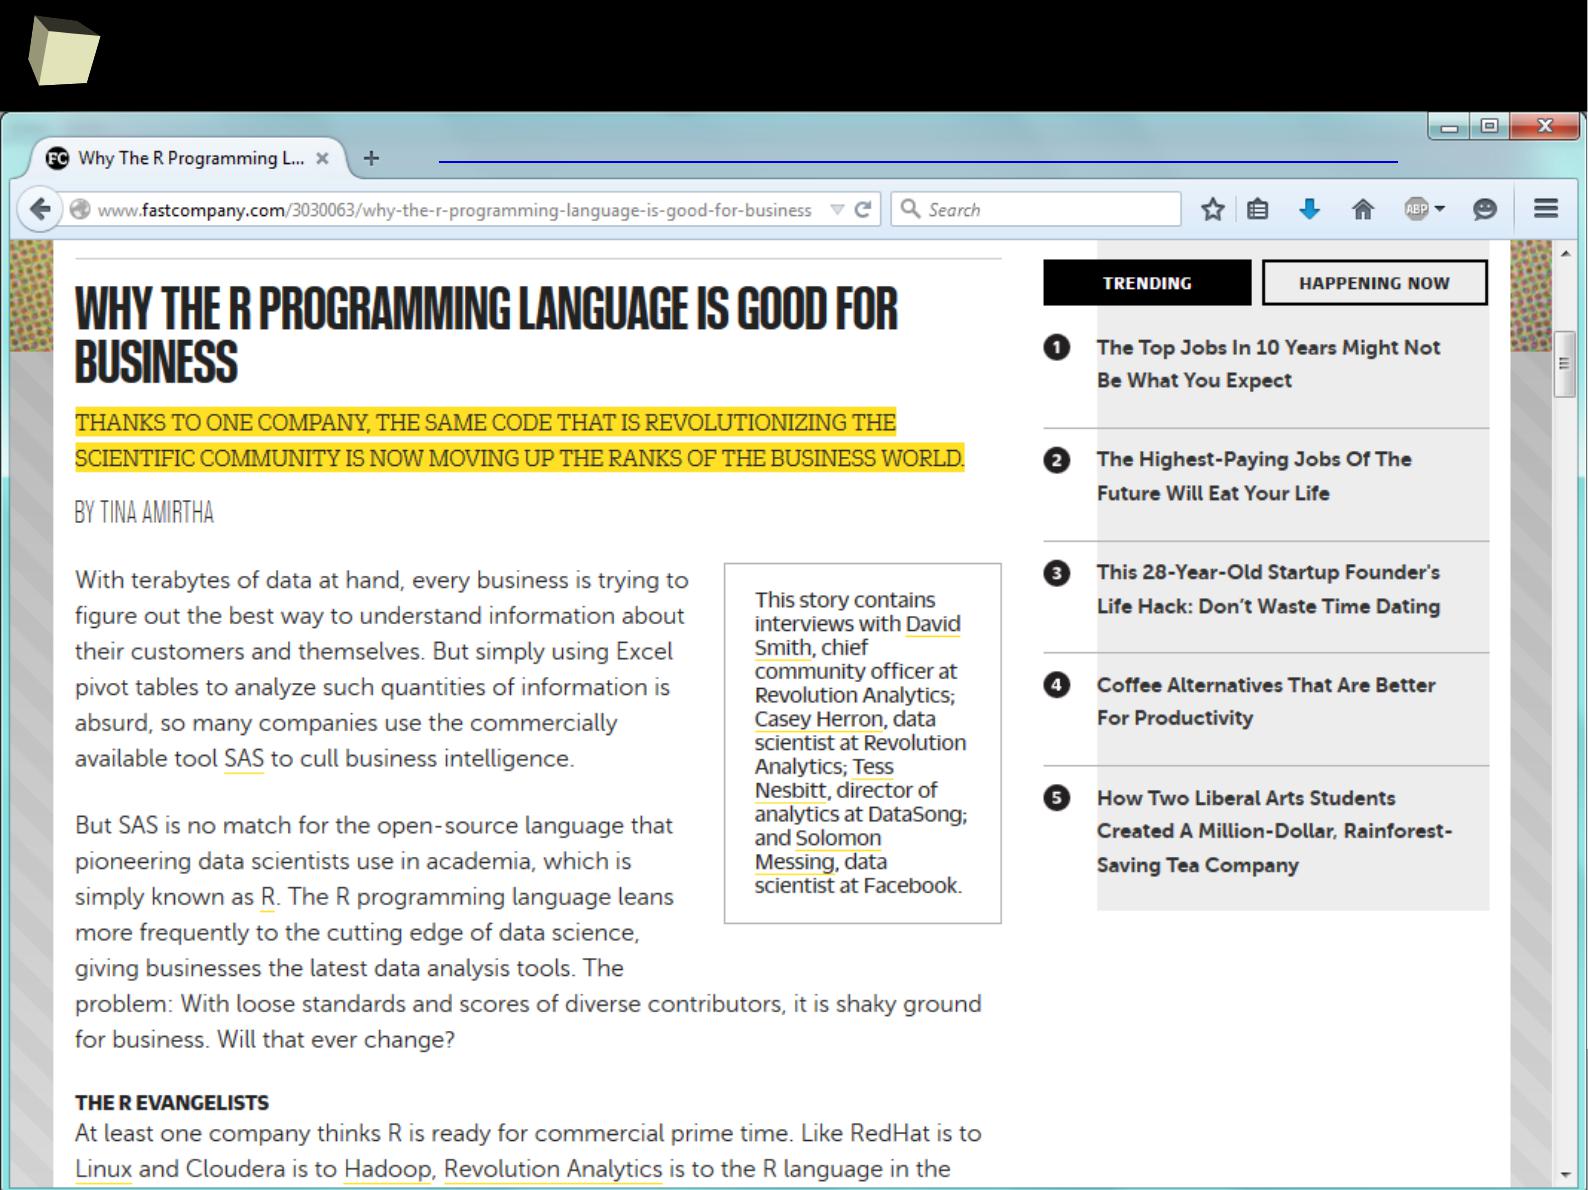
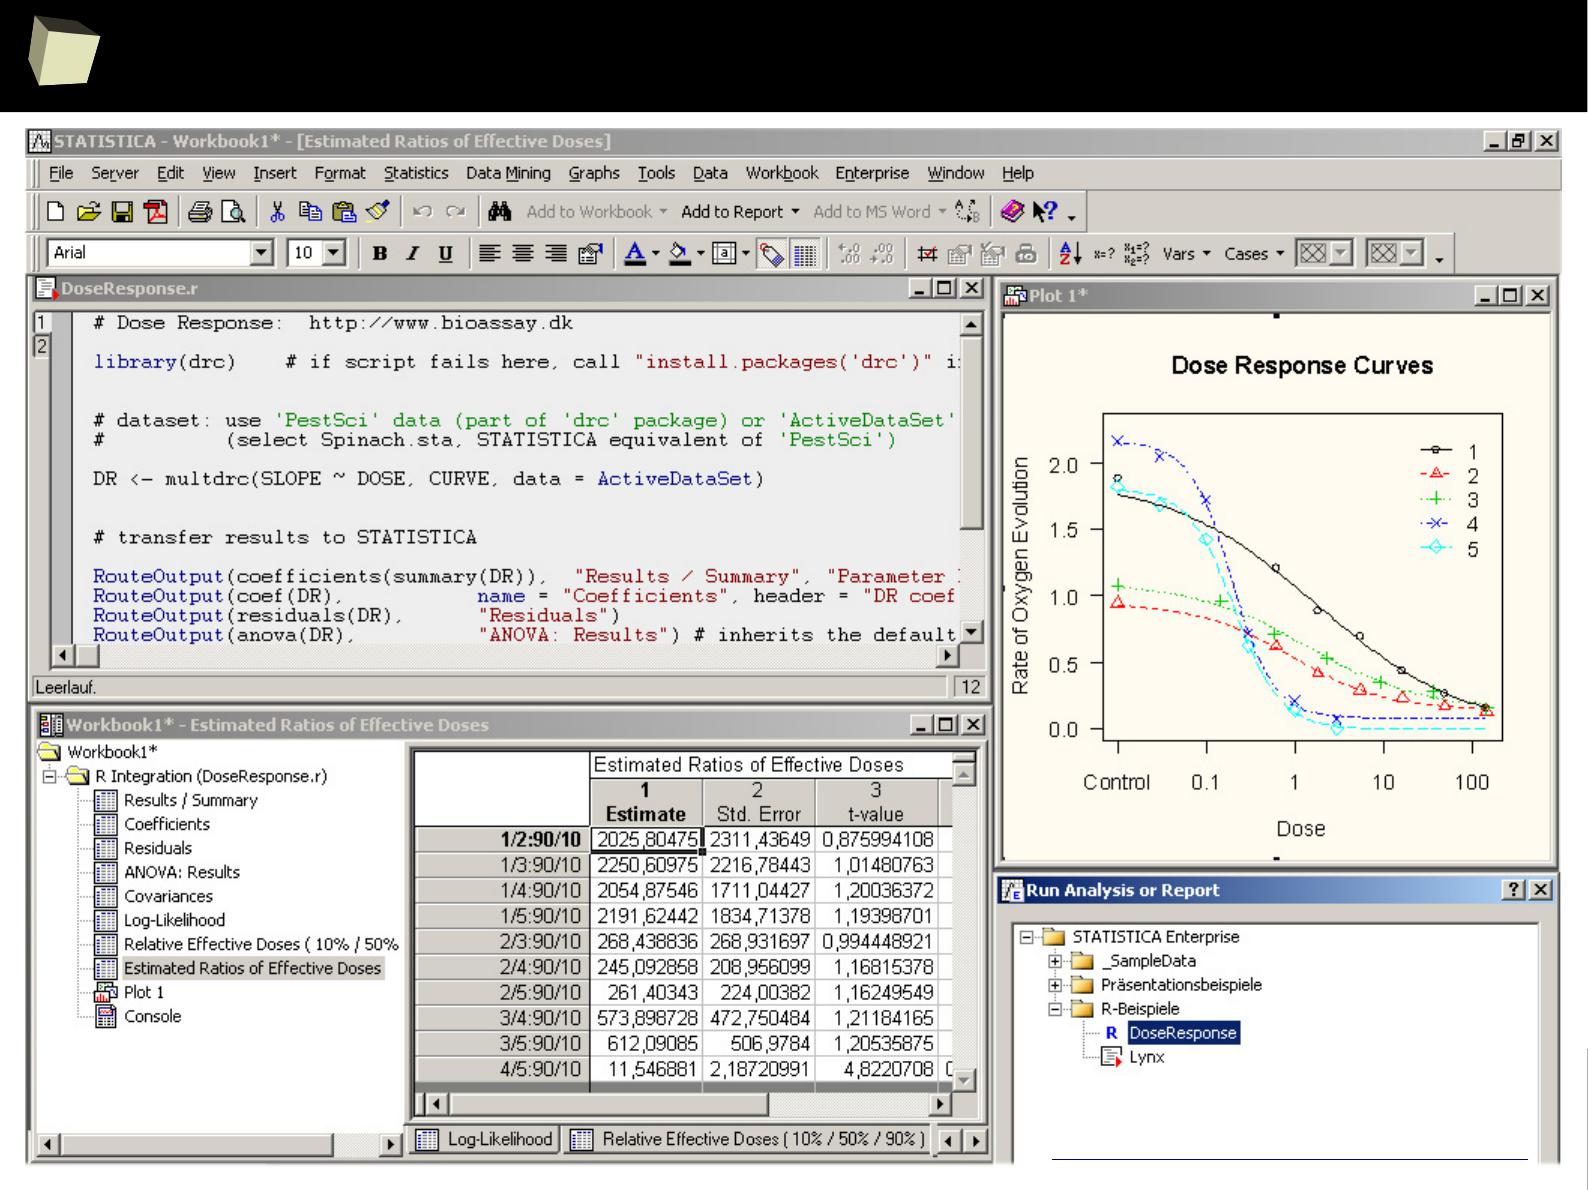
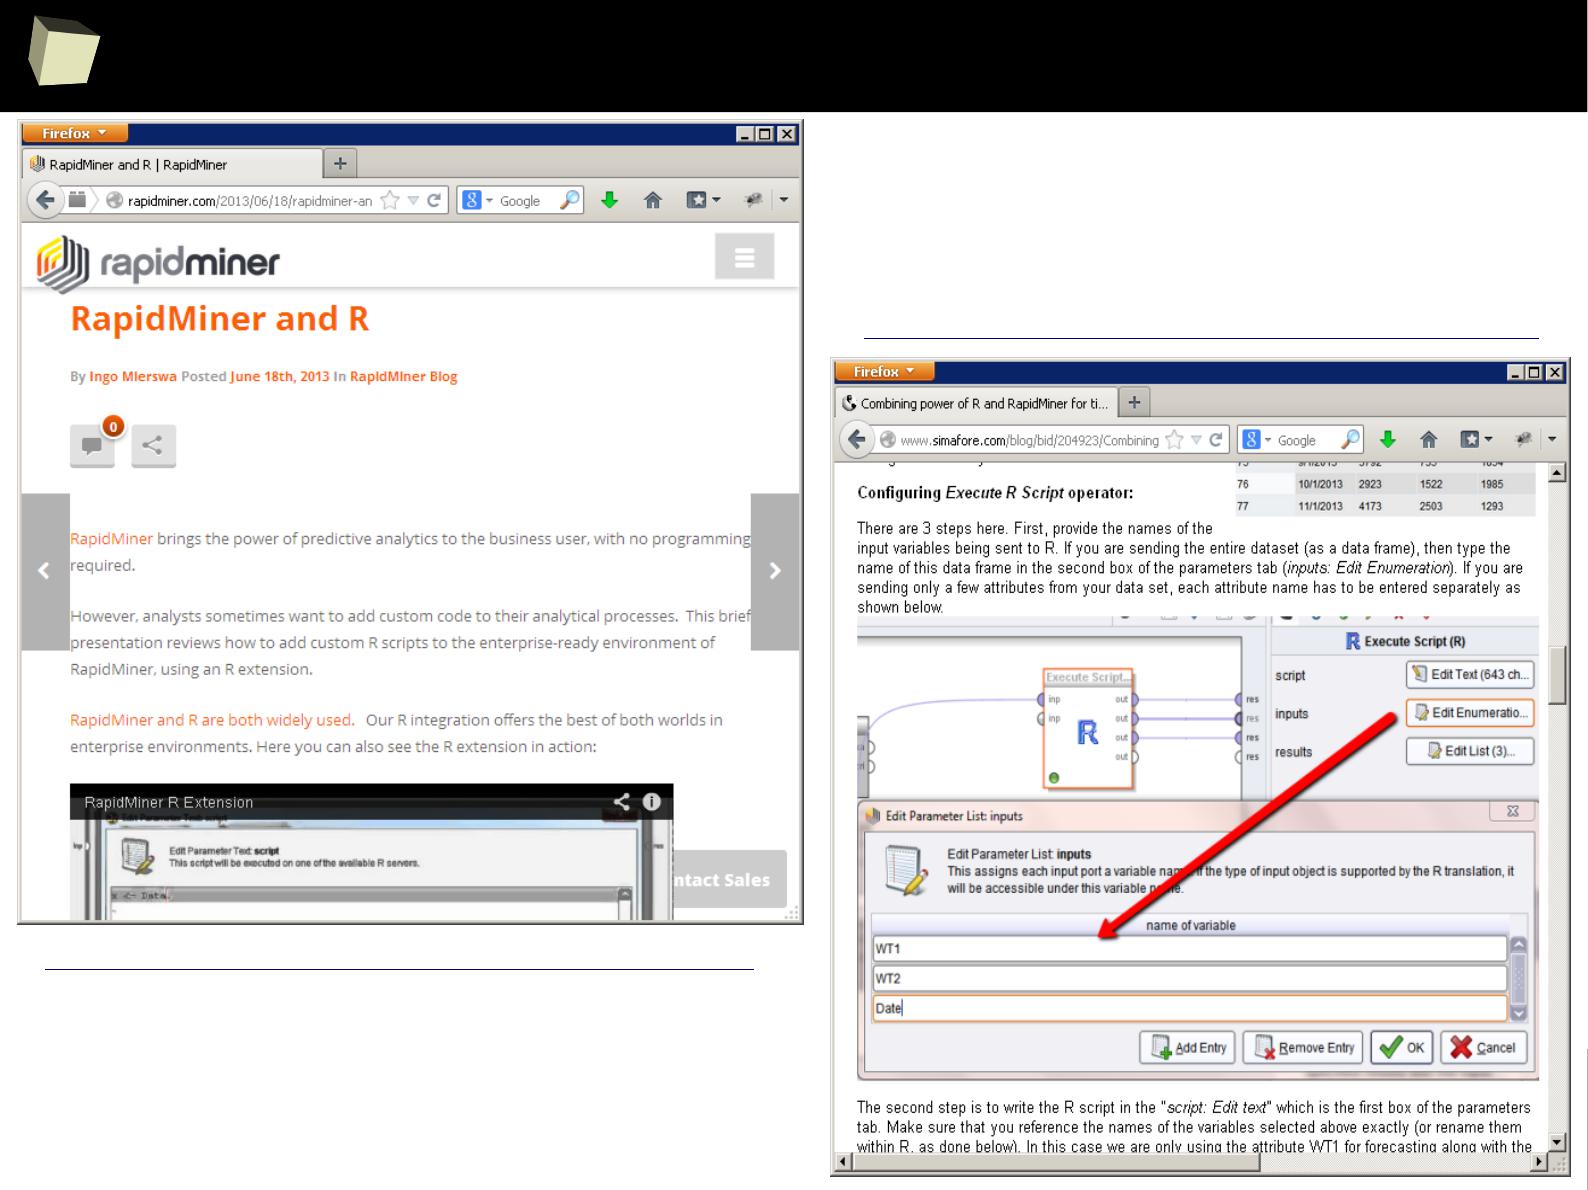
The biggest tycoons in the market of statistical analysis and data mining
recognize the potential of the R and develop specialistic packages as well as
provide methods of easy integration between their products and R. These include
companies such as Microsoft, Oracle, StatSoft, IBM (SPSS), Teradata, Merck,
Tibco, Sybase, RapidMiner, SAS and others.
The situation is well described by the two following articles:
1. Adoption of R by large Enterprise Software Vendors
2. R integrated throughout the enterprise analytics stack
1
2
8
R feat. Microsoft
1
2
9
R feat. Microsoft
1
3
3
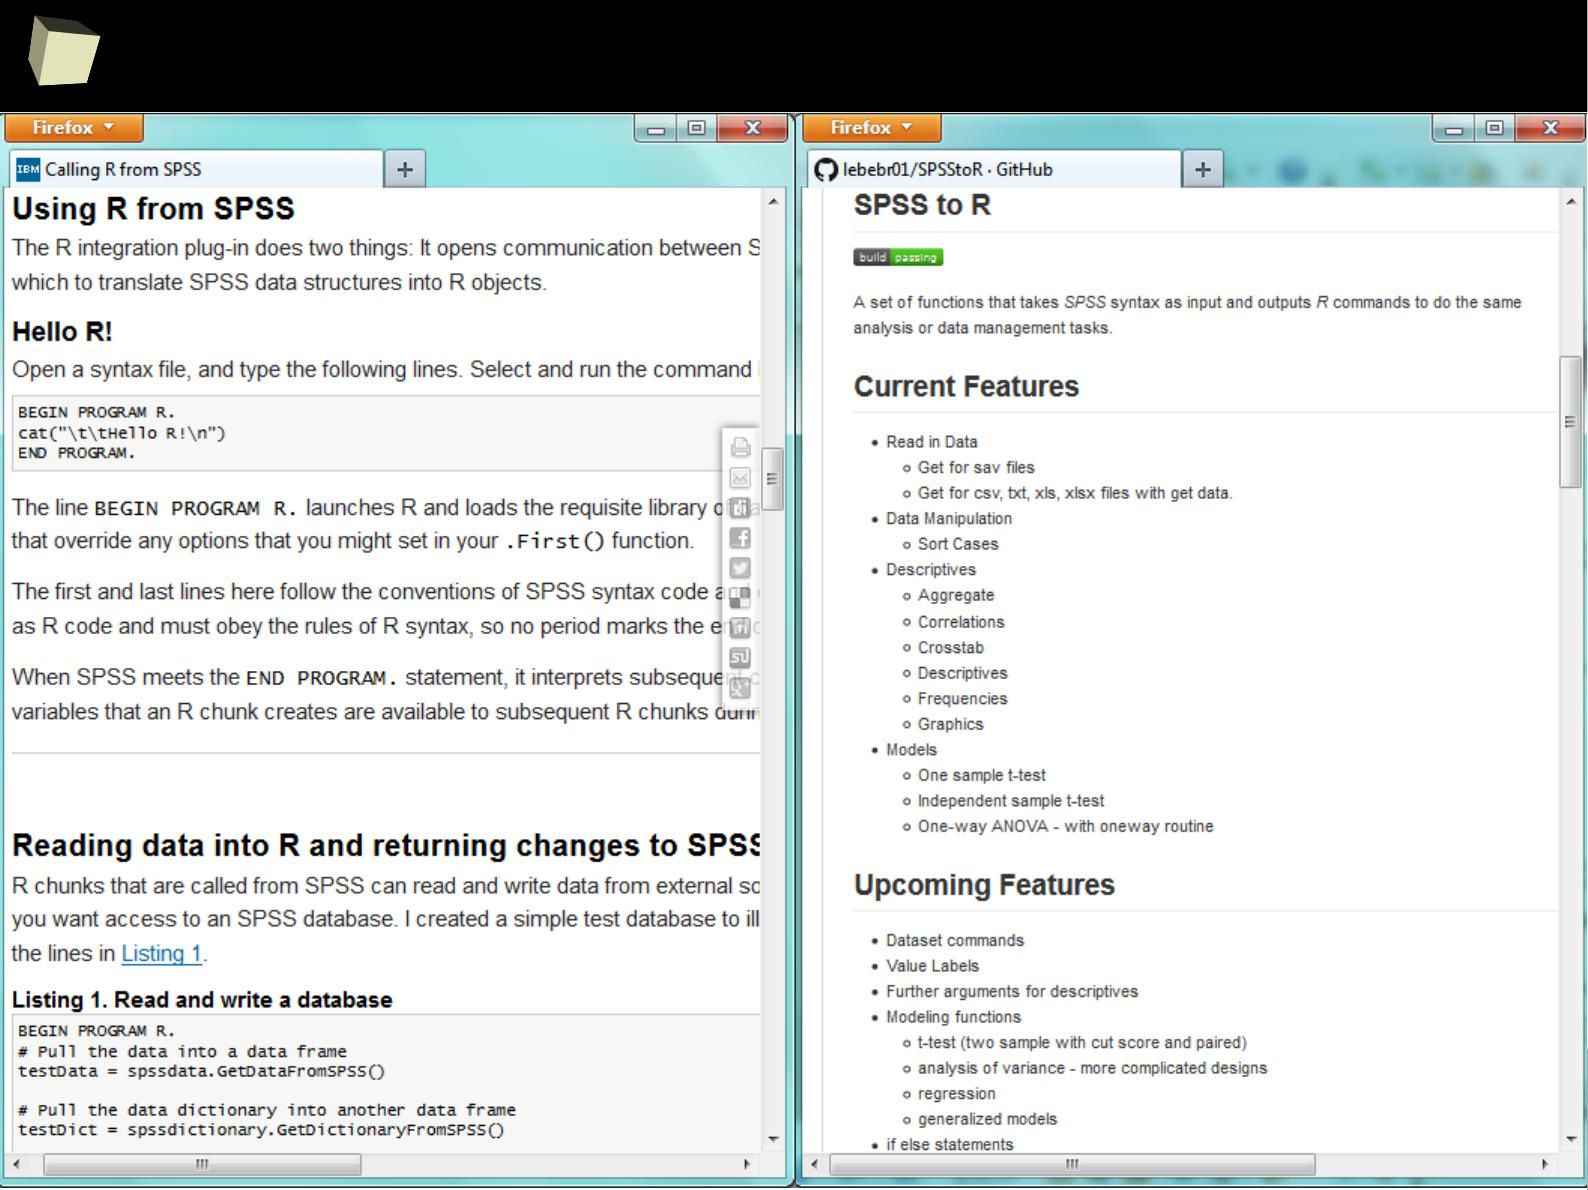
R feat. SPSS
1
3
4
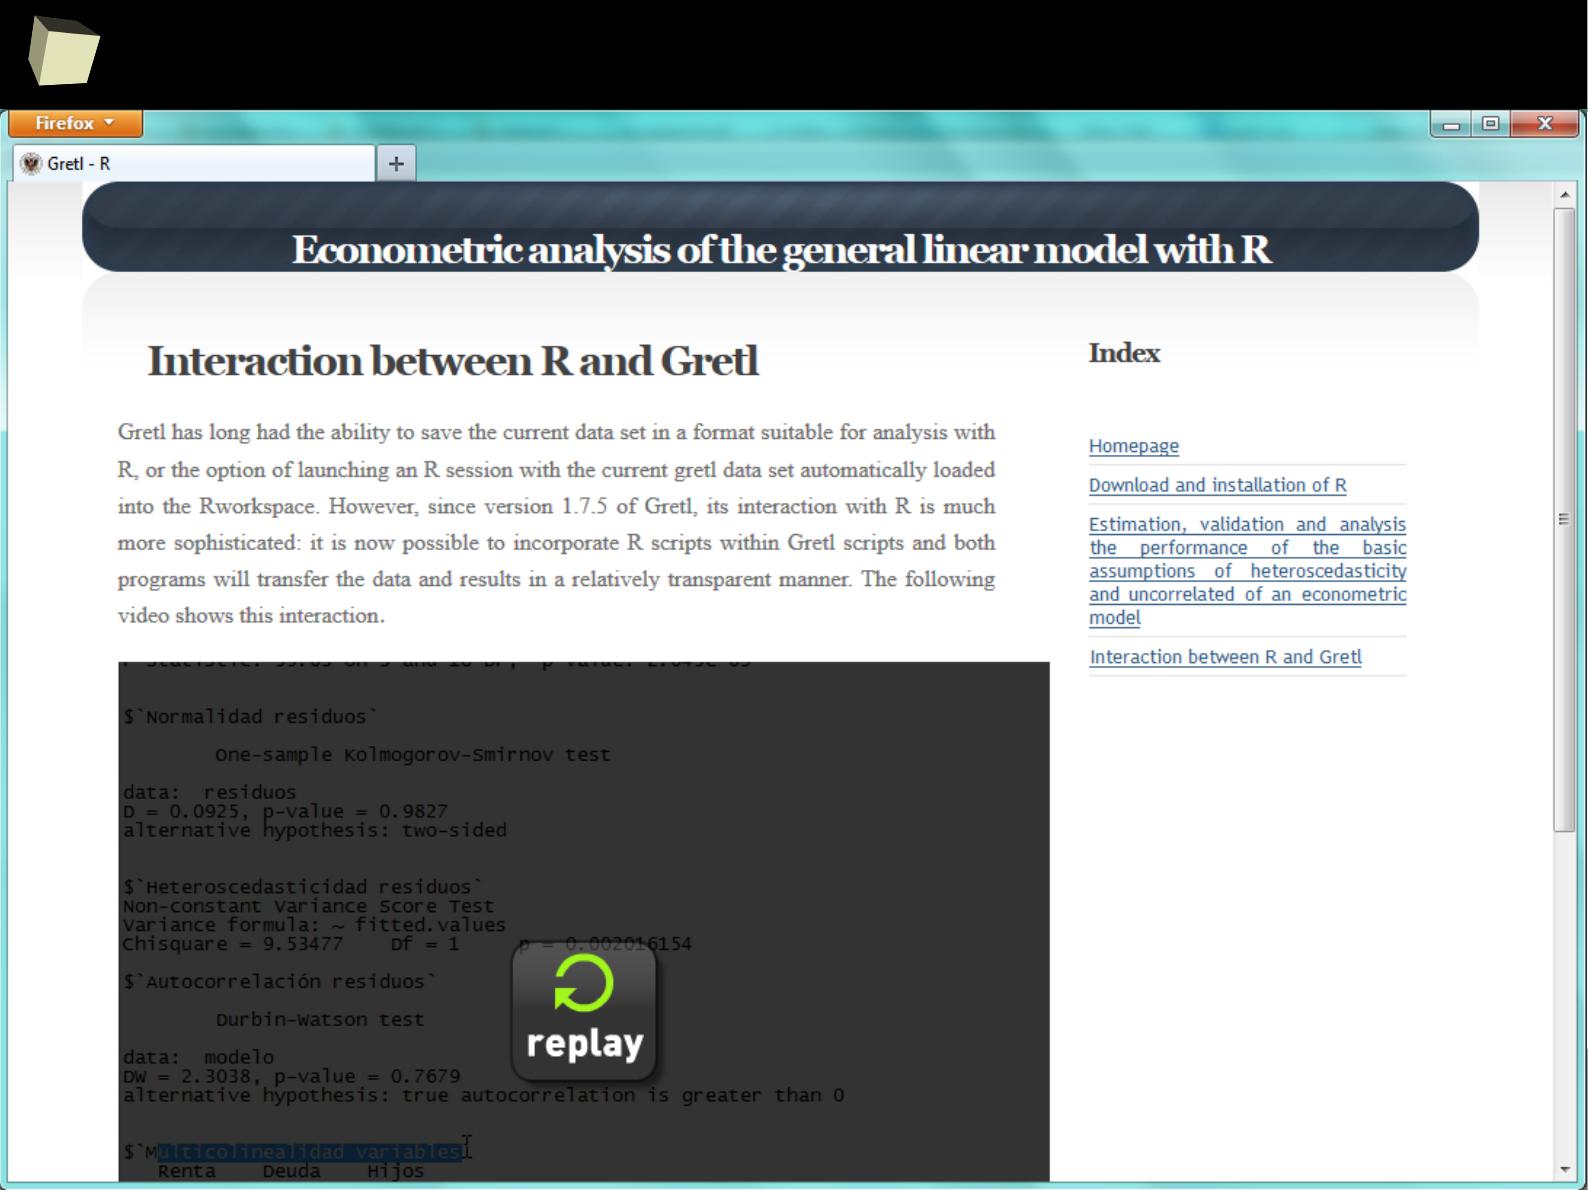
R feat. Gretl

1
3
5
13 reasons why you will love GNU R
I R is (extremely) cheap. In fact - it's free :)
II R has (extremely) wide range of capabilities
III R is (widely) supported by the world of science
IV R is supported by the community
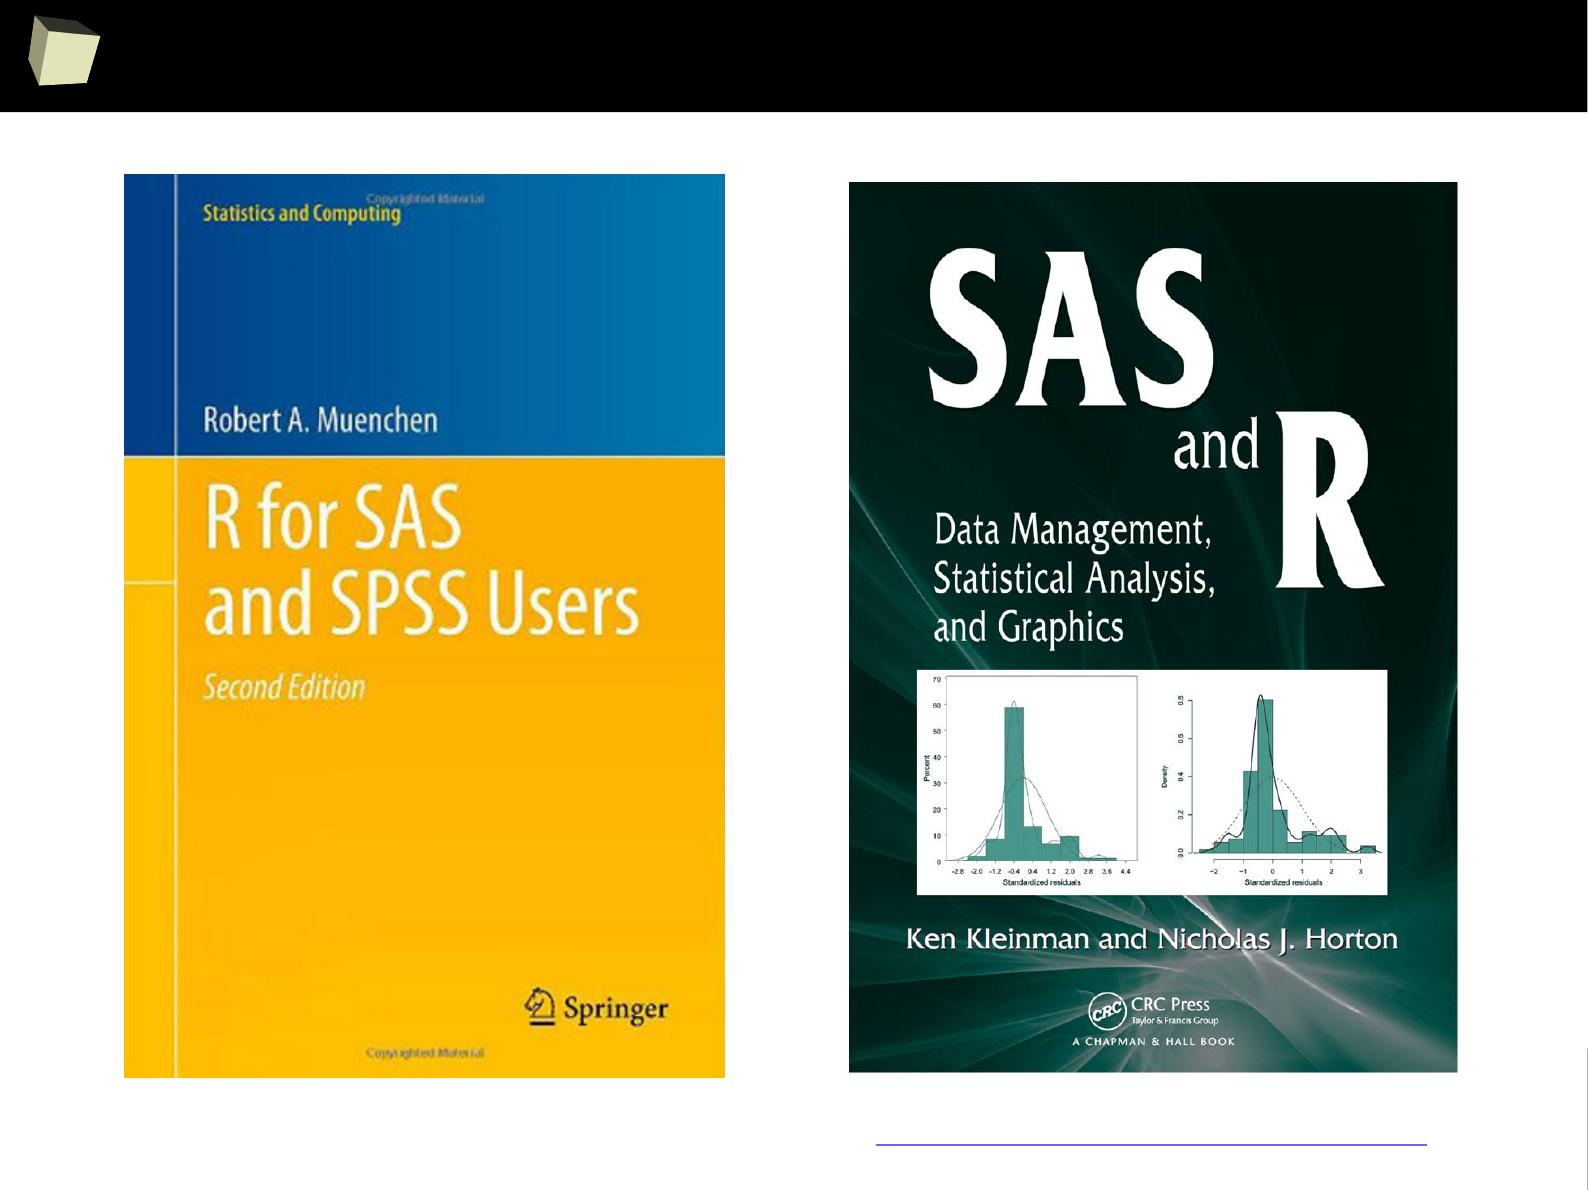
V ½ :) R and SAS
VI R is able to read data in many formats
VII Interoperability is easy to achieve
VIII R is truly cross-platform
IX R offers numerous ways of presenting data
X There are many options to optimize the code
XI R is able to handle large amount of data
XII R has a set of fancy tools and IDEs
XII FDA accepted using R for drug trials!
1
3
6
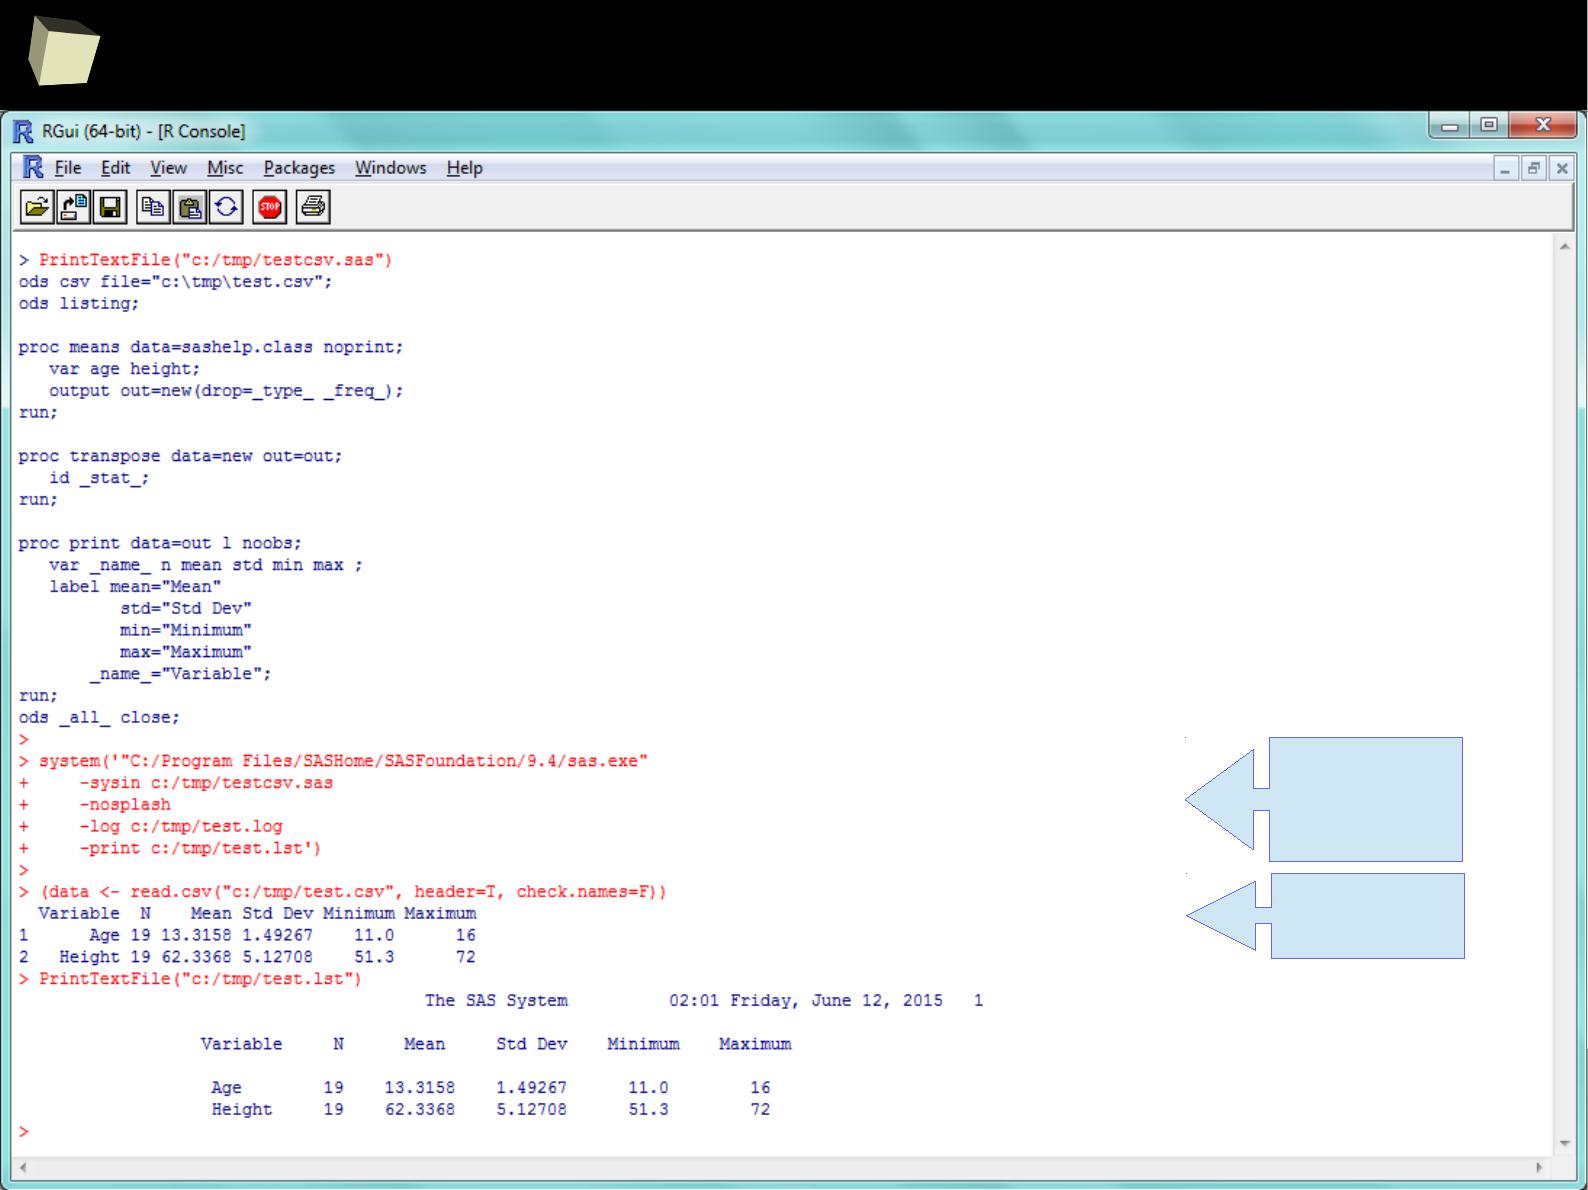
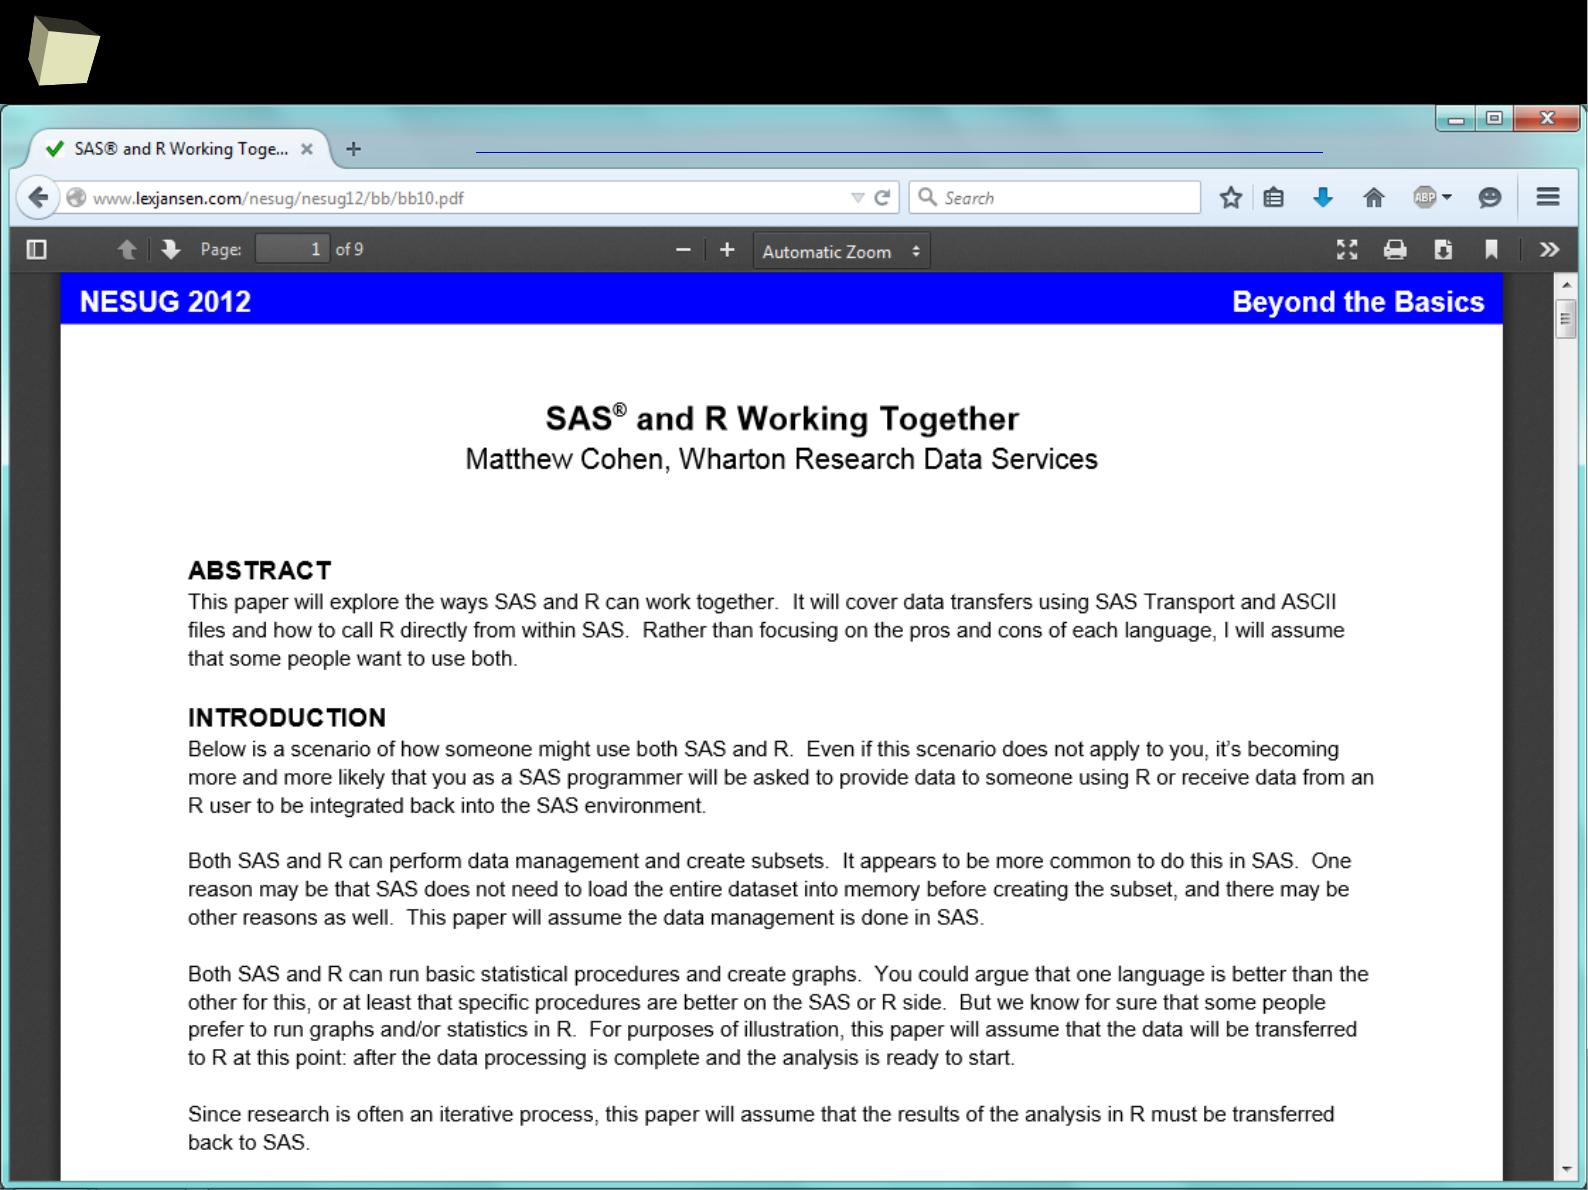
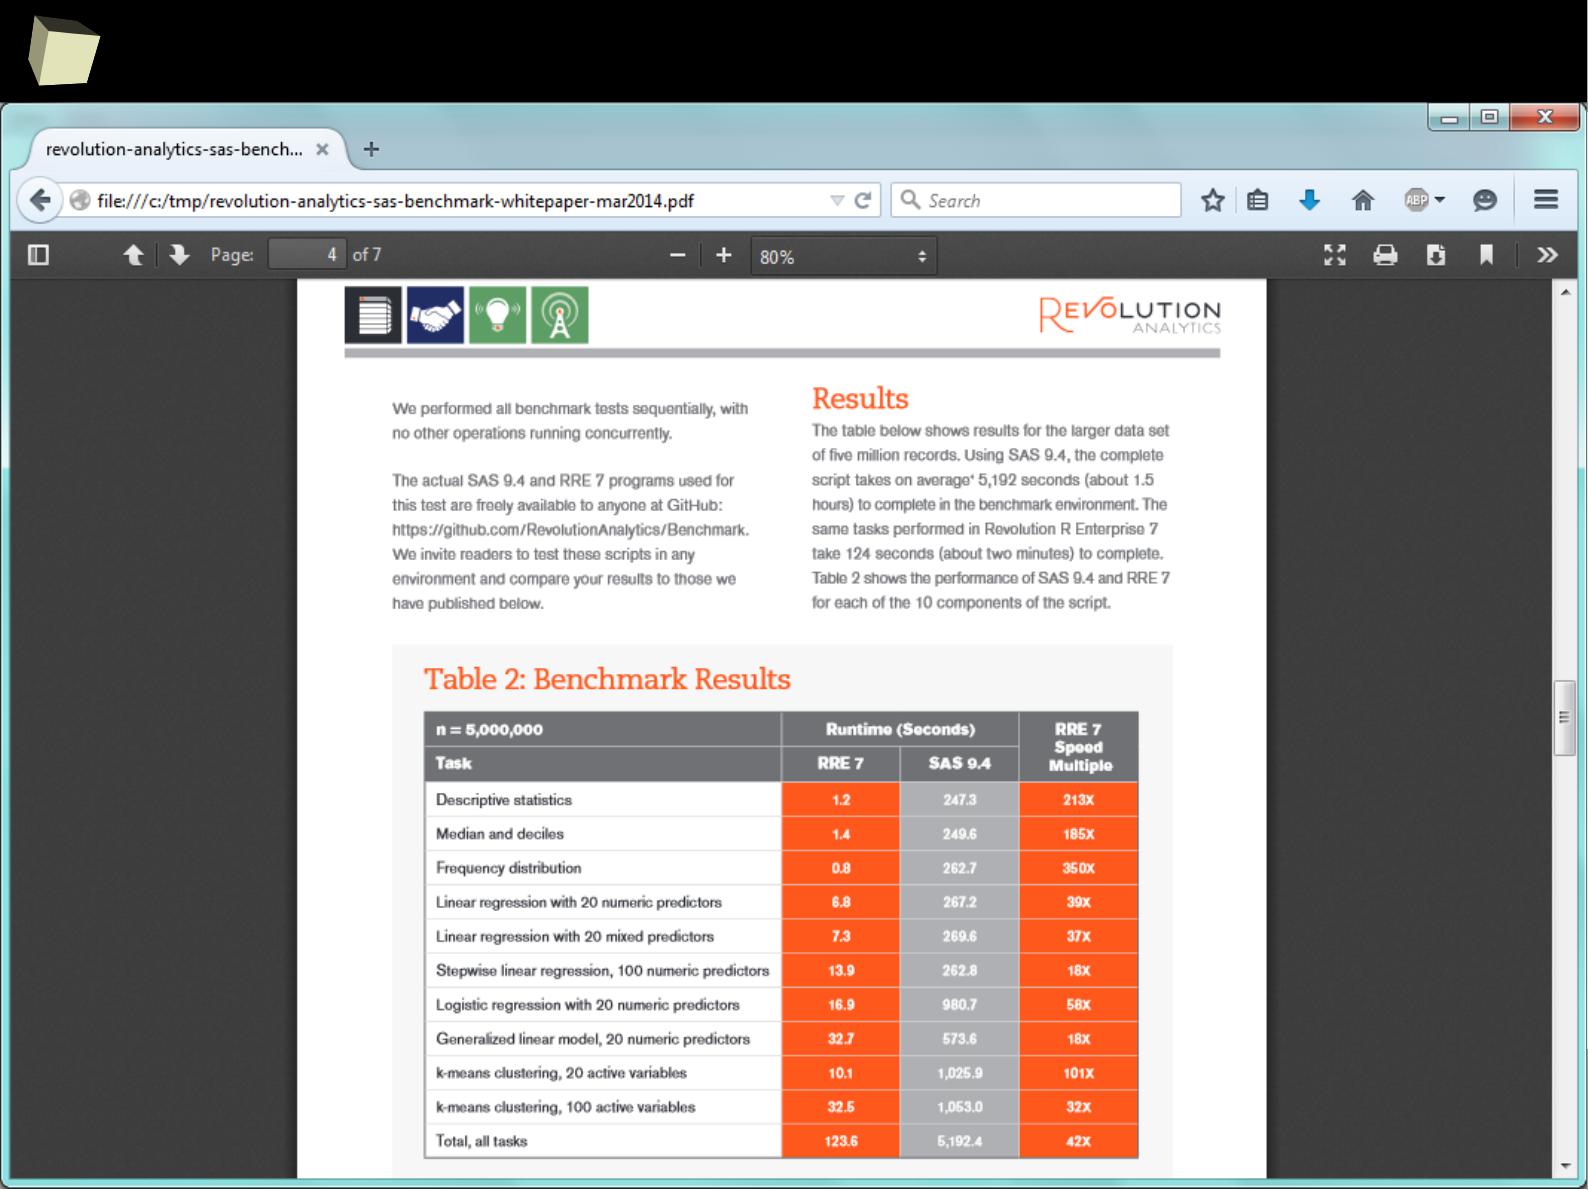
R feat. SAS
1
3
7
R feat. SAS
calling SAS
in batch
mode
reading
created CSV
1
3
8
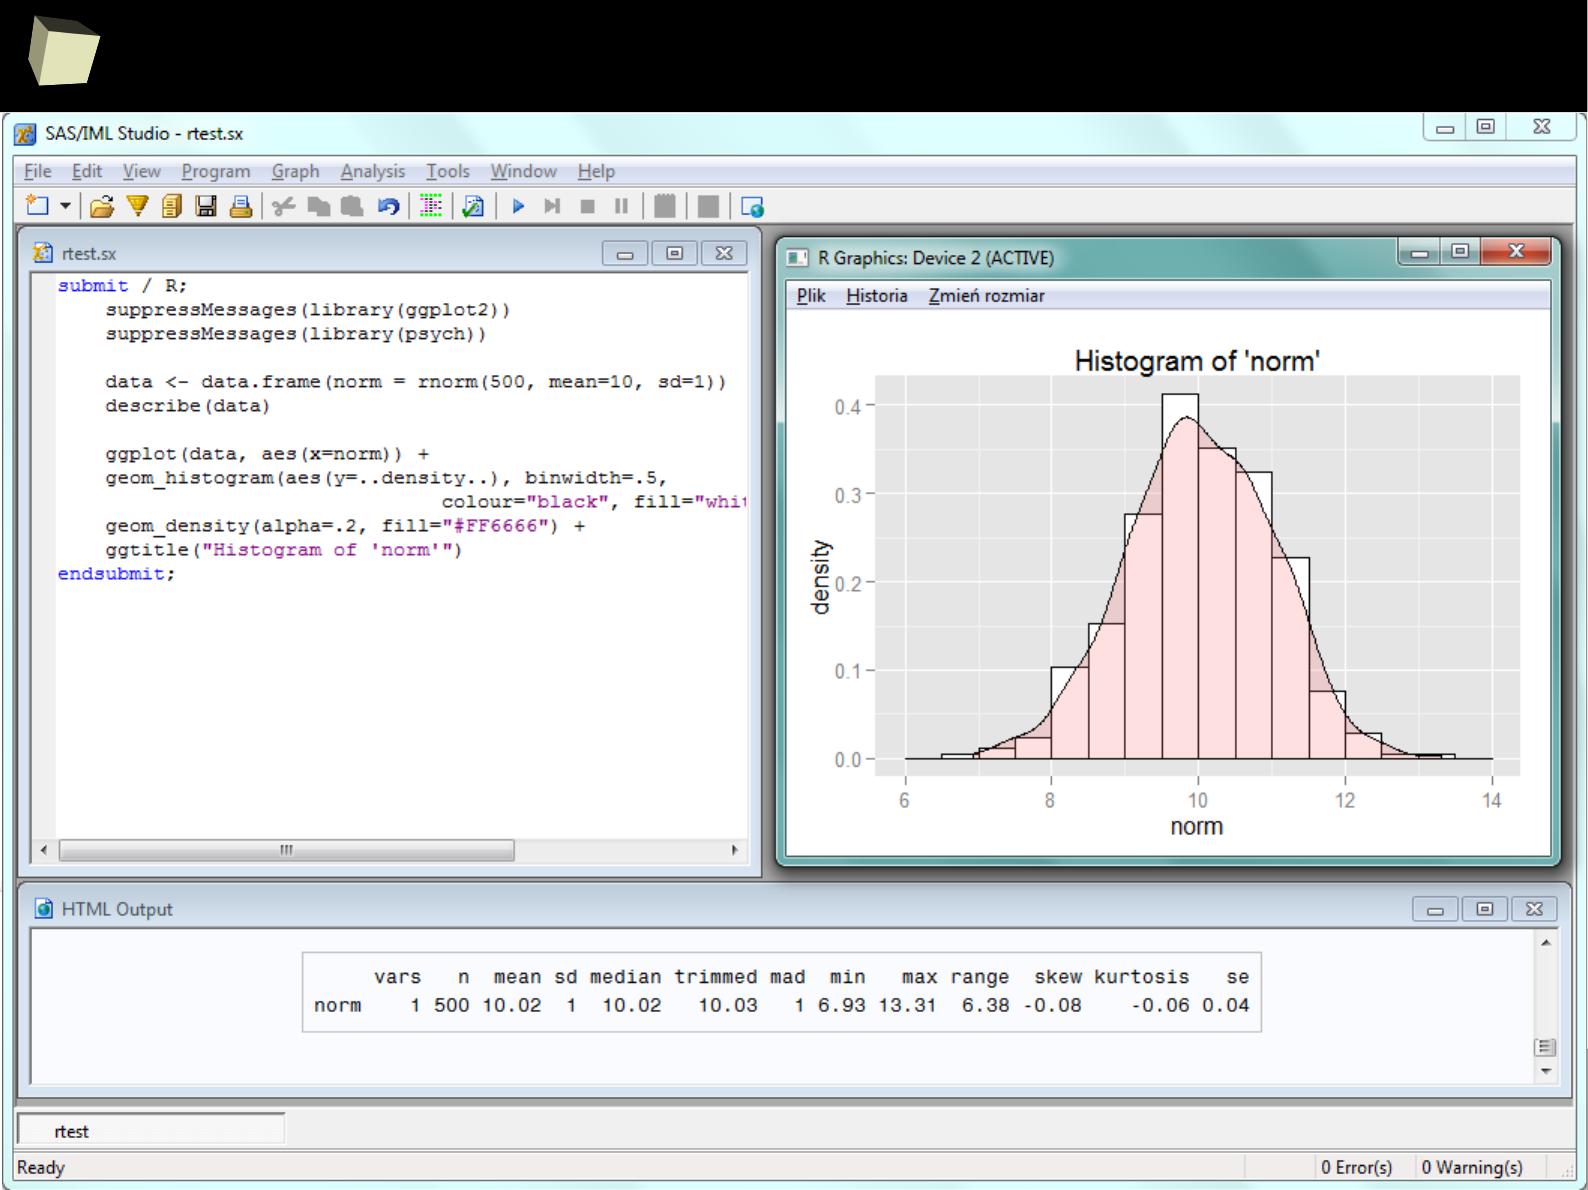
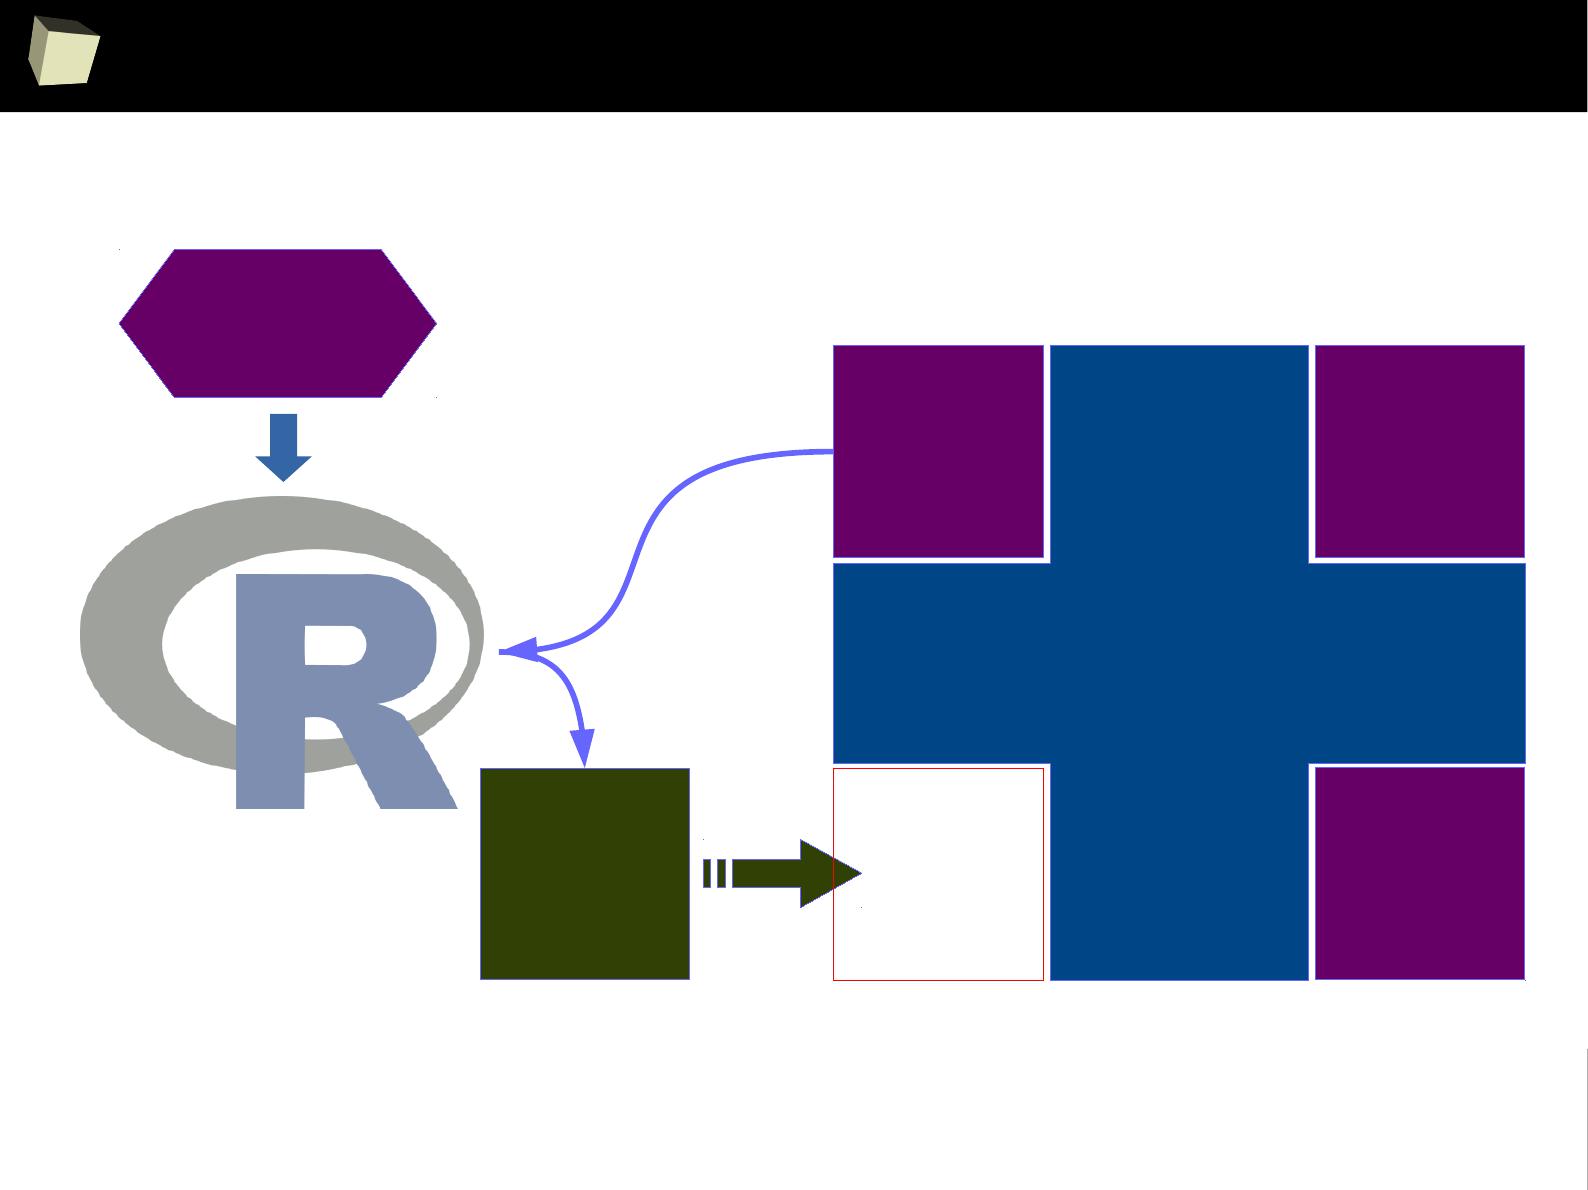
Enhance SAS with R via IML
SAS BASE
SAS BASE
SAS
SAS
IML
IML
SAS
SAS
module
module
#1
#1
SAS
SAS
module
module
#2
#2
Missing
Missing
functio-
functio-
nality
nality
Call R
Call R
from
from
SAS
SAS
/via IML/
/via IML/
Required
Required
algorithm or
algorithm or
functionality
functionality
bidirectional
data
exchange
1
3
9
SAS – R companion
A set of factors makes the cooperation between SAS and R easier:
●
Package sas7bdat enables R reading SAS SAS7BDAT datasets without
having SAS installed
●
Package SASxport enables R both reading and writing SAS Transport files
(XPT) without having SAS installed.
It is removed from CRAN yet still available in the CRAN Archive.
●
Package foreign is another option for exchanging data with SAS
●
For several statistical methods SAS-compliant variants are created:
●
Contrast: contr.SAS
●
Quantiles: type 3 → nearest even order statistic
●
Type-III Sum of Square is available in R
●
Both SAS and R share the same numbers rounding algorithm
●
Both R and SAS can call each other in batch mode from a command line
●
R can also be accessed conveniently from SAS via IML module
●
With certain packages both SAS "logs" and "listings" can be imitated.
1
4
1
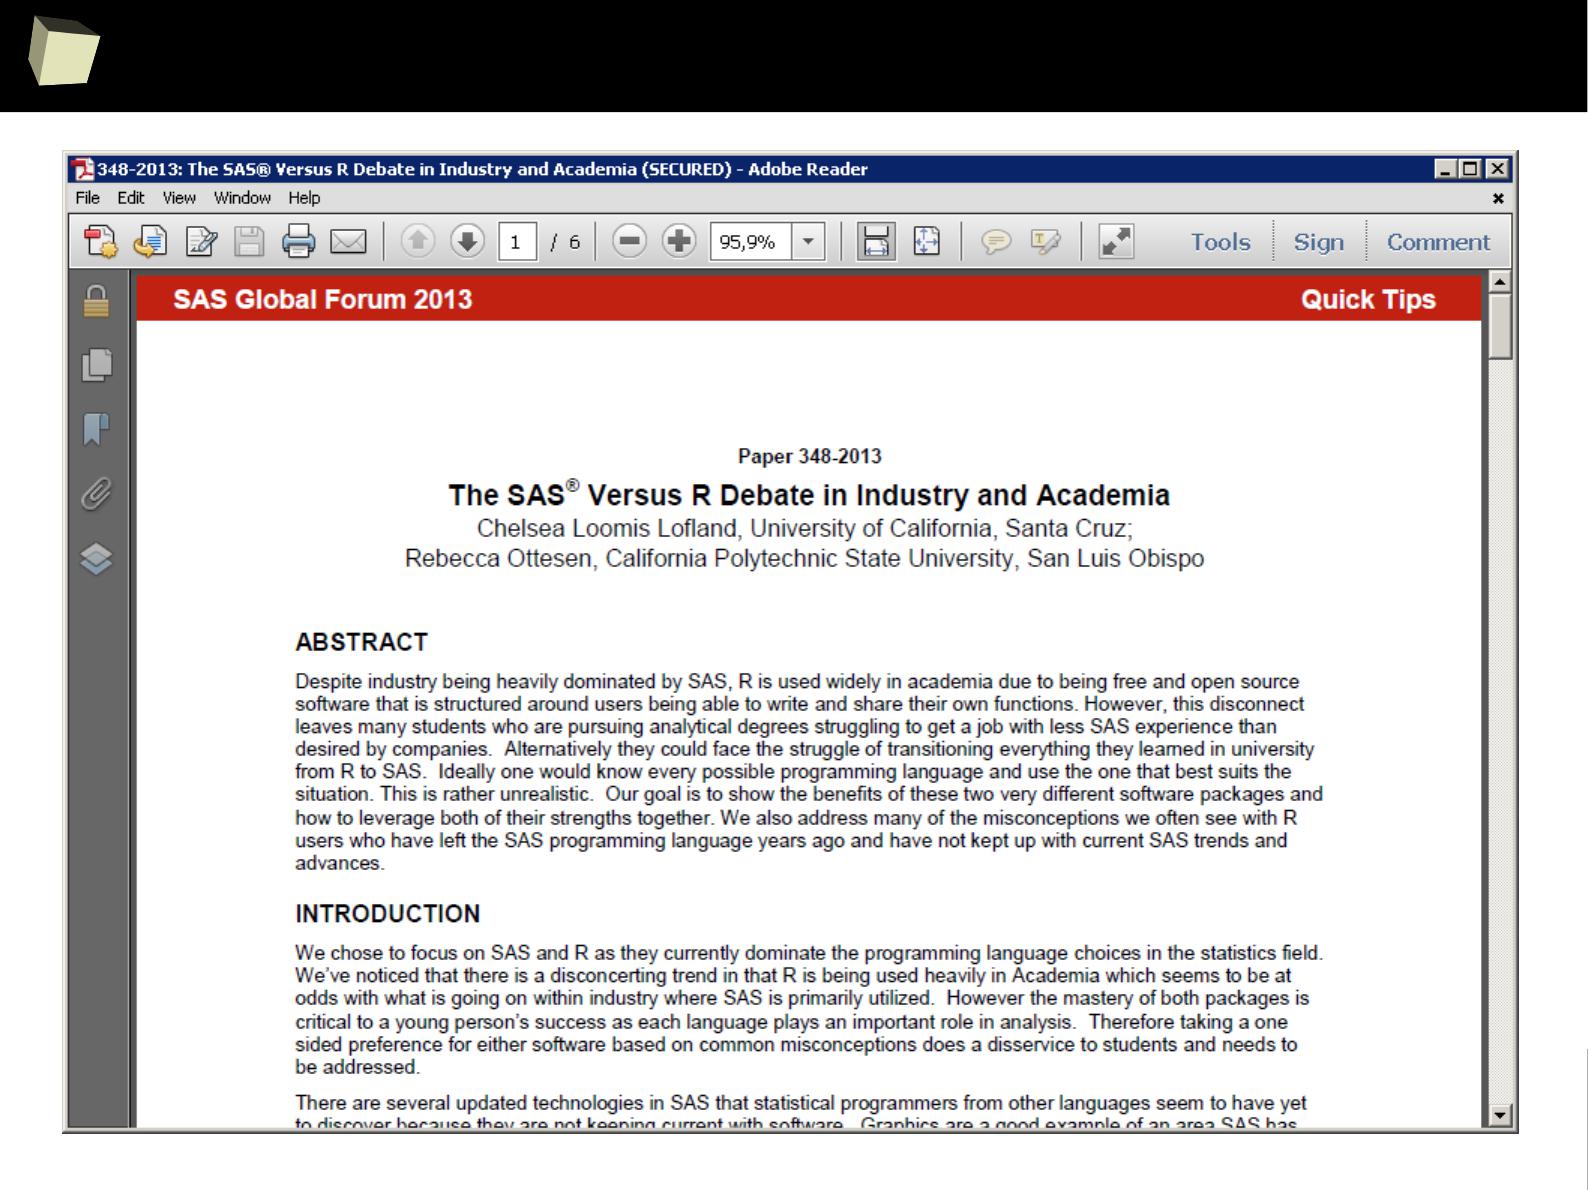
Let's MoRtal Kombat begin!
1
4
2
Let's MoRtal Kombat begin!
1
4
3
Let's MoRtal Kombat begin!

1
4
4
13 reasons why you will love GNU R
I R is (extremely) cheap. In fact - it's free :)
II R has (extremely) wide range of capabilities
III R is (widely) supported by the world of science
IV R is supported by the community
V R is (increasingly) supported by the business
VI R is able to read data in many formats
VII Interoperability is easy to achieve
VIII R is truly cross-platform
IX R offers numerous ways of presenting data
X There are many options to optimize the code
XI R is able to handle large amount of data
XII R has a set of fancy tools and IDEs
XII FDA accepted using R for drug trials!
1
4
5
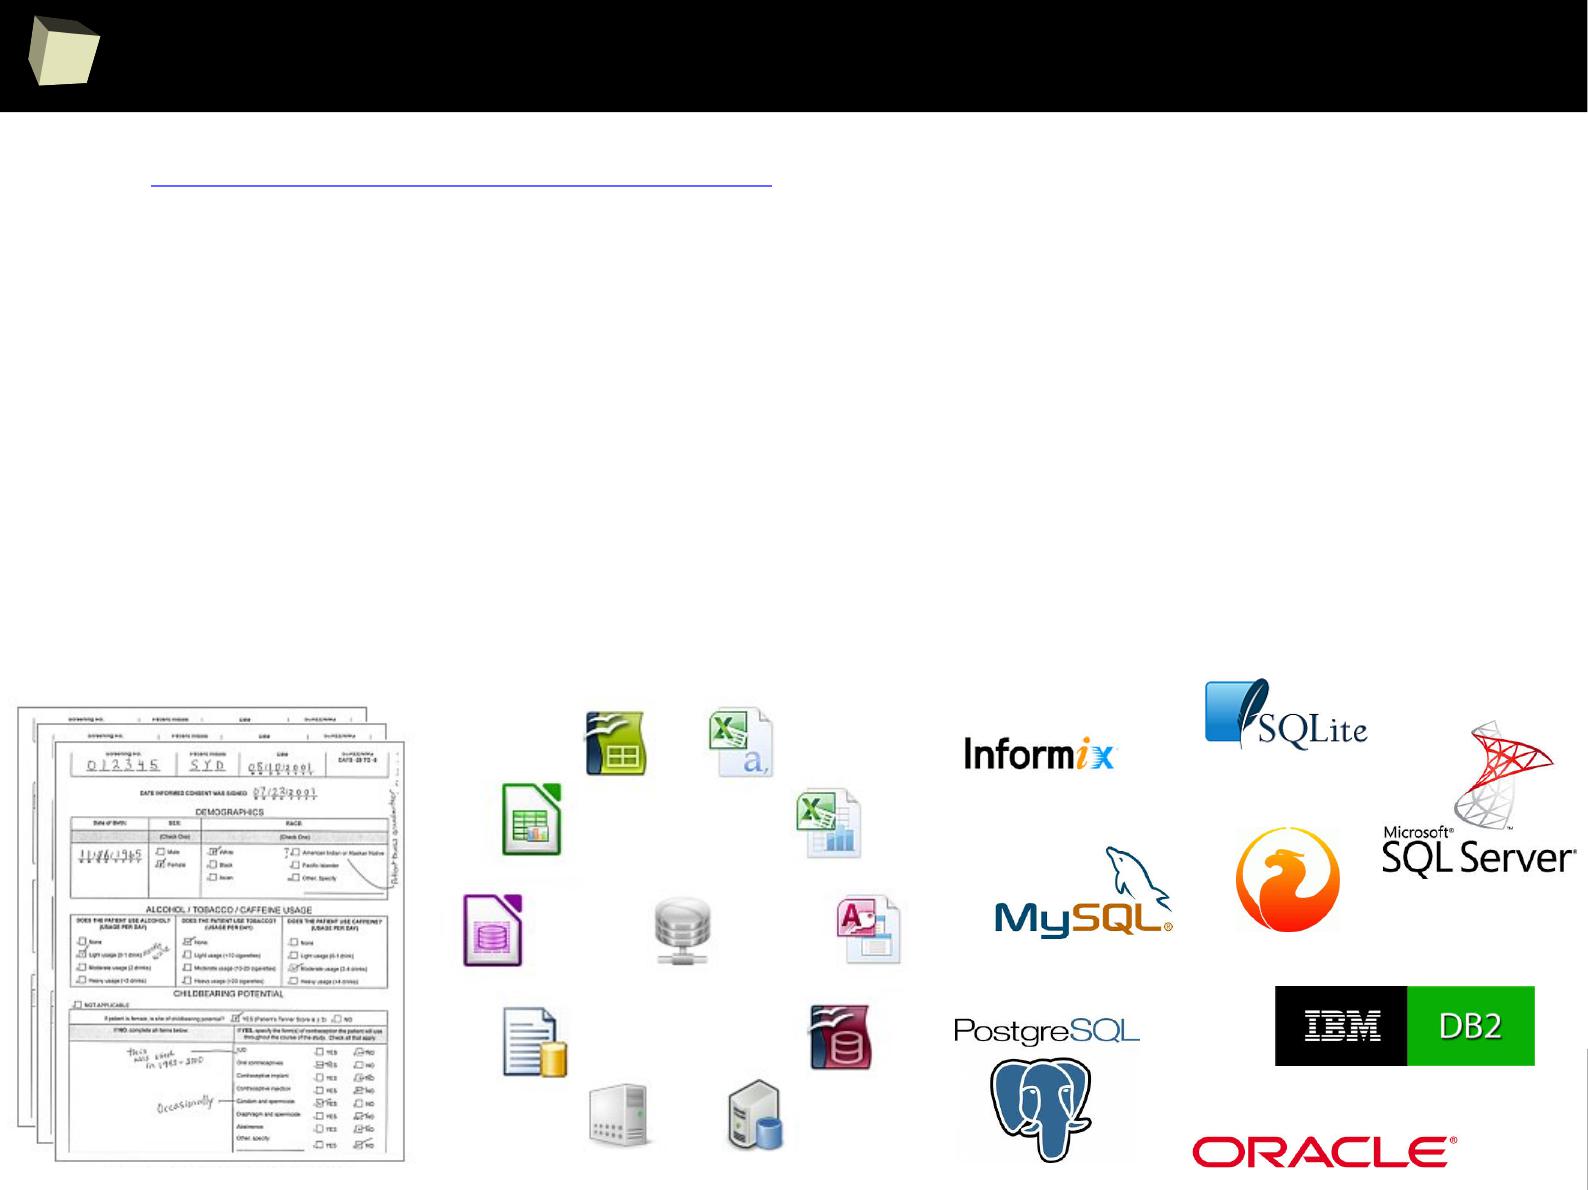
Does R speak XYZ ?
R is able to read data in many formats: MS Excel, OpenOffice Calc, Gnumeric,
DICOM, SPSS, Weka, Systat, Stata, EpiInfo, SAS datasets, SAS Transport, Systat,
Minitab, Octave, Matlab, DBF (dBase, FoxPro), CSV/TSV, XML, HTML, JSON and...
One can access data stored in various databases via native drivers (MySQL,
PostgreSQL, SQLite, MS Access) as well as ODBC and JDBC interfaces. This gives
easy access to any database for which appropriate drivers are available: Oracle,
SQL Server, MySQL, dBase, PostgreSQL, SQLite, DB/2, Informix, Firebird, etc.

1
4
6
Does R speak XYZ ?
> read.csv("c:/tmp/data.csv", header=TRUE, sep=";")
Column.1 Column.2 Column.3
1 1 First 2011-01-03
2 2 Second 2011-01-04
3 3 Third 2011-01-05
4 4 Fourth 2011-01-06
5 5 Fifth 2011-01-07
> sqldf::read.csv.sql("c:/tmp/data.csv", sql="SELECT * FROM file f WHERE f.`Column.1` BETWEEN 2 AND 3", sep=";")
Column.1 Column.2 Column.3
1 2 Second 2011-01-04
2 3 Third 2011-01-05
> openxlsx::read.xlsx("c:/tmp/data.xlsx", sheet=1, colNames=TRUE, detectDates = TRUE)
Column.1 Column.2 Column.3
1 1 First 2011-01-03
2 2 Second 2011-01-04
3 3 Third 2011-01-05
4 4 Fourth 2011-01-06
5 5 Fifth 2011-01-07
> data <- read.ods("c:/tmp/data.ods", sheet=1)
> colnames(data) <- data[1, ]
> data[-1, ]
Column 1 Column 2 Column 3
2 1 First 2011-01-03
3 2 Second 2011-01-04
4 3 Third 2011-01-05
5 4 Fourth 2011-01-06
6 5 Fifth 2011-01-0
CSV
CSV
SQL
Excel
Calc
1
4
7
Does R speak XYZ ?
> read.xport("c:/tmp/data.xpt")
COLUMN1 COLUMN2 COLUMN3
1 1 First 2011-01-03
2 2 Second 2011-01-04
3 3 Third 2011-01-05
4 4 Fourth 2011-01-06
5 5 Fifth 2011-01-07
> data=read.sas7bdat("c:/tmp/data.sas7bdat")
> data$COLUMN4 <- as.Date(data$COLUMN3, origin = "1960-01-01")
> data
COLUMN1 COLUMN2 COLUMN3
1 1 First 2011-01-03
2 2 Second 2011-01-04
3 3 Third 2011-01-05
4 4 Fourth 2011-01-06
5 5 Fifth 2011-01-07
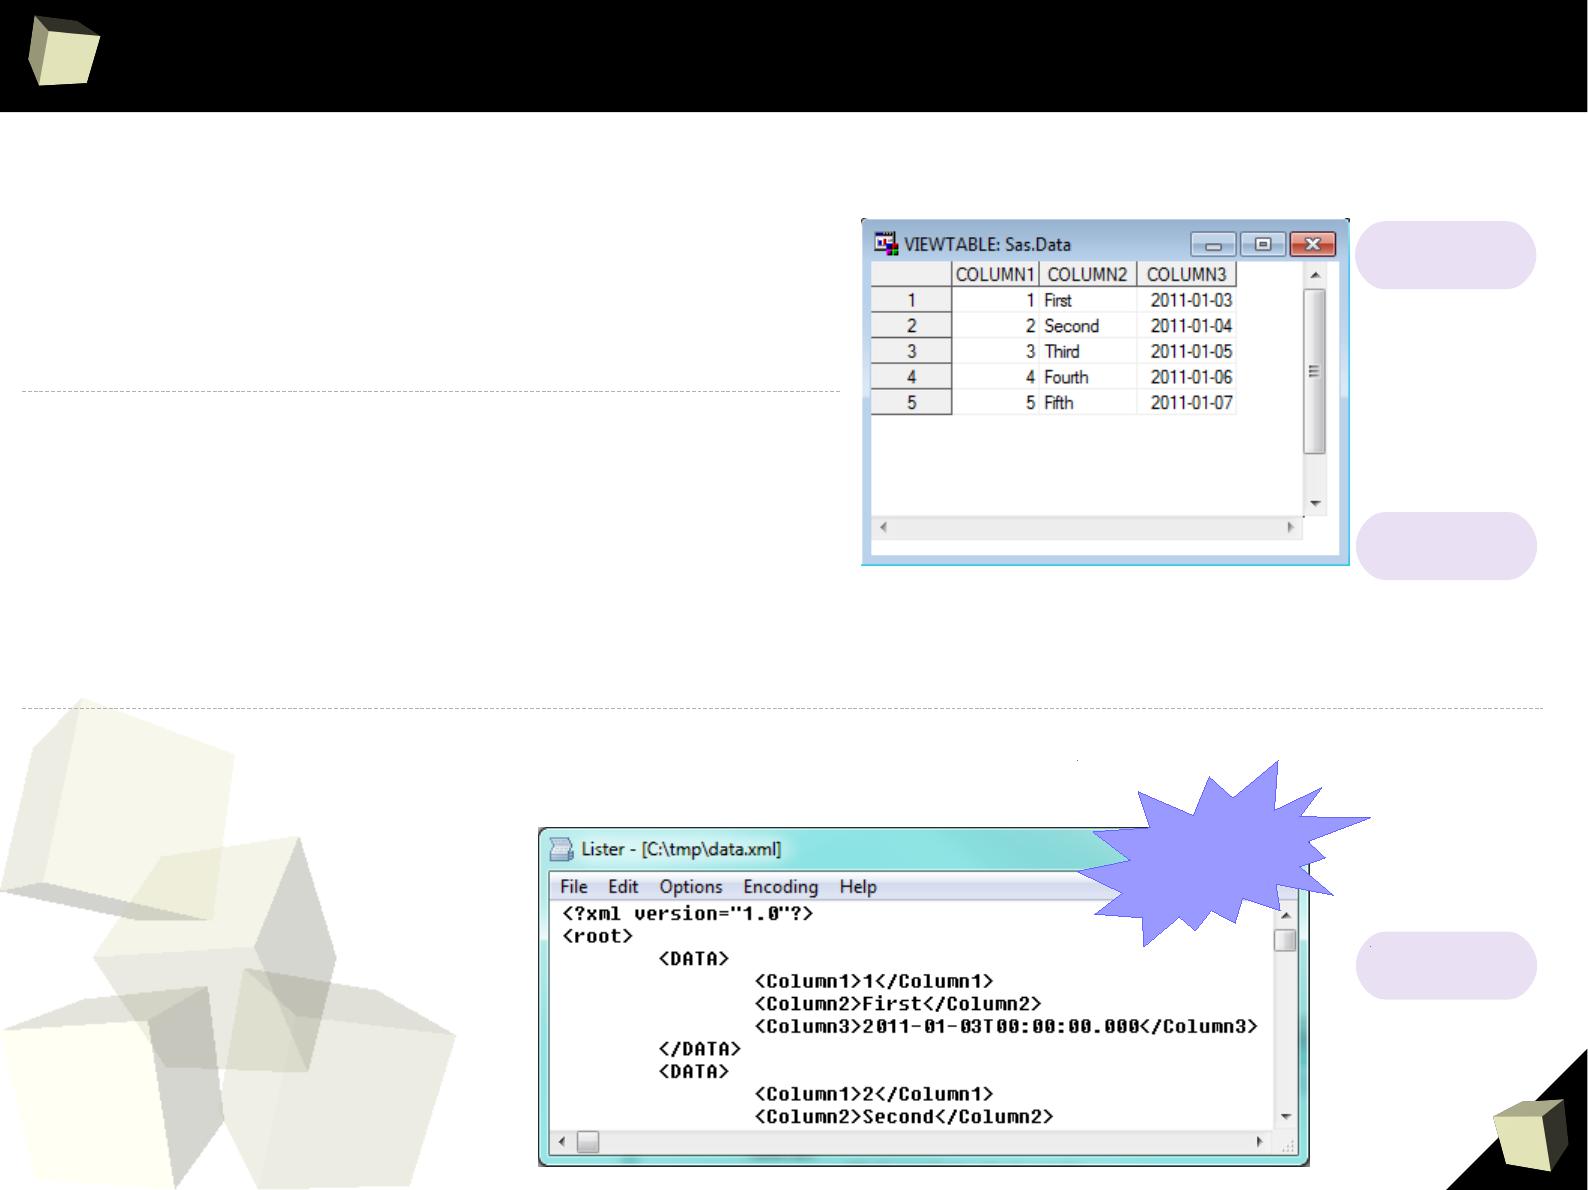
> xml <- xmlParse("c:/tmp/data.xml")
> xmlToDataFrame(xml, homogeneous = TRUE, collectNames = TRUE, colClasses = c("integer", "character", "character"))
> data$Column3 <- as.Date(data$Column3)
> data
Column1 Column2 Column3
1 1 First 2011-01-03
2 2 Second 2011-01-04
3 3 Third 2011-01-05
4 4 Fourth 2011-06-03
5 5 Fifth 2011-01-07
XML
SAS
Transport
SAS 7
XPATH,
DTD & XSD
supported
1
4
8
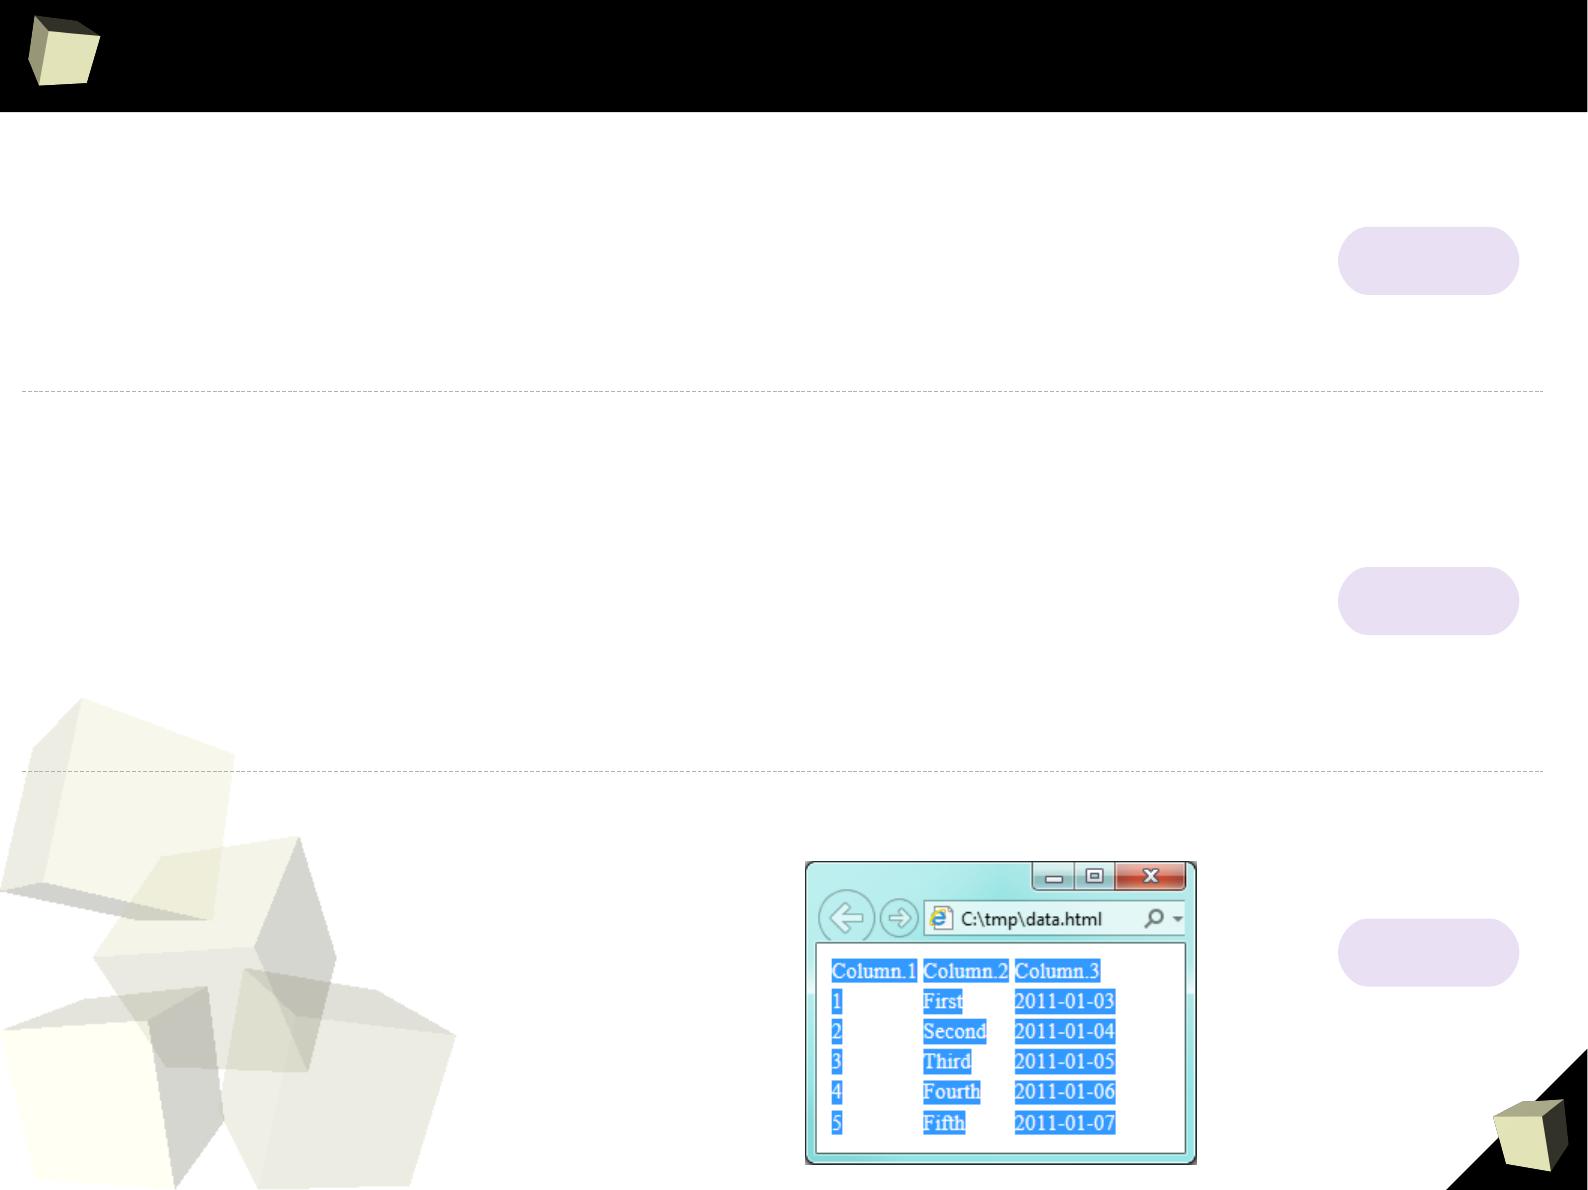
Does R speak XYZ ?
> readHTMLTable("c:/tmp/data.html", header =T, which = 1)
Column 1 Column 2 Column 3
1 1 first 2011-01-03
2 2 second 2011-01-04
3 3 third 2011-01-05
4 4 fourth 2011-01-06
5 5 fifth 2011-01-07
> json
[1] "{\"Column 1\":[\"1\",\"2\",\"3\",\"4\",\"5\"],\"Column 2\":
[\"First\",\"Second\",\"Third\",\"Fourth\",\"Fifth\"],\"Column 3\":[\"2011-01-03\",\"2011-01-04\",\"2011-01-05\",\"2011-01-
06\",\"2011-01-07\"]}"
> as.data.frame(fromJSON(json))
Column.1 Column.2 Column.3
1 1 First 2011-01-03
2 2 Second 2011-01-04
3 3 Third 2011-01-05
4 4 Fourth 2011-01-06
5 5 Fifth 2011-01-07
> read.table(file = "clipboard", sep = " ", header=TRUE) (# with some artefacts)
Column.1 Column.2 Column.3 X
1 1 First 2011-01-03 NA
2 2 Second 2011-01-04 NA
3 3 Third 2011-01-05 NA
4 4 Fourth 2011-01-06 NA
5 5 Fifth 2011-01-07 NA
HTML
JSON
Clipboard


1
5
0
13 reasons why you will love GNU R
I R is (extremely) cheap. In fact - it's free :)
II R has (extremely) wide range of capabilities
III R is (widely) supported by the world of science
IV R is supported by the community
V R is (increasingly) supported by the business
VI 1/3 :) R and relational databases
VII Interoperability is easy to achieve
VIII R is truly cross-platform
IX R offers numerous ways of presenting data
X There are many options to optimize the code
XI R is able to handle large amount of data
XII R has a set of fancy tools and IDEs
XII FDA accepted using R for drug trials!
1
5
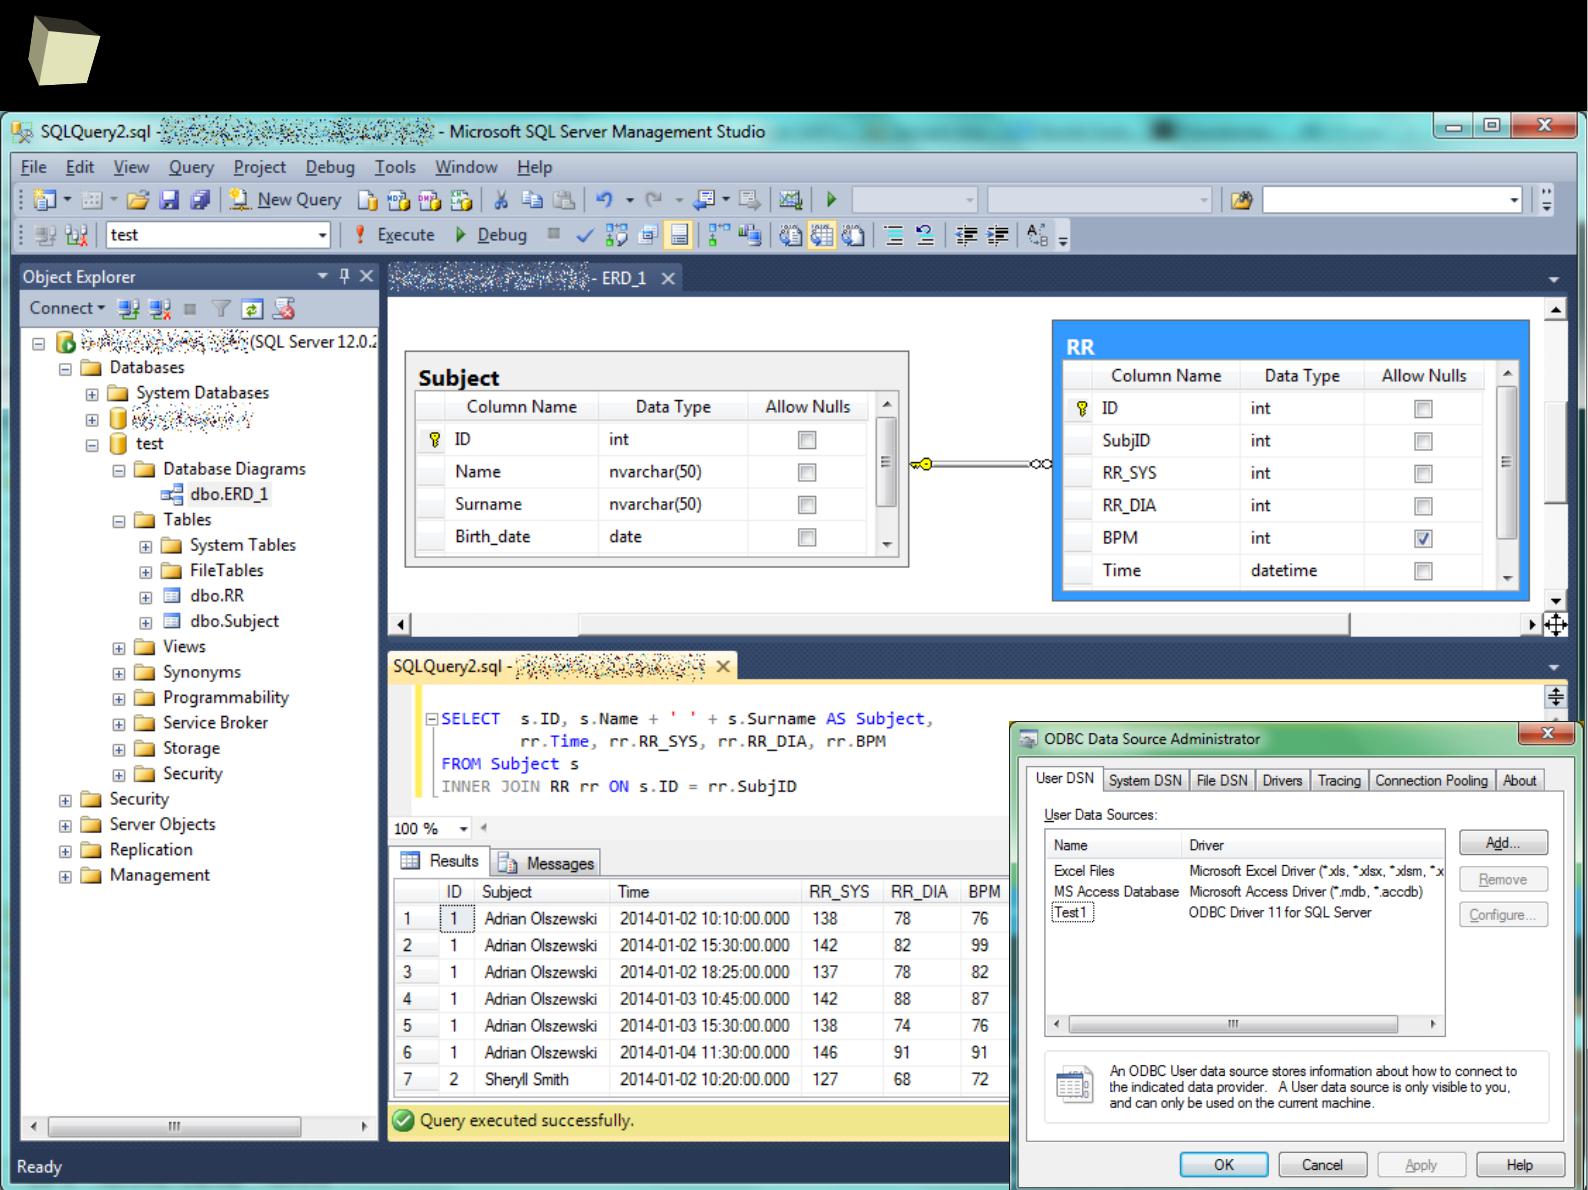
1
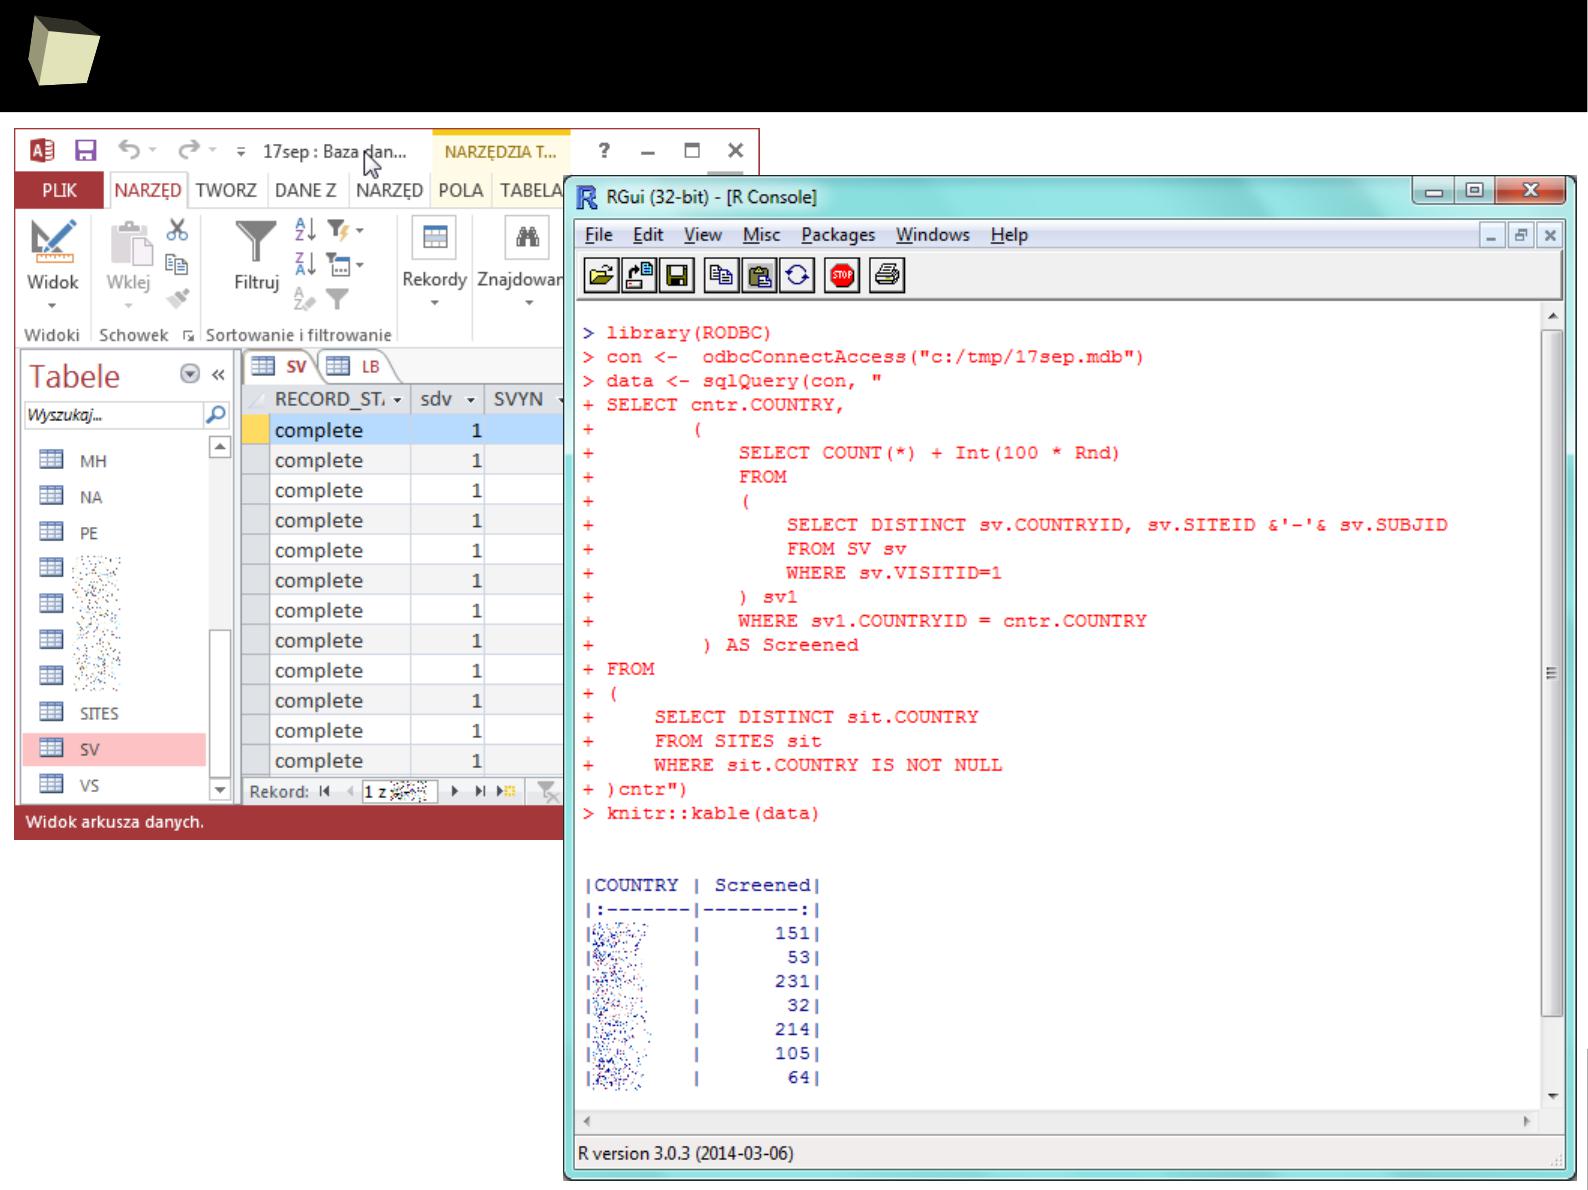
The R and SQL companion
1
5
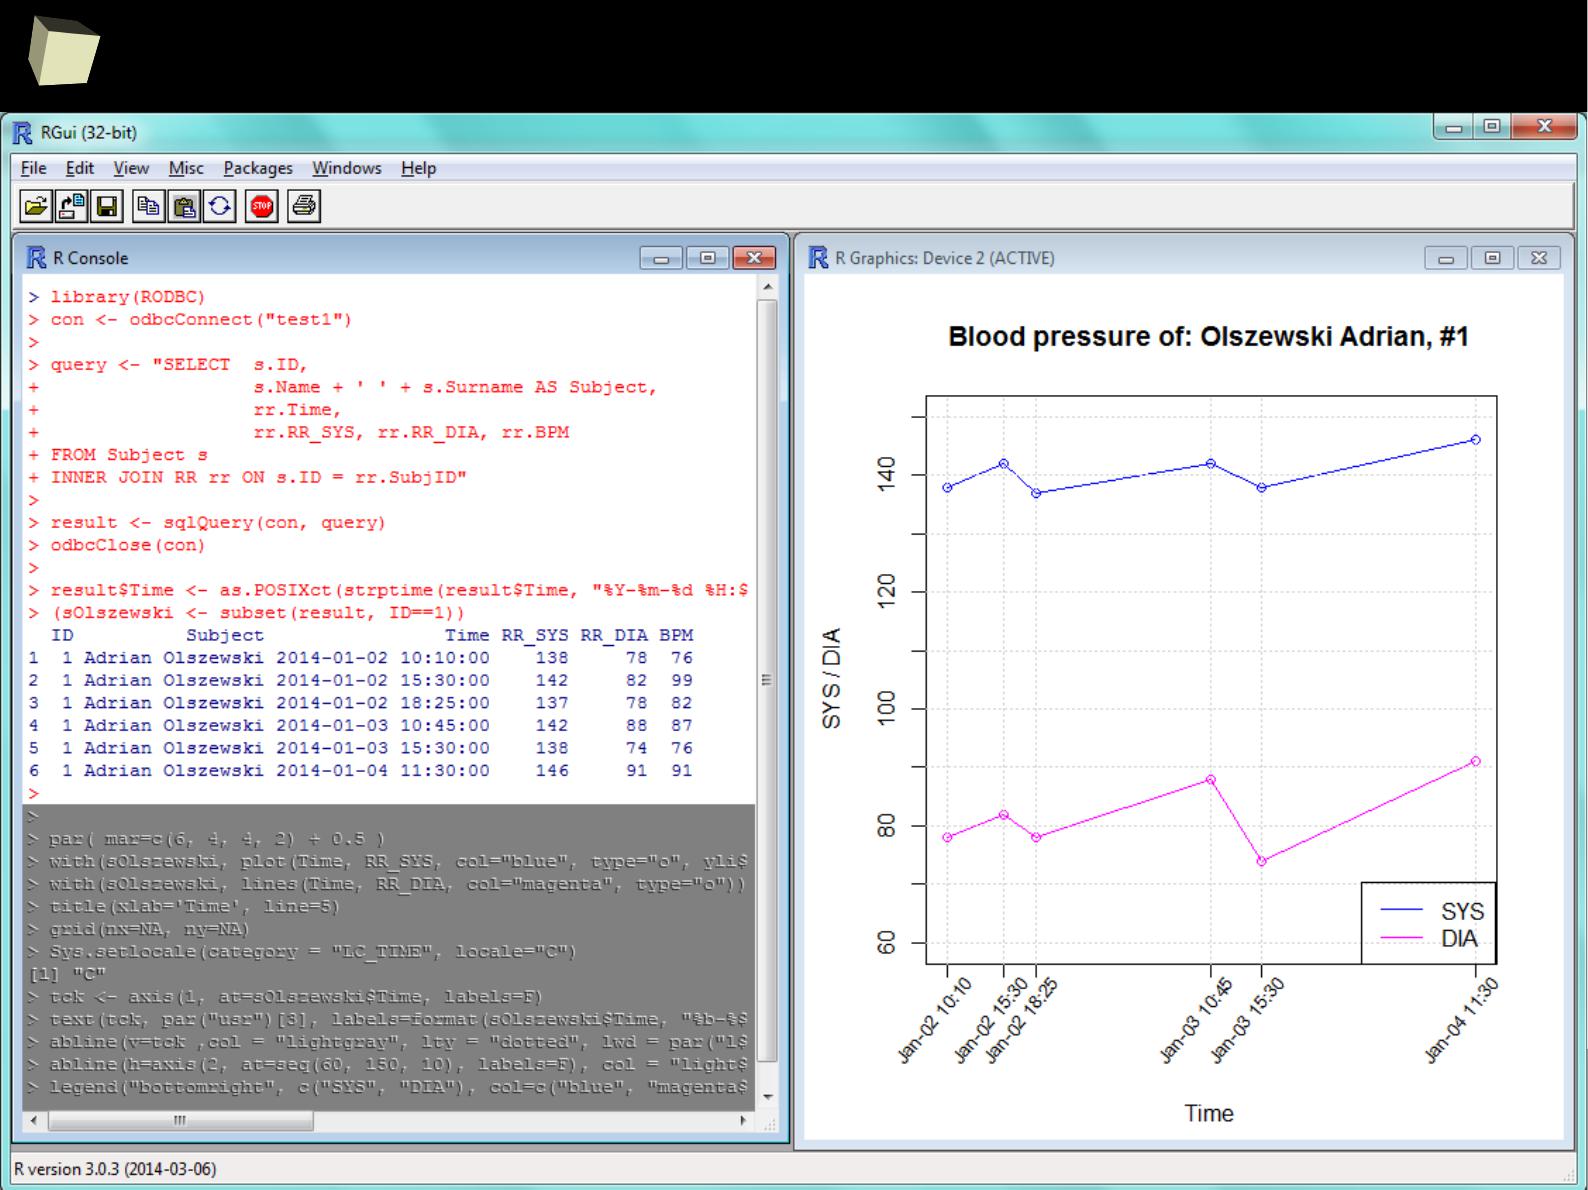
2
Querying data sources via ODBC ...
1
5
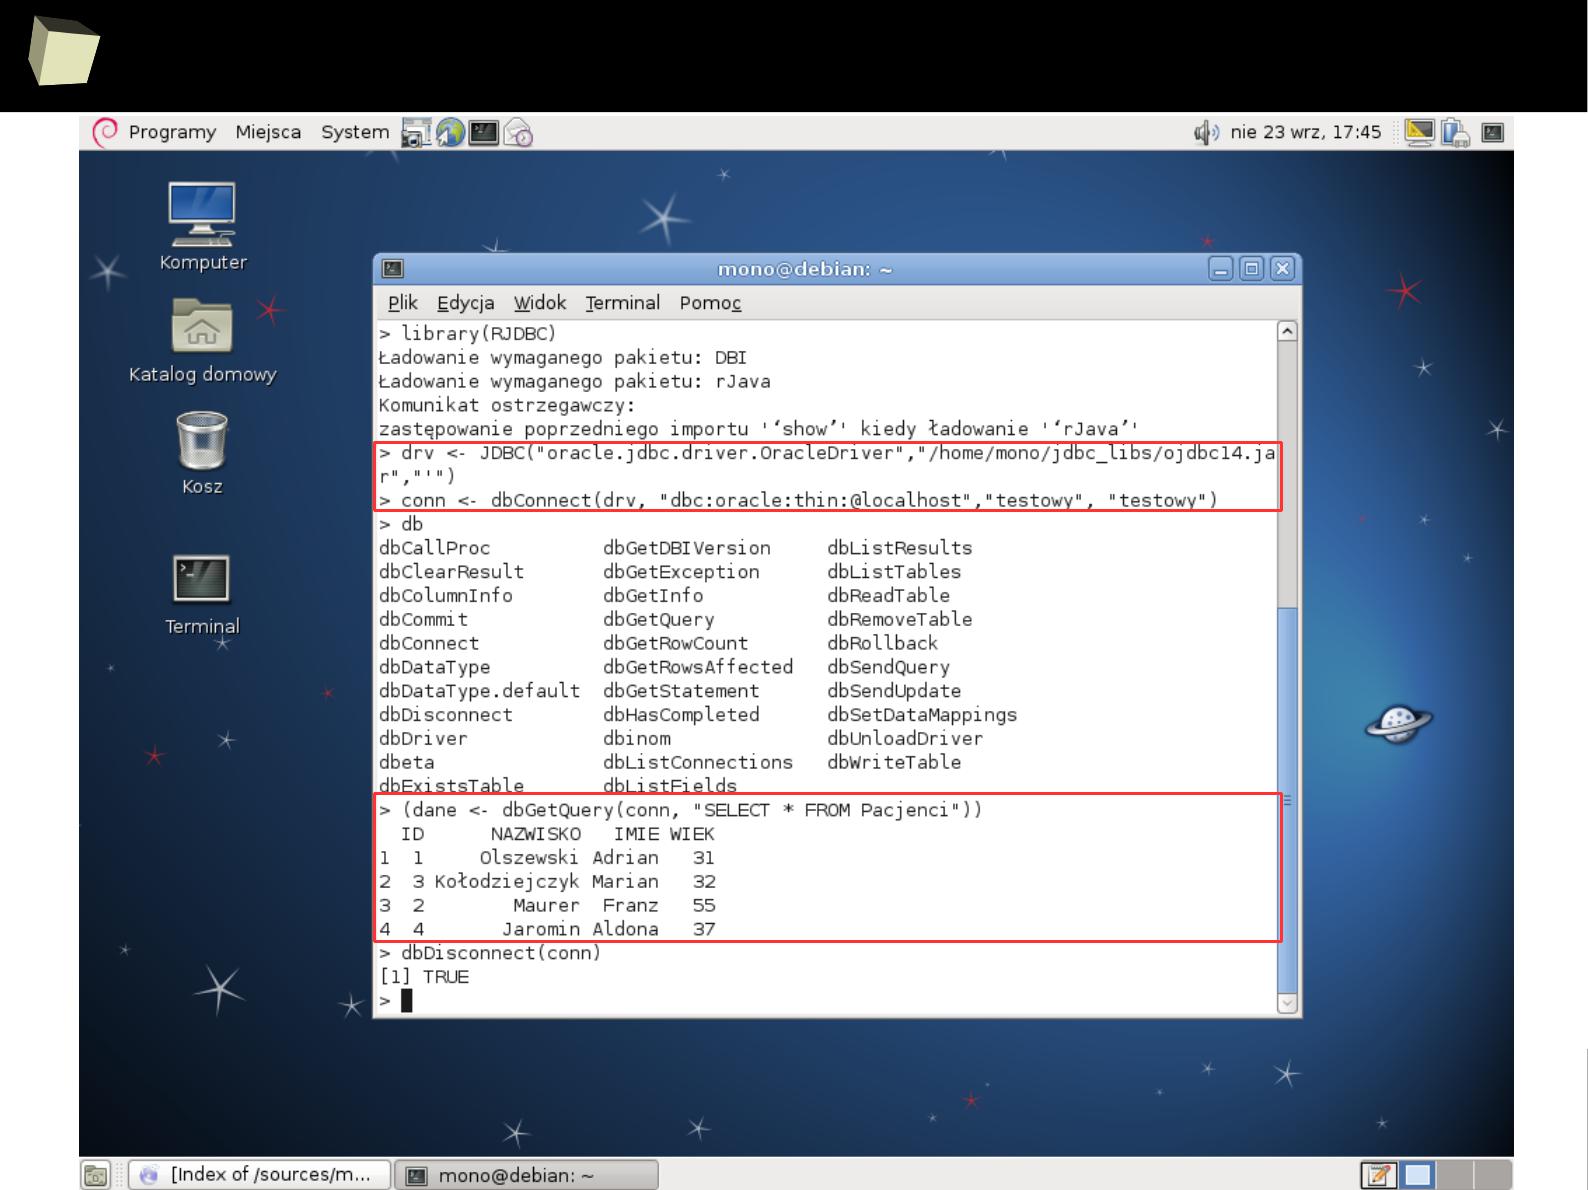
3
… or JDBC ...
1
5
4
… or diRect ...
1
5
6
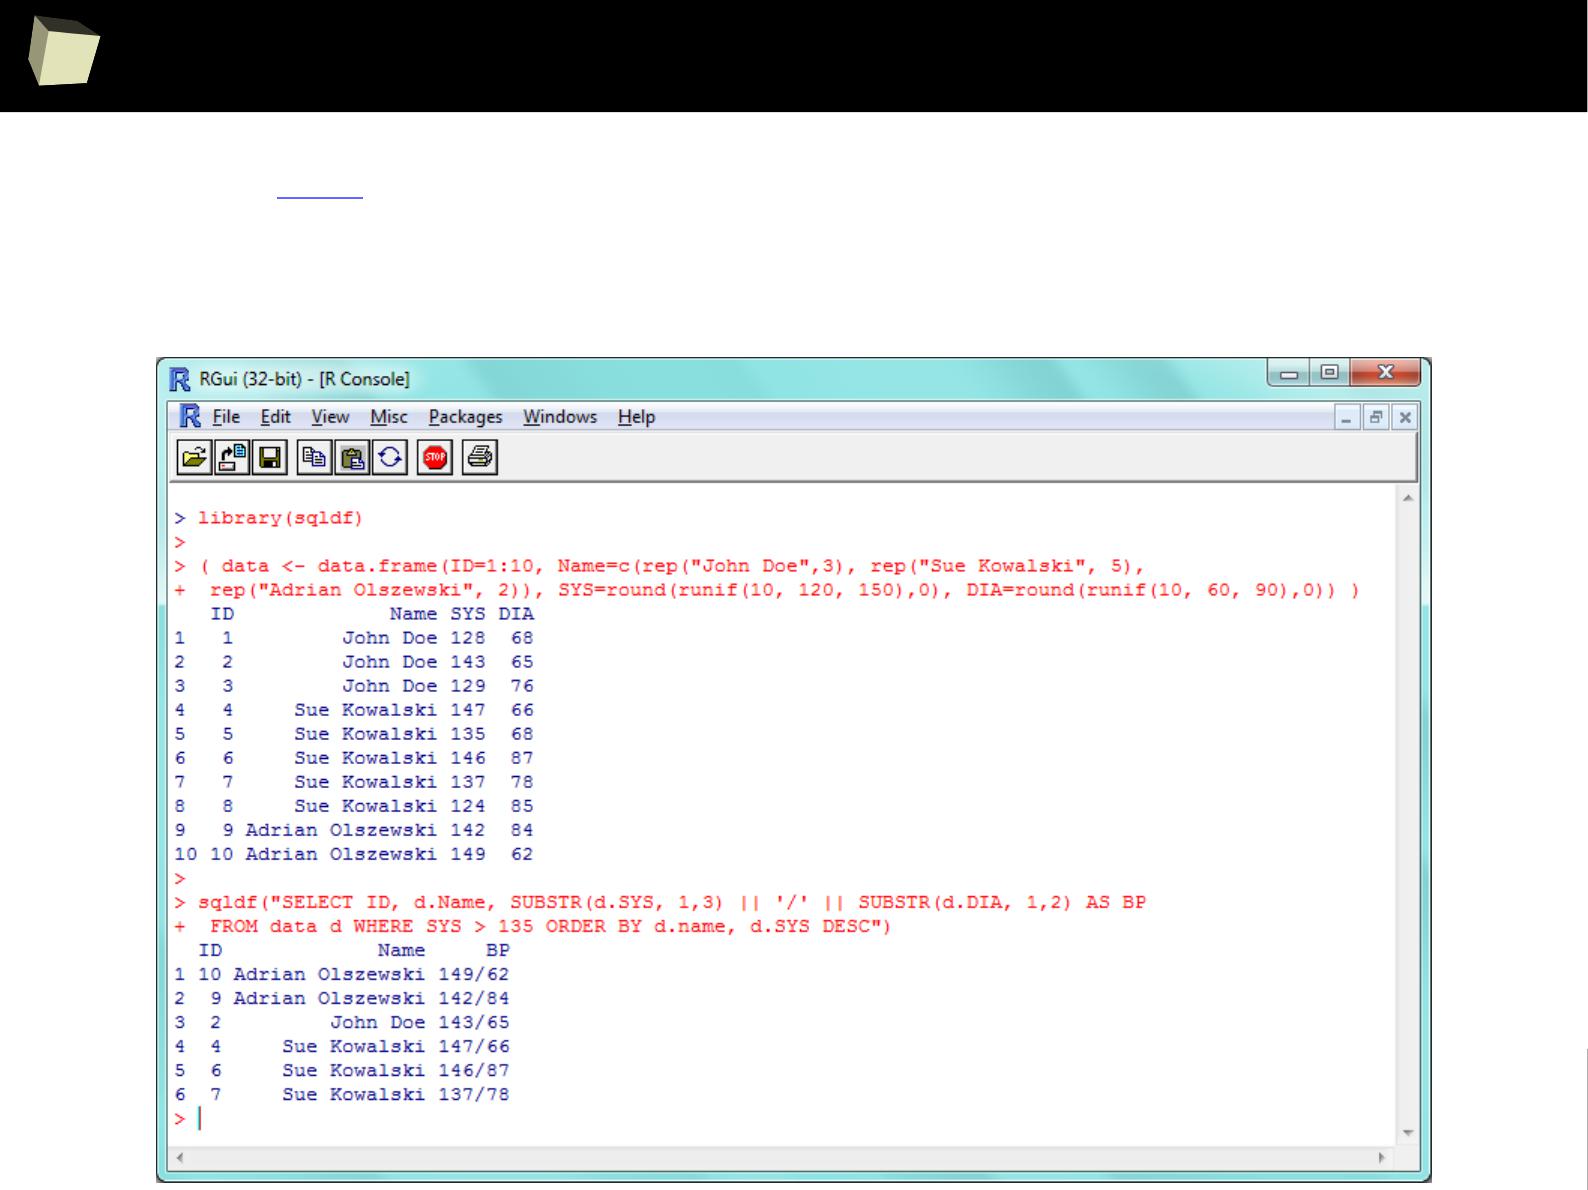
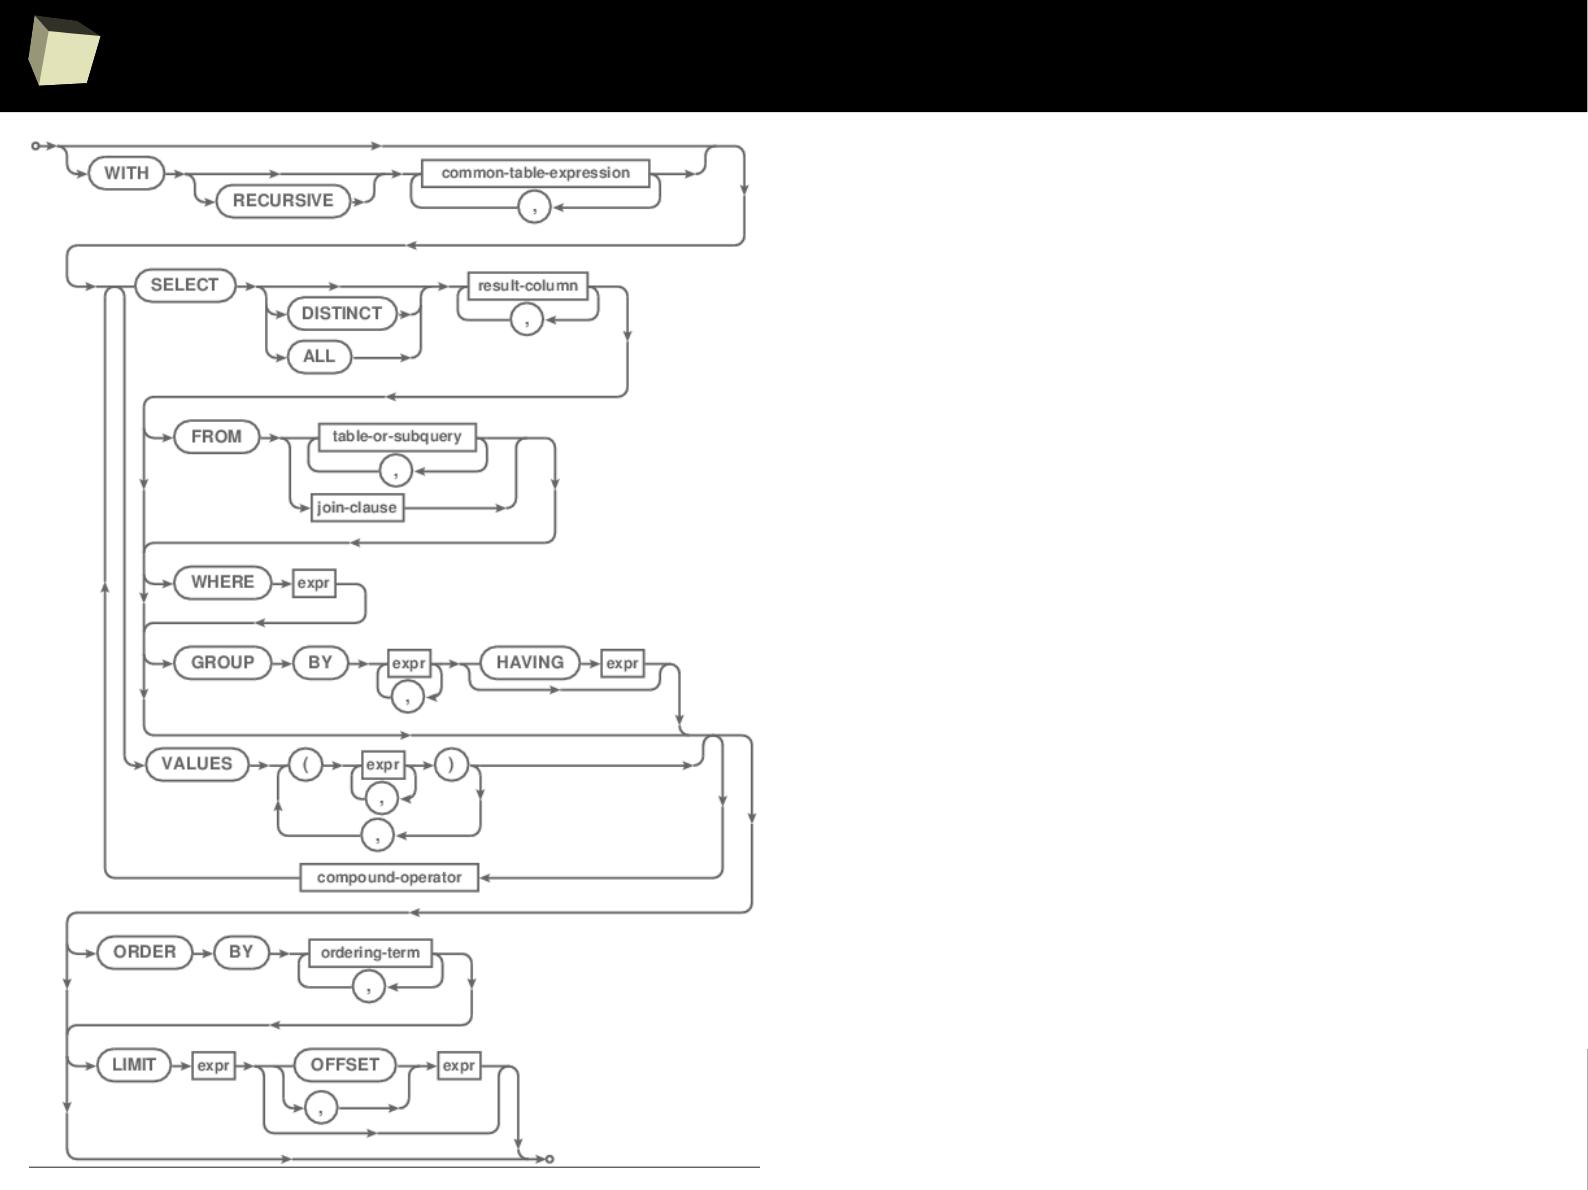
sqldf – a full blown SQL at your fingertips!
✔
Write any complex SQL queries
using your favourite syntax and engine
✔
Use complex sub-queries in:
✔
SELECT
✔
FROM / JOIN
✔
WHERE
✔
Nest up to 255 levels of sub-queries
✔
Use lots of engine-specific functions
✔
Limit results with LIMIT / OFFSET
✔
Query R data frames with spaces
and dots in column names
✔
… and much more!
1
5
7
Do I really need SQL for querying data.frames?
> attach(mydata)
> fit <- aov(y~A*B)
> summary(fit)
> layout(matrix(c(1:4), 2))
> plot(fit)
> TukeyHSD(fit)
> interaction.plot(A, B, y)
Why would one bother using SQL when R is capable itself of sub-setting
(filtering) data.frames, merging them, ordering, summarizing in sub-
groups and reshaping? There are various packages that make it easy!
SELECT Grp, Sex, COUNT(*)
FROM Table1 t1
INNER JOIN Table2 t2
ON t1.ID=t2.ID
WHERE t1.Age >=
(SELECT AVG(t.Age)
FROM Table1 t
WHERE t.ID=t1.ID)
GROUP BY Grp, Sex
HAVING COUNT(*) > 1
R is perfect for analysing data
SQL is ideal for querying data
Let everyone do what he does best!

1
5
8
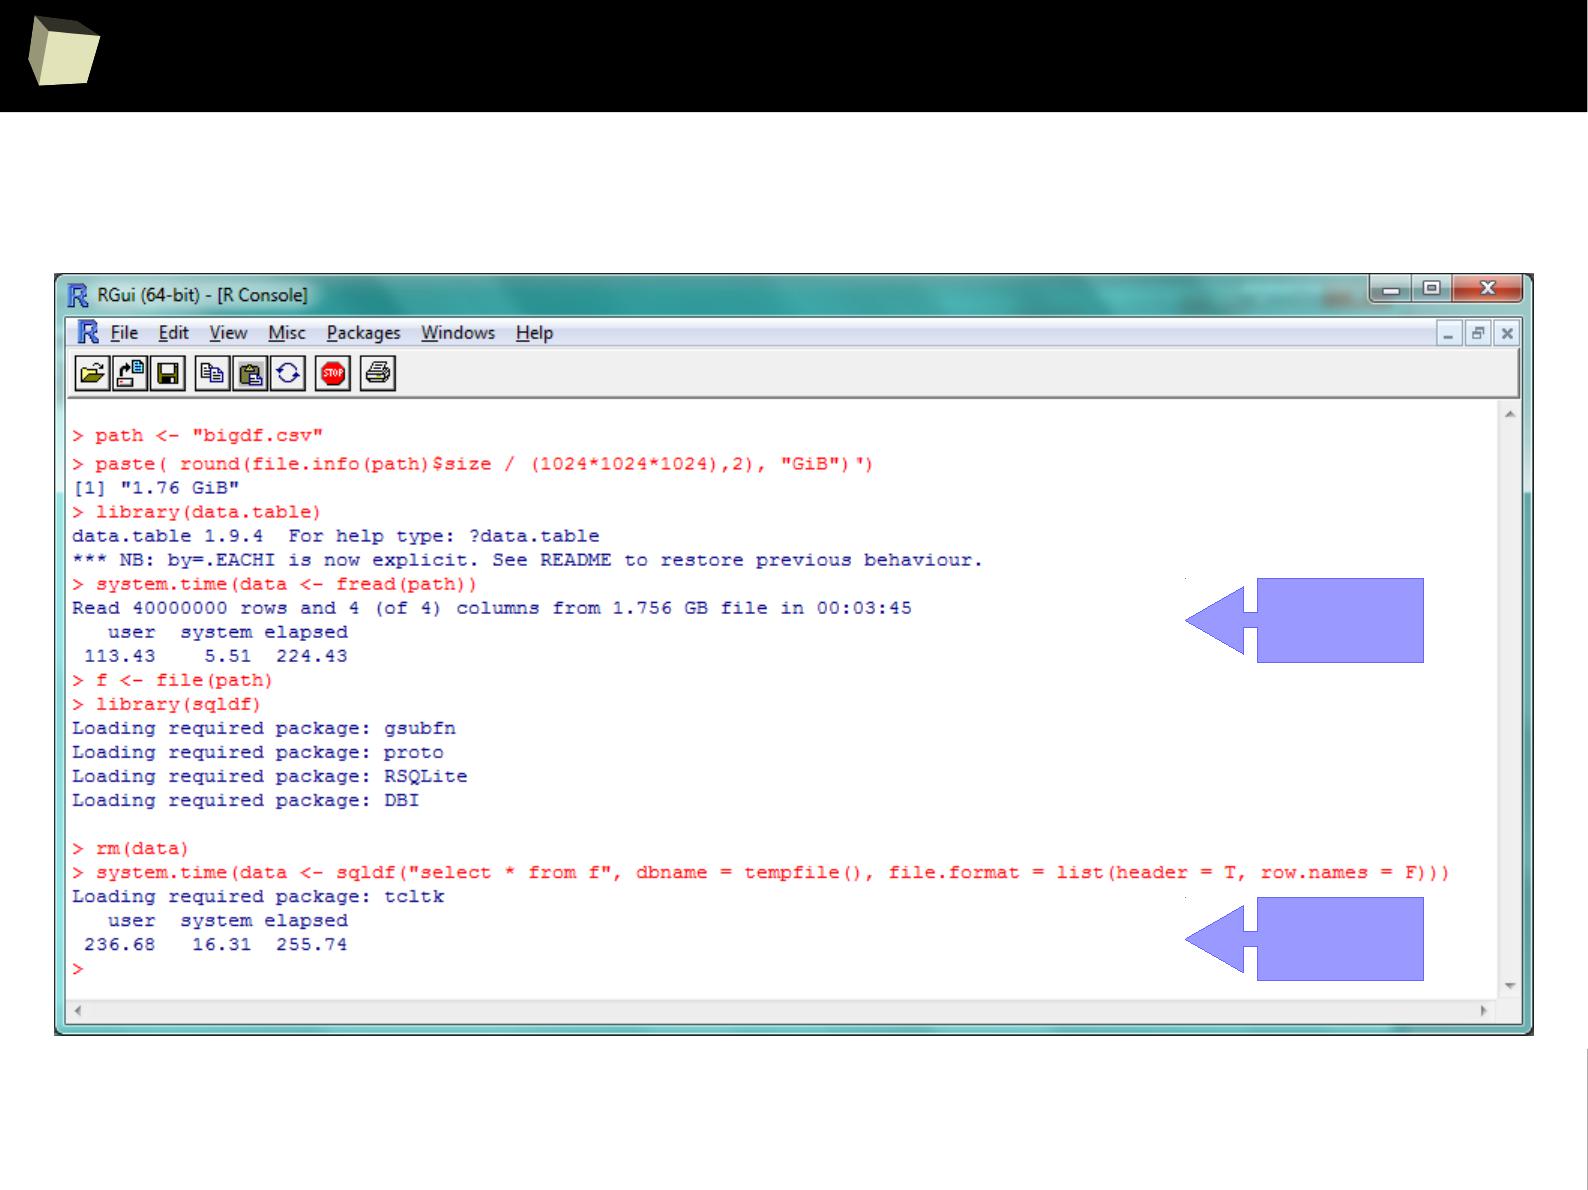
SQLite – it's quite fast!
The default, SQLite engine makes sqldf really fast.
Three simple benchmarks were run. Results are quite satisfying:
I. Reading a 1.7 GiB (4
columns
x 40,000,000
rows
) CSV file into R data.frame
●
via sqldf: 4m:20sec
●
via data.table::fread, the fastest method available in R: 3m:45sec
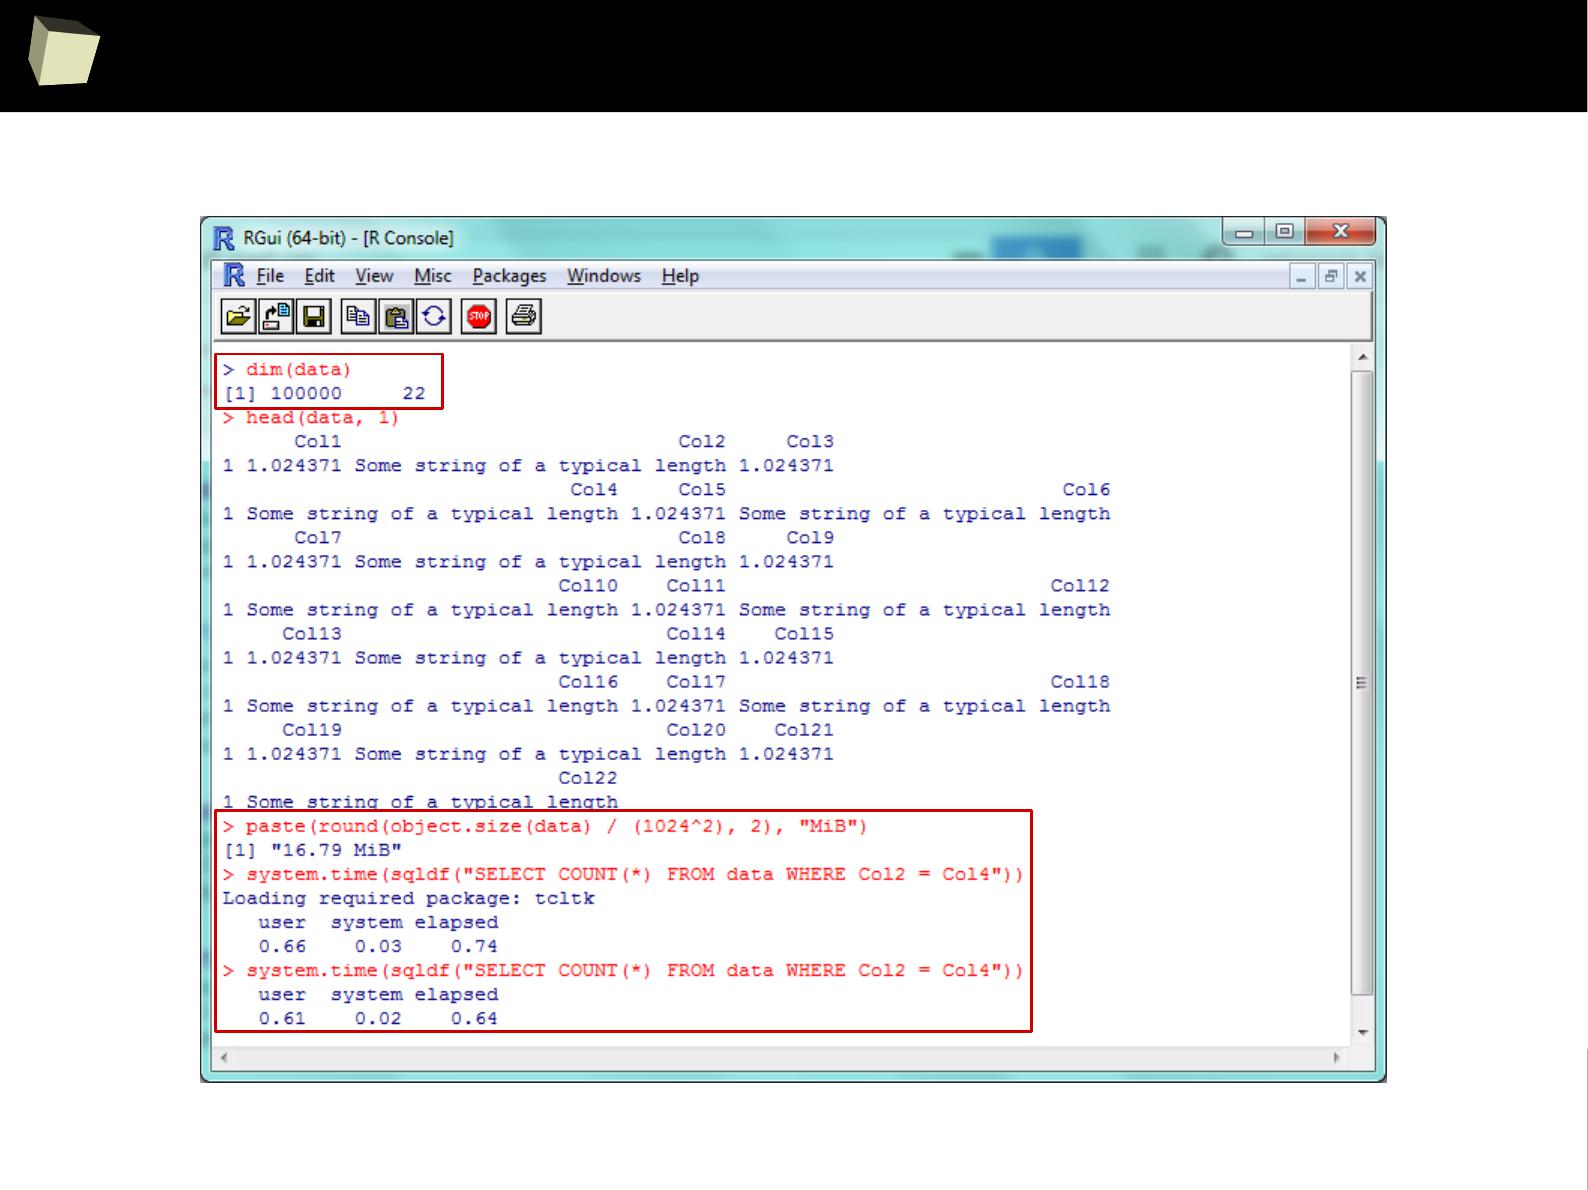
II. Querying this ~1.1 GiB dataset.
●
via sqldf: 5.6 sec
●
via the fastest, native sub-setting method: 7.4 sec
III. Querying a ~17 MiB (22
columns
x 100,000
rows
) data.frame
●
via sqldf: 0.7 sec – one won't notice any lags in everyday practice.
1 kB = 1000 B
1 kiB = 1024 B
1
5
9
SQLite – reading a huge CSV
fread
sqldf

1
6
0
SQLite – performance of querying huge dataset
reading
dataset
querying
via sqldf
querying
via native R
1
6
1
SQLite – performance of querying typical dataset

1
6
2
...much closer cooperation...
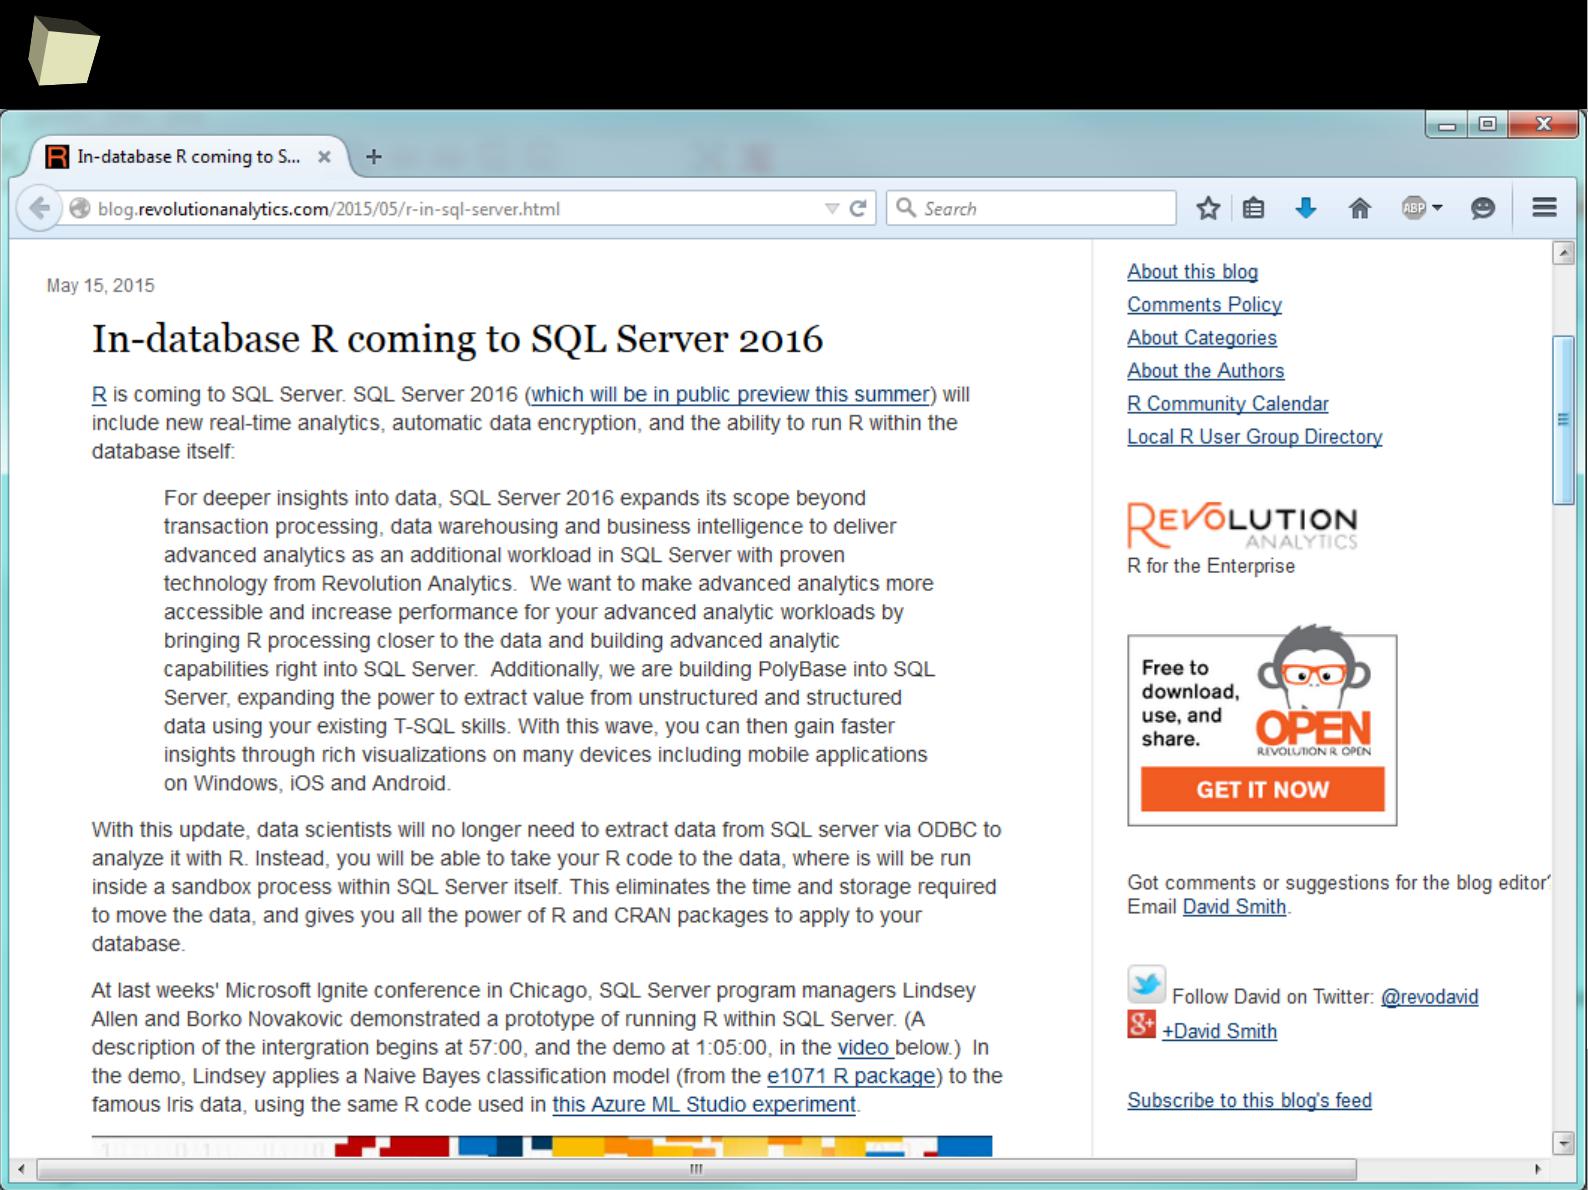
R can be invoked directly from within PostgreSQL and Microsoft SQL Server:
●
In PostgreSQL one can use the PL/R language (example)
●
In SQL Server there are three options:
●
write a CLR function which wraps invocations of a chosen
R↔.NET “connector”: R.NET, RserveCLI, StatConnector, etc.
●
create and use DCOM objects directly (sp_OACreate)
●
NEW: use native T-SQL calls to run R directly from SQL Server
This enables the user to easily perform statistical analyses directly under the
database engine and employ complex validation rules in triggers.

1
6
3
Easy data transfeR
With R and a rich set of database drivers (ODBC, JDBC, native) it is easy to
transfer data between various sources with only few lines of code.
Actually, this is even easier than in C# :)
tables <- list()
tables[["tab1"]] <- read.csv("c:/tmp/table1.csv") # source 1
tables[["tab2"]] <- read.xlsx("c:/tmp/mysheet.xlsx", sheet=2) # source 2
tables[["tab3"]] <- sqlQuery(otherCon, "SELECT * FROM Table") # source 3
…
myCon <- odbcConnectAccess("c:/tmp/my.mdb"))
for(table in names(tables)){
sqlSave(myCon, tables[[table]], tablename = table) # that's all!
}
OdbcClose(myCon)
Isn't this just beautiful?

1
6
4
13 reasons why you will love GNU R
I R is (extremely) cheap. In fact - it's free :)
II R has (extremely) wide range of capabilities
III R is (widely) supported by the world of science
IV R is supported by the community
V R is (increasingly) supported by the business
VI 2/3 :) Advanced data manipulation
VII Interoperability is easy to achieve
VIII R is truly cross-platform
IX R offers numerous ways of presenting data
X There are many options to optimize the code
XI R is able to handle large amount of data
XII R has a set of fancy tools and IDEs
XII FDA accepted using R for drug trials!

1
6
5
Manipulating data
SQL is extremely useful for querying data but it is not the only option the user
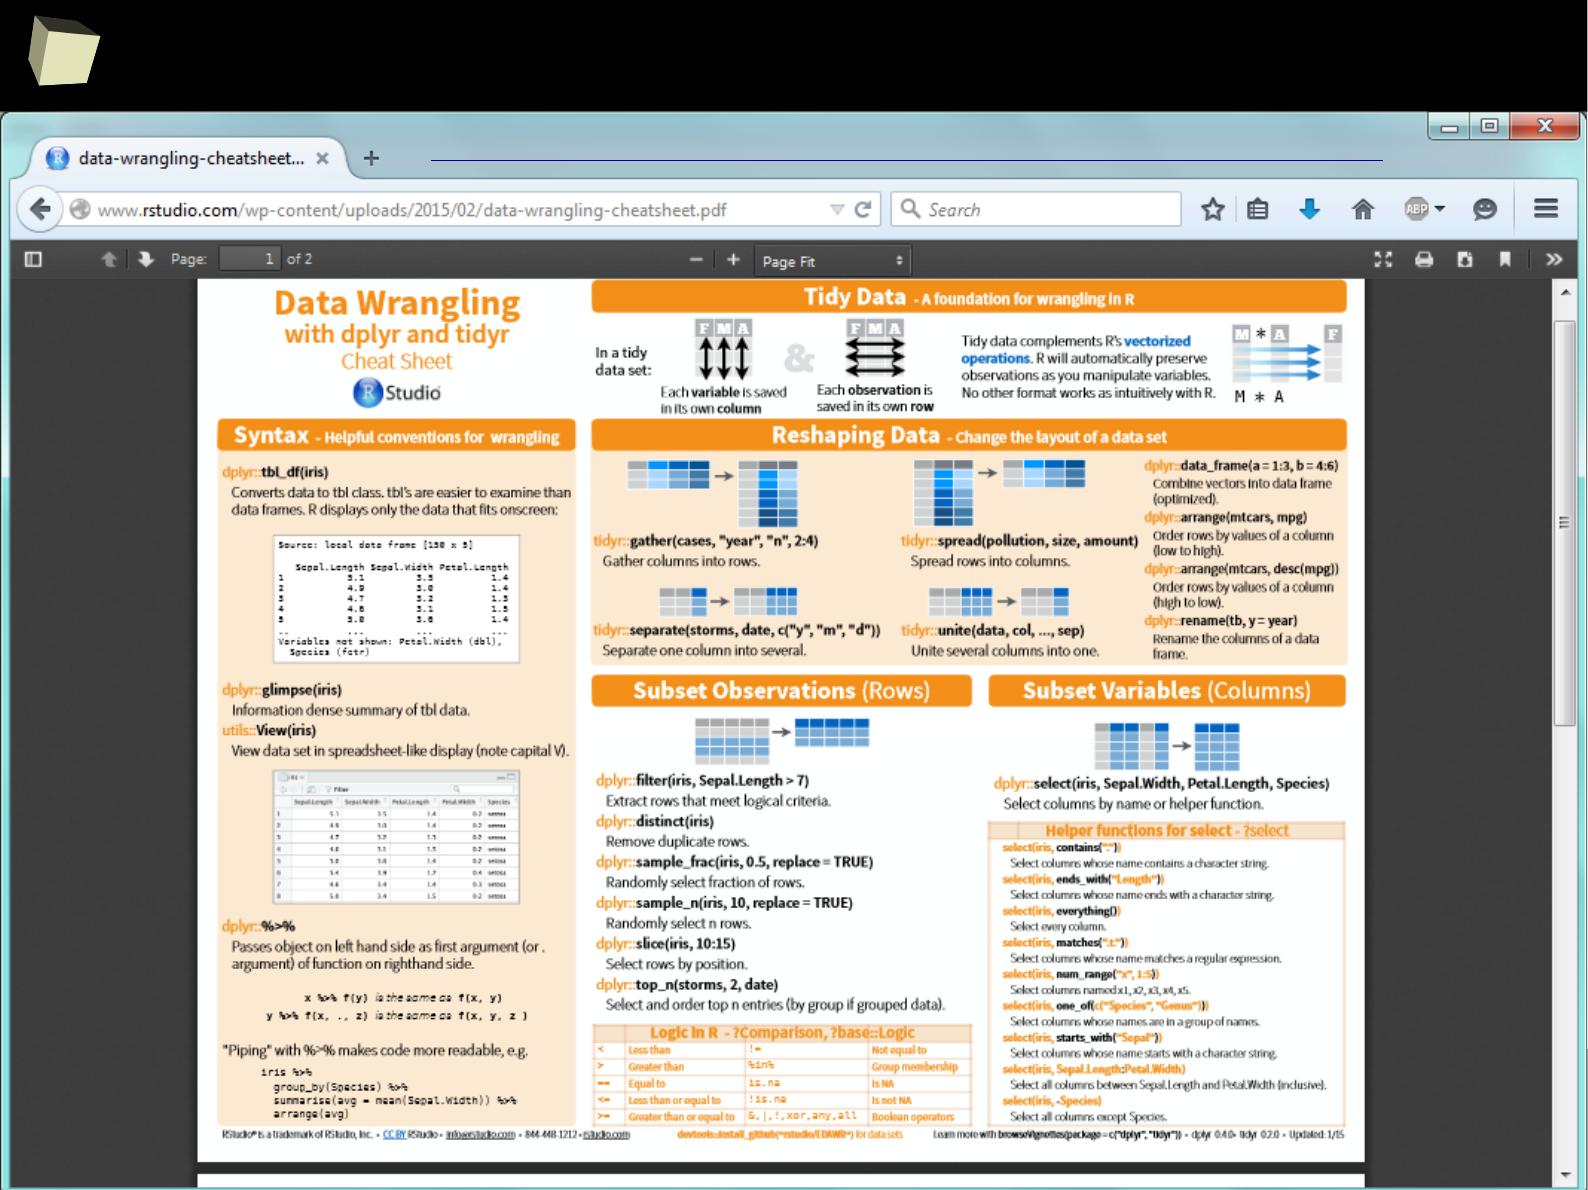
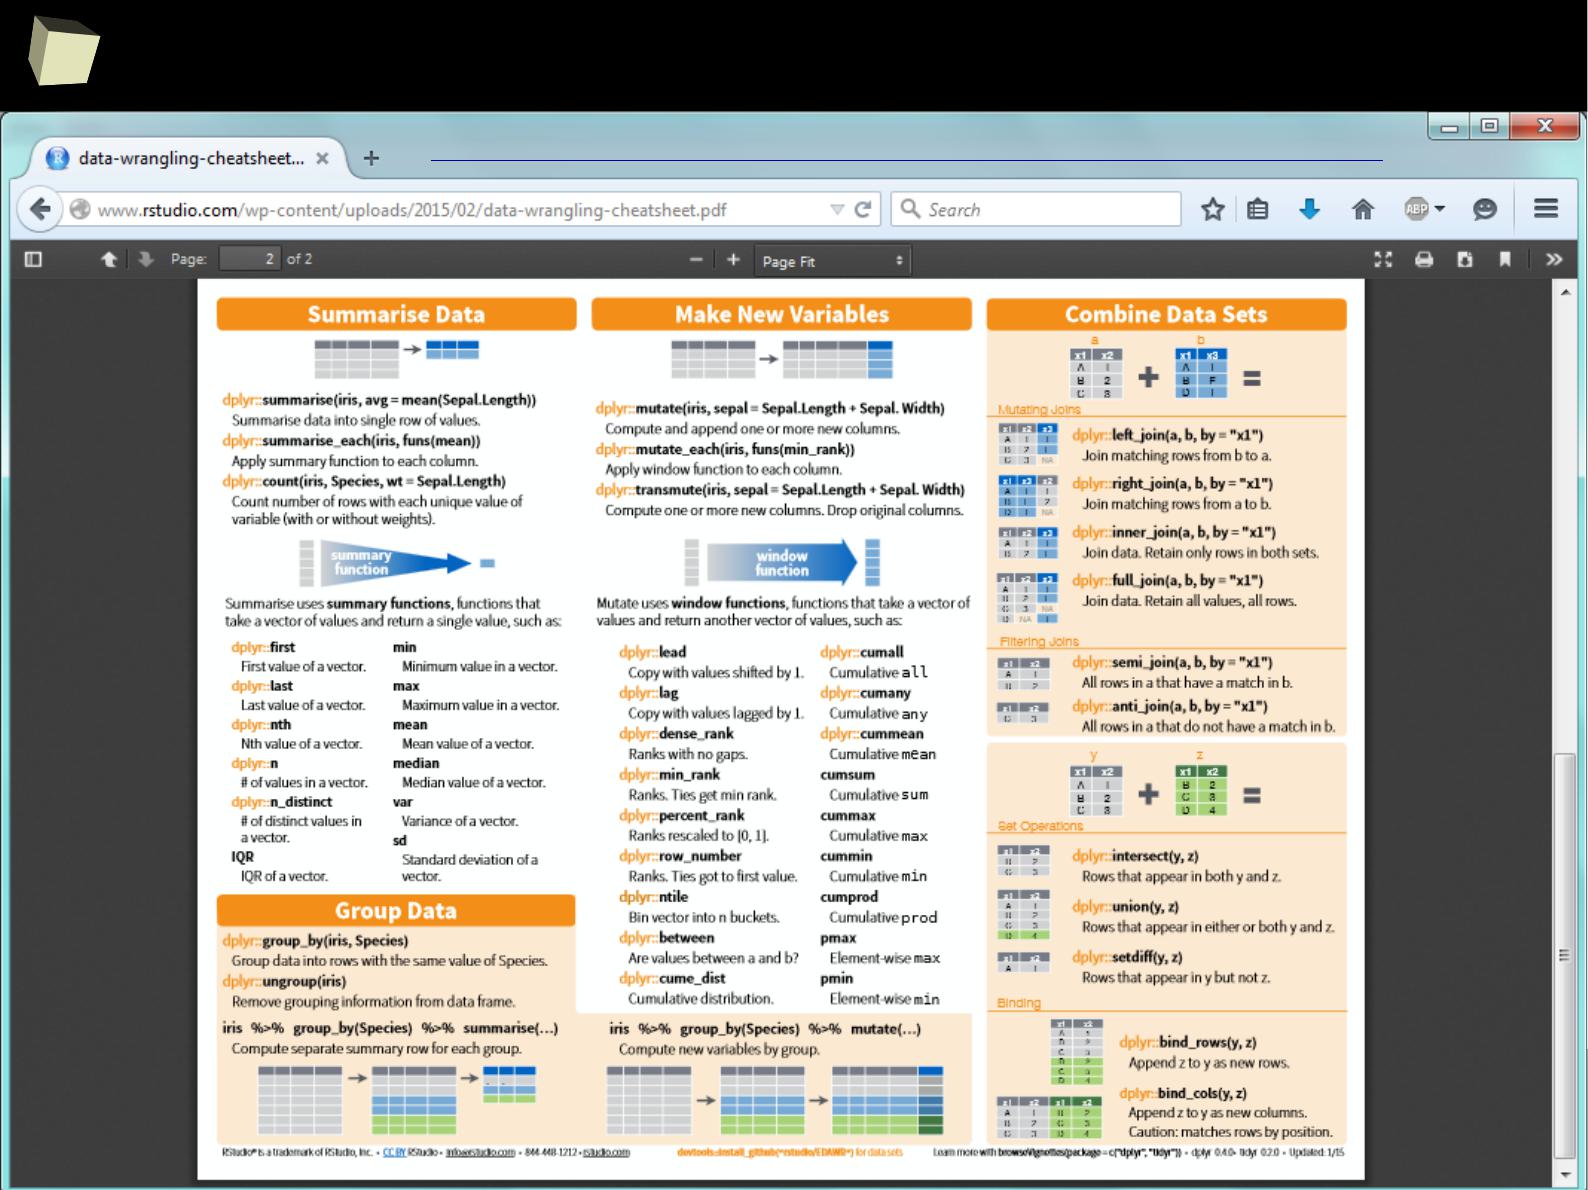
can choose. ddplyr, reshape2, tidyr and data.table libraries provide a rich set
of functions for advanced querying and manipulating data structures, i.e.:
●
Filtering (sub-setting) rows
●
Selecting variables (columns)
●
Adding new variables, e.g. computed (mutating and transmutating)
●
Ordering results (sorting)
●
Aggregating (grouping and summarizing)
●
Reshaping data from wide to long format and vice-versa
●
Combining (piping) the above operations by the chain operator %>%
Unquestionably, these packages are one of the top-most useful, “must-have”
packages in the analyst's toolbox.

1
6
6
Manipulating data
The chain operator %>% is a one of the most useful operators in R.
It remarkably facilitates common data processing tasks placing them in a flow.
dataset %>%
filter(column1 == 2 & column2 %in% c("A", "B", "C")) %>%
select(column1, column2, colum3) %>%
group_by(column1, column2, column3) %>%
summarize(Avg = mean(column3), SD = sd(column3)) %>%
mutate(CV = SD/Avg) %>%
arrange(desc(CV)) %>%
merge(., dictionary, by.x="column1", by.y="ID") %>%
head(., 10)
1
6
7
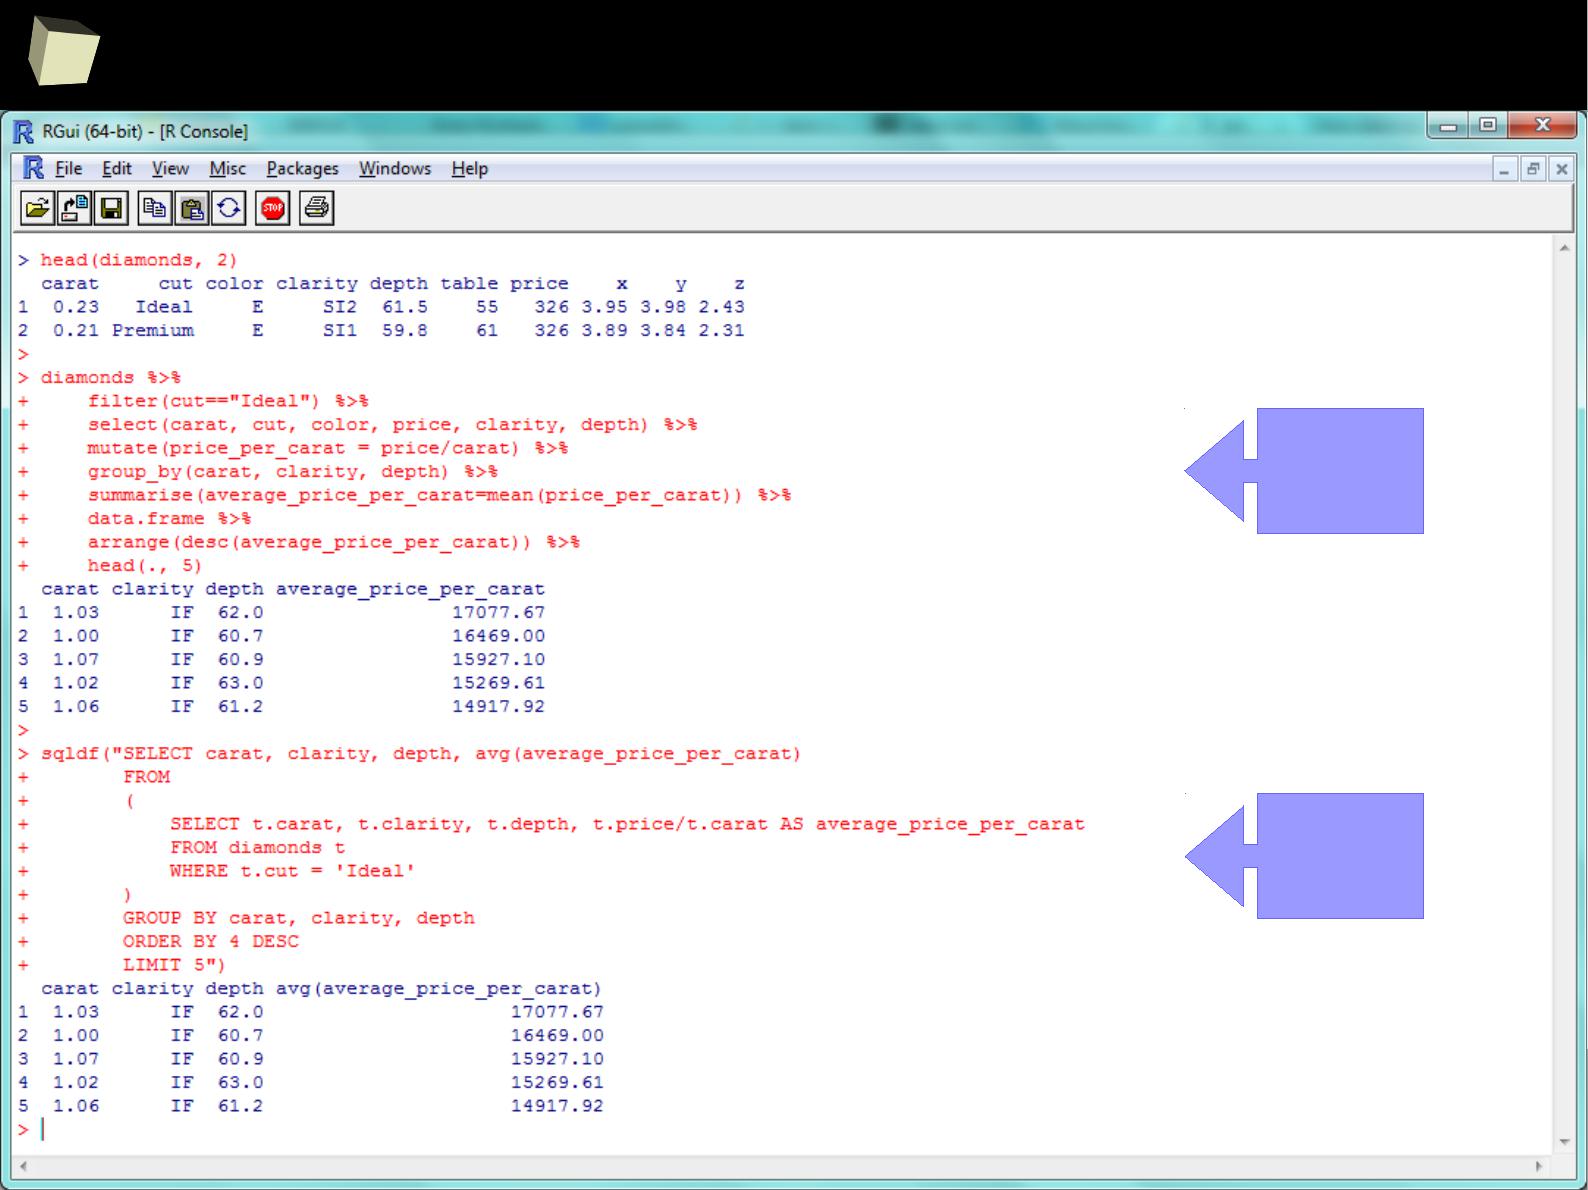
Querying data with dplyr
compared to SQL
dplyr
sqldf
1
6
8
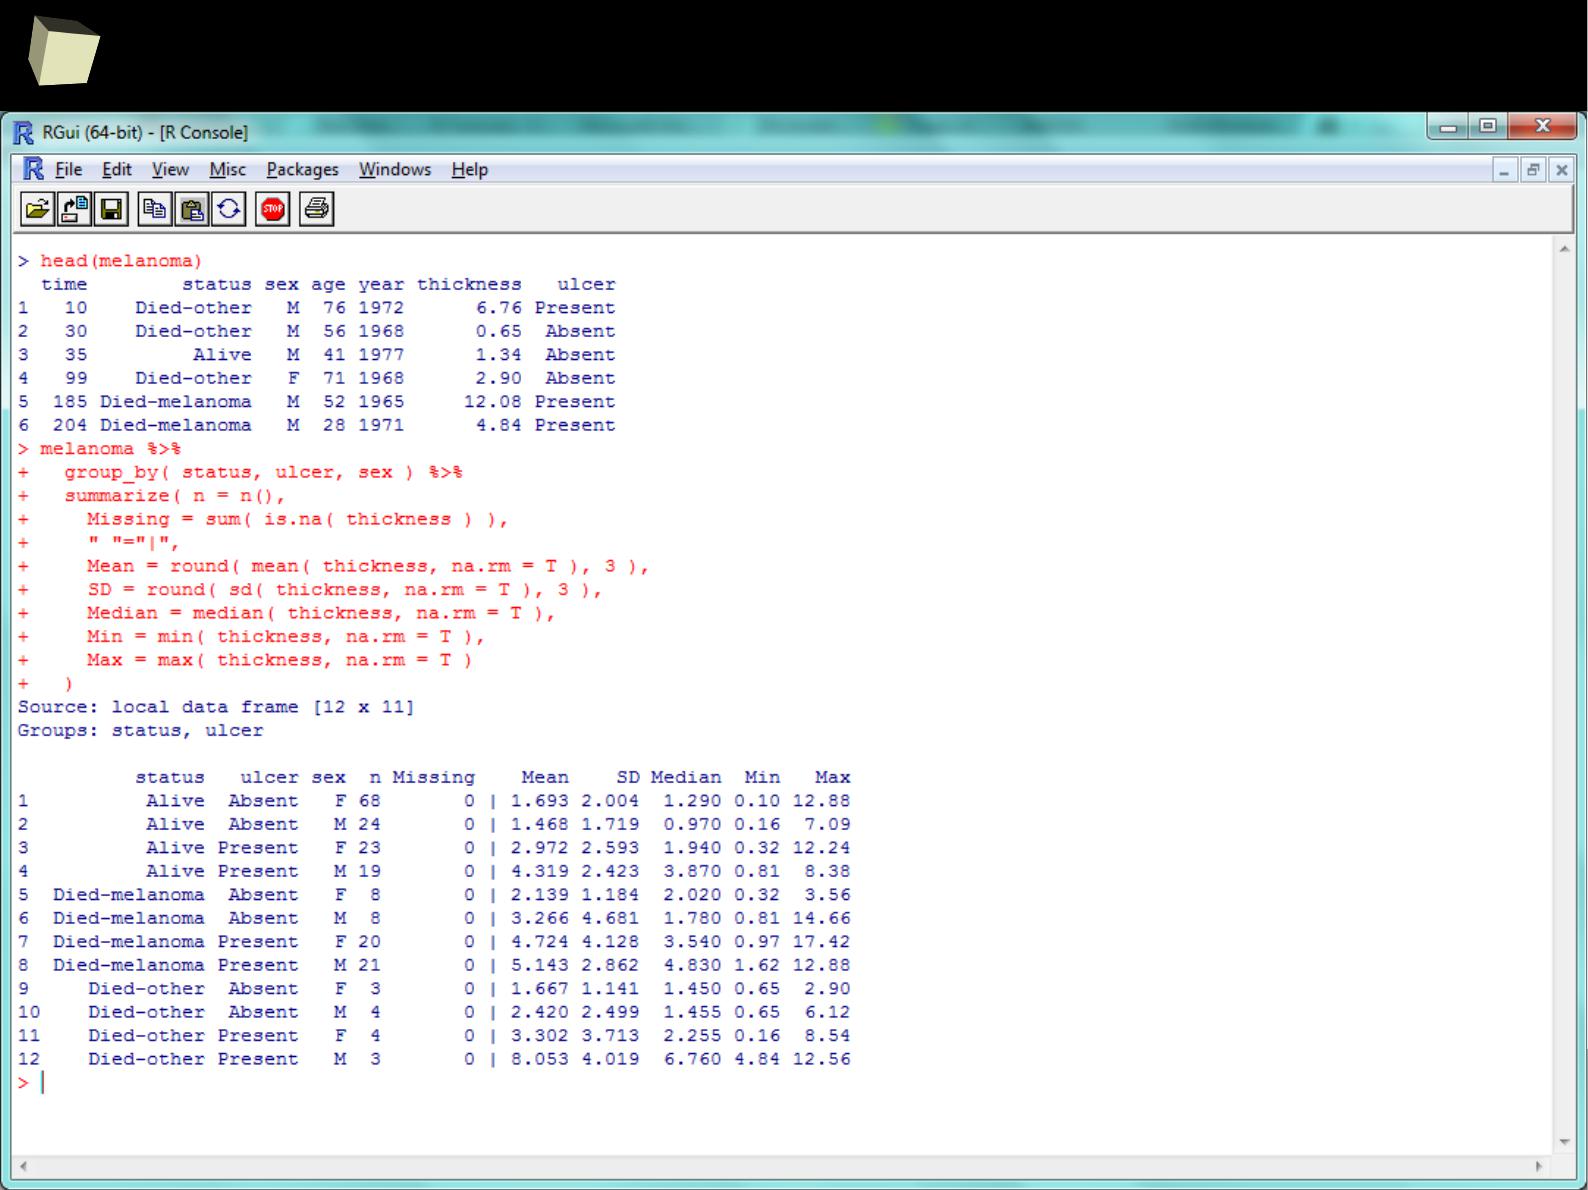
With dplyr “group-by summaries” are easy!
1
6
9
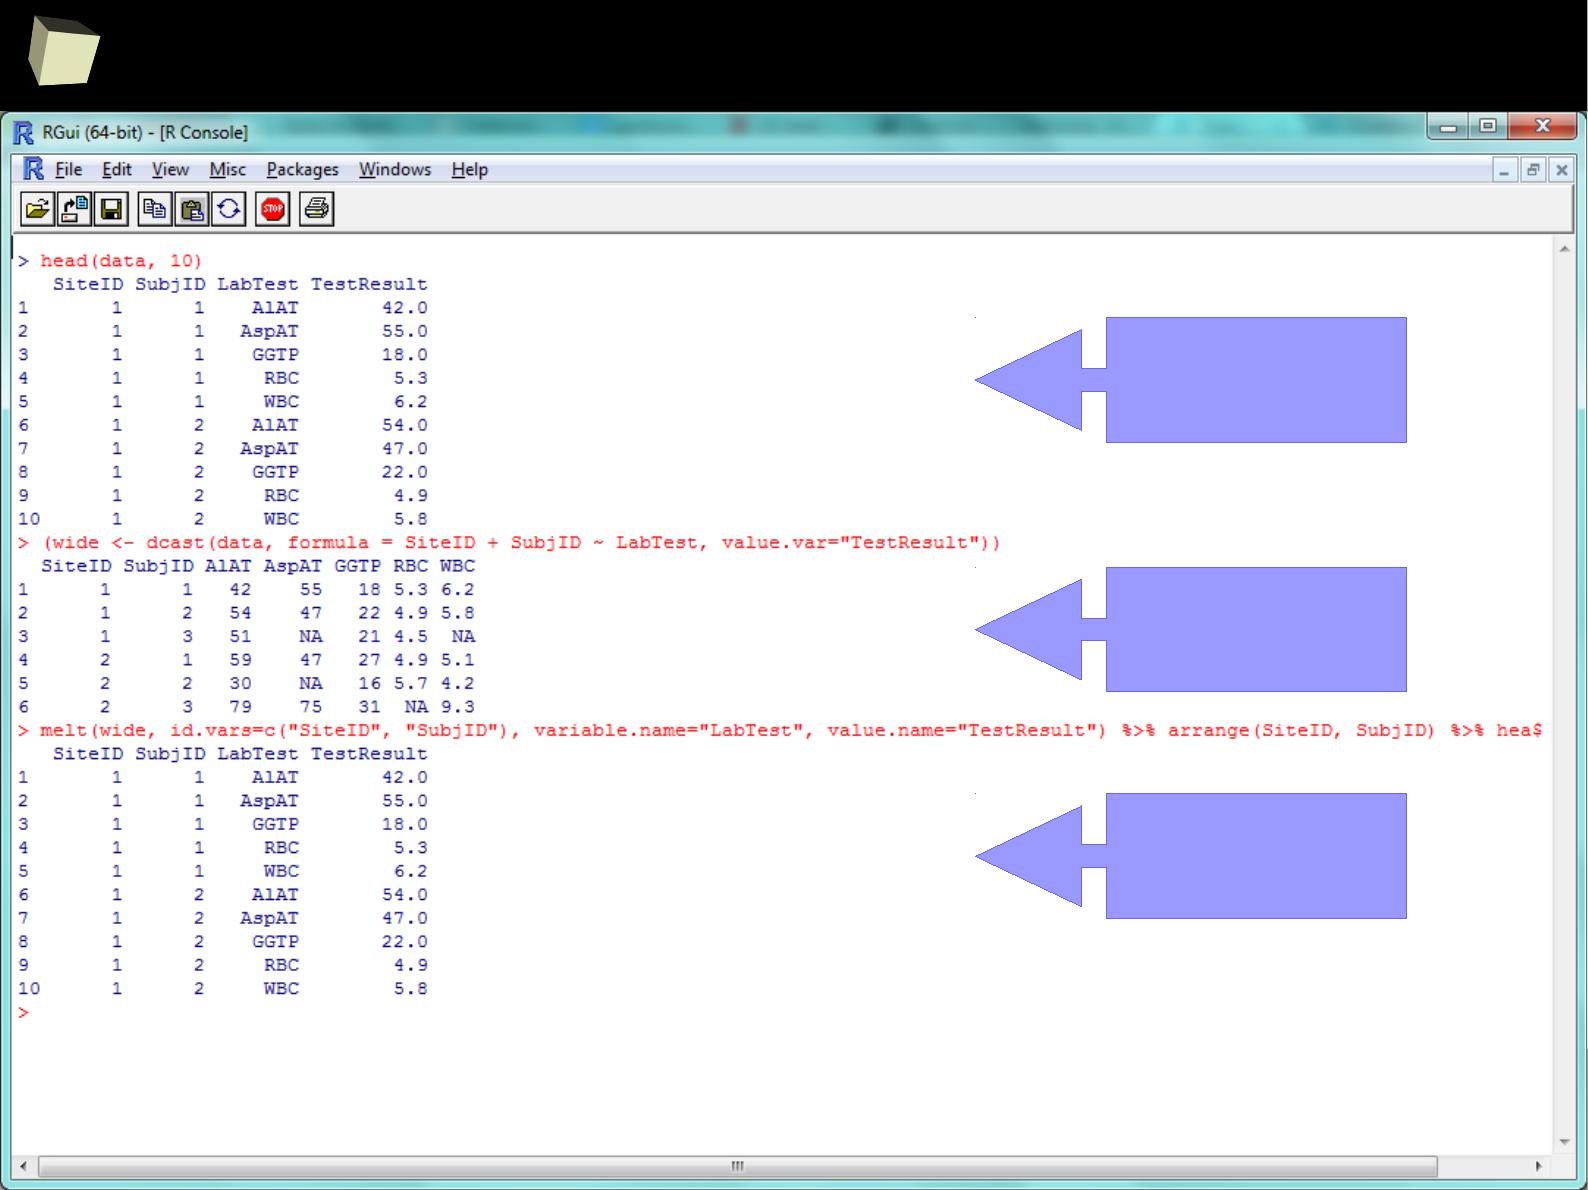
Reshaping long ↔ wide format with reshape2
source (long)
long wide→
wide long→

1
7
2
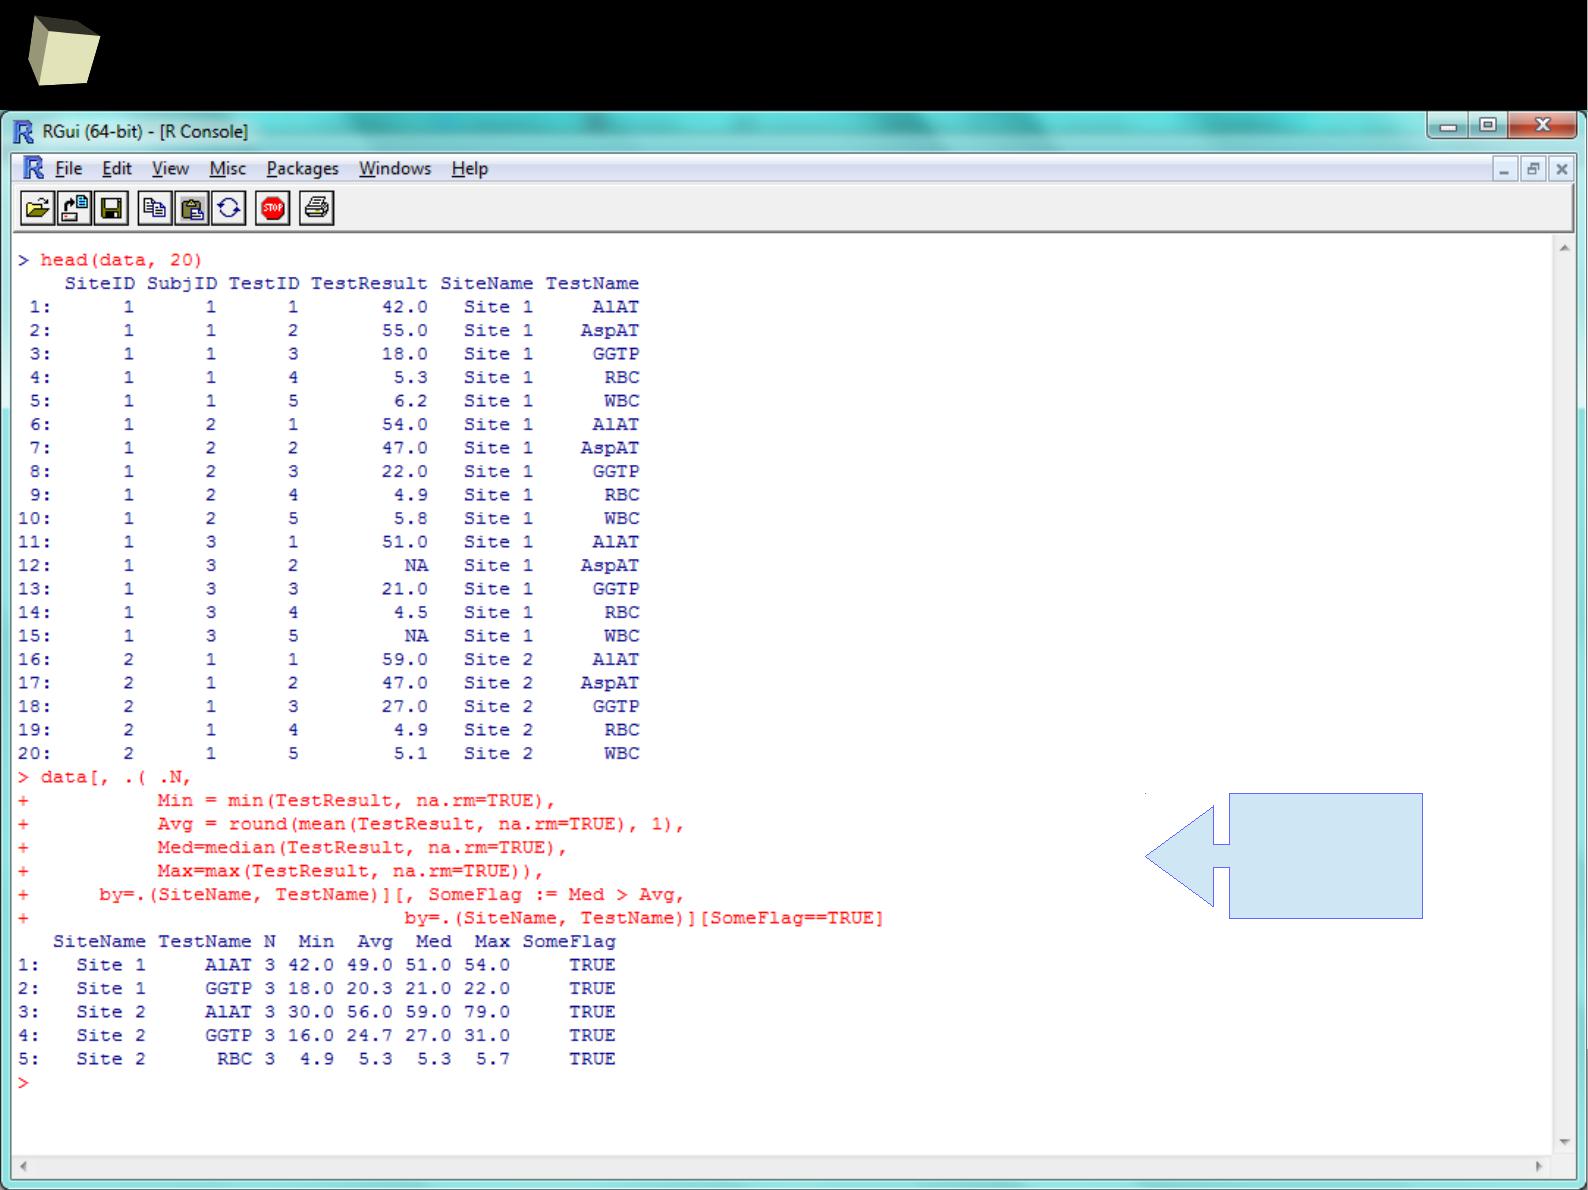
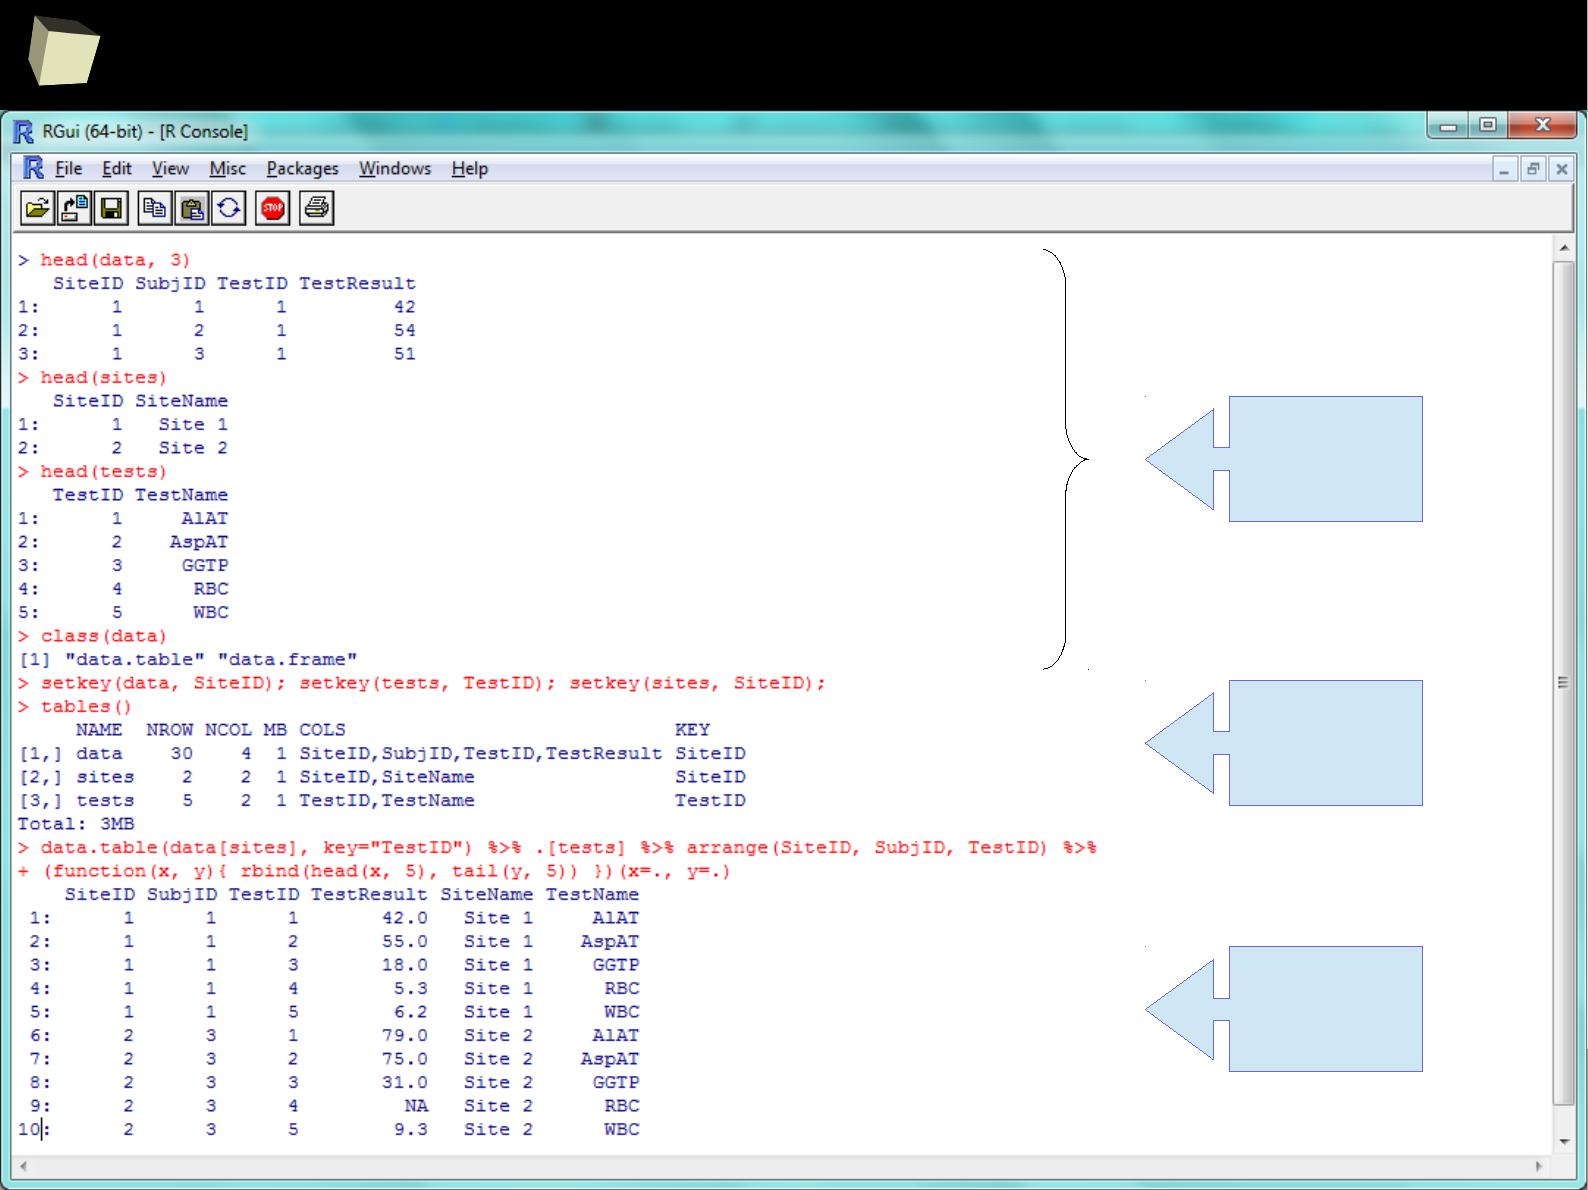
data.frame → data.table
data.table is a library providing a significant enhancement of the regular R
data.frame. It allows the user to perform really fast (indexing) in-memory
processing of huge volumes of data (>100 GB) with a relatively easy syntax.
It covers the following tasks:
●
filtering rows and selecting columns
●
adding and deleting (mutating) columns using no intermediate copies at all
●
joining tables by indexes
●
aggregating (calculations in sub-groups)
●
reading huge CSV files – this is the fastest method currently available in R
●
indexing selected content (set of columns) of a data.table
Data.tables are compatible with data.frames with some exceptions (FAQ 2.17).
1
7
3
With data.table summaries are easy too!
grouping,
mutating,
filtering
1
7
4
data.table feat. dplyr
3 x indexed
data.table
content of a
data.table
storage
merging,
chaining,
anonym. fn.
1
7
5
Manipulating data
Valuable resources:
●
http://seananderson.ca/2013/10/19/reshape.html
●
http://seananderson.ca/2014/09/13/dplyr-intro.html
●
http://www.sharpsightlabs.com/dplyr-intro-data-manipulation-with-r
●
http://cran.rstudio.com/web/packages/dplyr/vignettes/introduction.html
●
http://www.statsblogs.com/2014/02/10/how-dplyr-replaced-my-most...
●
http://www.cookbookr.com/Manipulating_data/Converting_data_between...
●
http://datatable.r-forge.r-project.org/datatable-faq.pdf
●
http://s3.amazonaws.com/assets.datacamp.com/img/blog/data+table...
●
http://github.com/Rdatatable/data.table/wiki/Benchmarks-%3A-Grouping

1
7
6
13 reasons why you will love GNU R
I R is (extremely) cheap. In fact - it's free :)
II R has (extremely) wide range of capabilities
III R is (widely) supported by the world of science
IV R is supported by the community
V R is (increasingly) supported by the business
VI R is able to read data in many formats
VII Interoperability is easy to achieve
VIII R is truly cross-platform
IX R offers numerous ways of presenting data
X There are many possibilities to optimize the code
XI R is able to handle large amount of data
XII R has a set of fancy tools and IDEs
XII FDA accepted using R for drug trials!

1
7
7
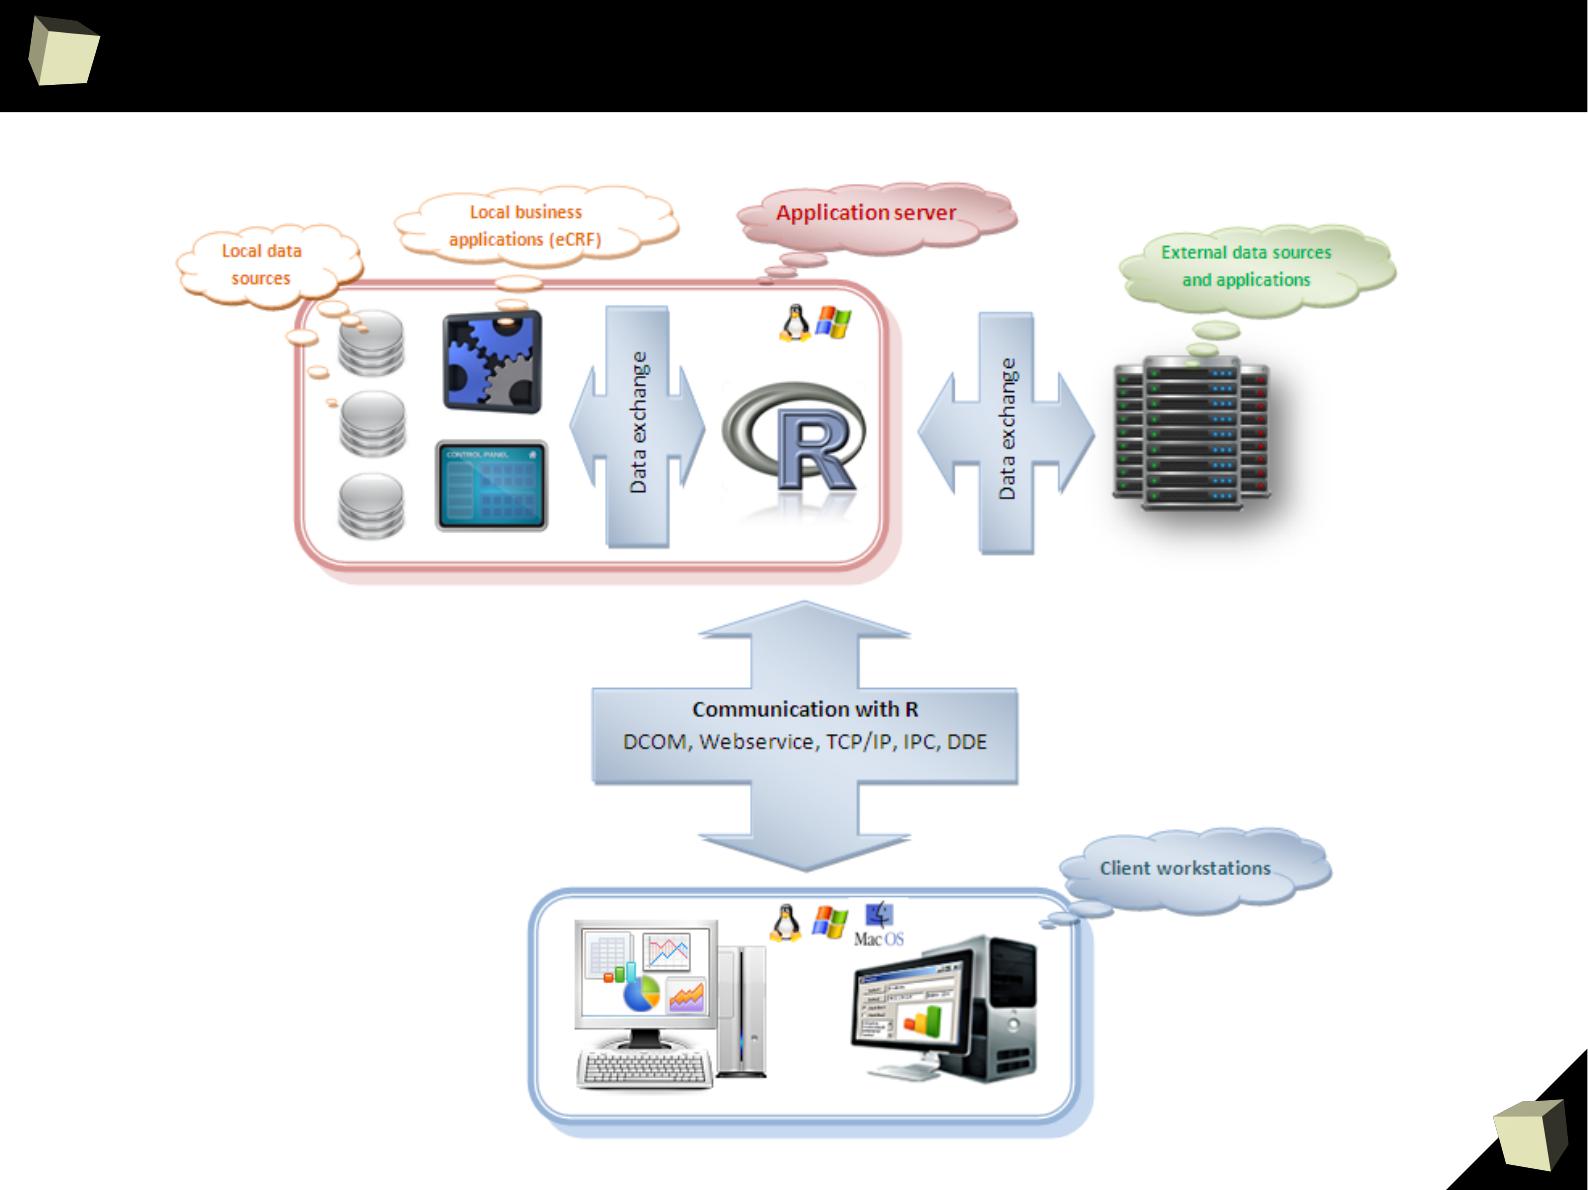
“R” stands for inteRoperability
R is not only a great statistical package. It is often used as a part of more
complex systems as a computing engine. It may also function as a standalone
computational server through the Web.
There are number of libraries that allow to communicate with R in many ways
(COM, TCP/IP, WebServices, DDE, direct linking) from many programming
languages and platforms (C++, Java, .NET/Mono, Perl, Python, Scala, ...) or
external applications able to act as a COM, DDE or Webservice client.
It's worth noting that R is able to call C/C++, Java, .NET, Perl and Python code.
In addition, R allows to create embedded graphical user interfaces (GUI) for
easier entering data and performing analyzes by people not familiar with R. One
can make use of the GTK, Tcl/Tk, wxWidgets and gWidgets toolkits or the
R GUI Generator.
1
7
8
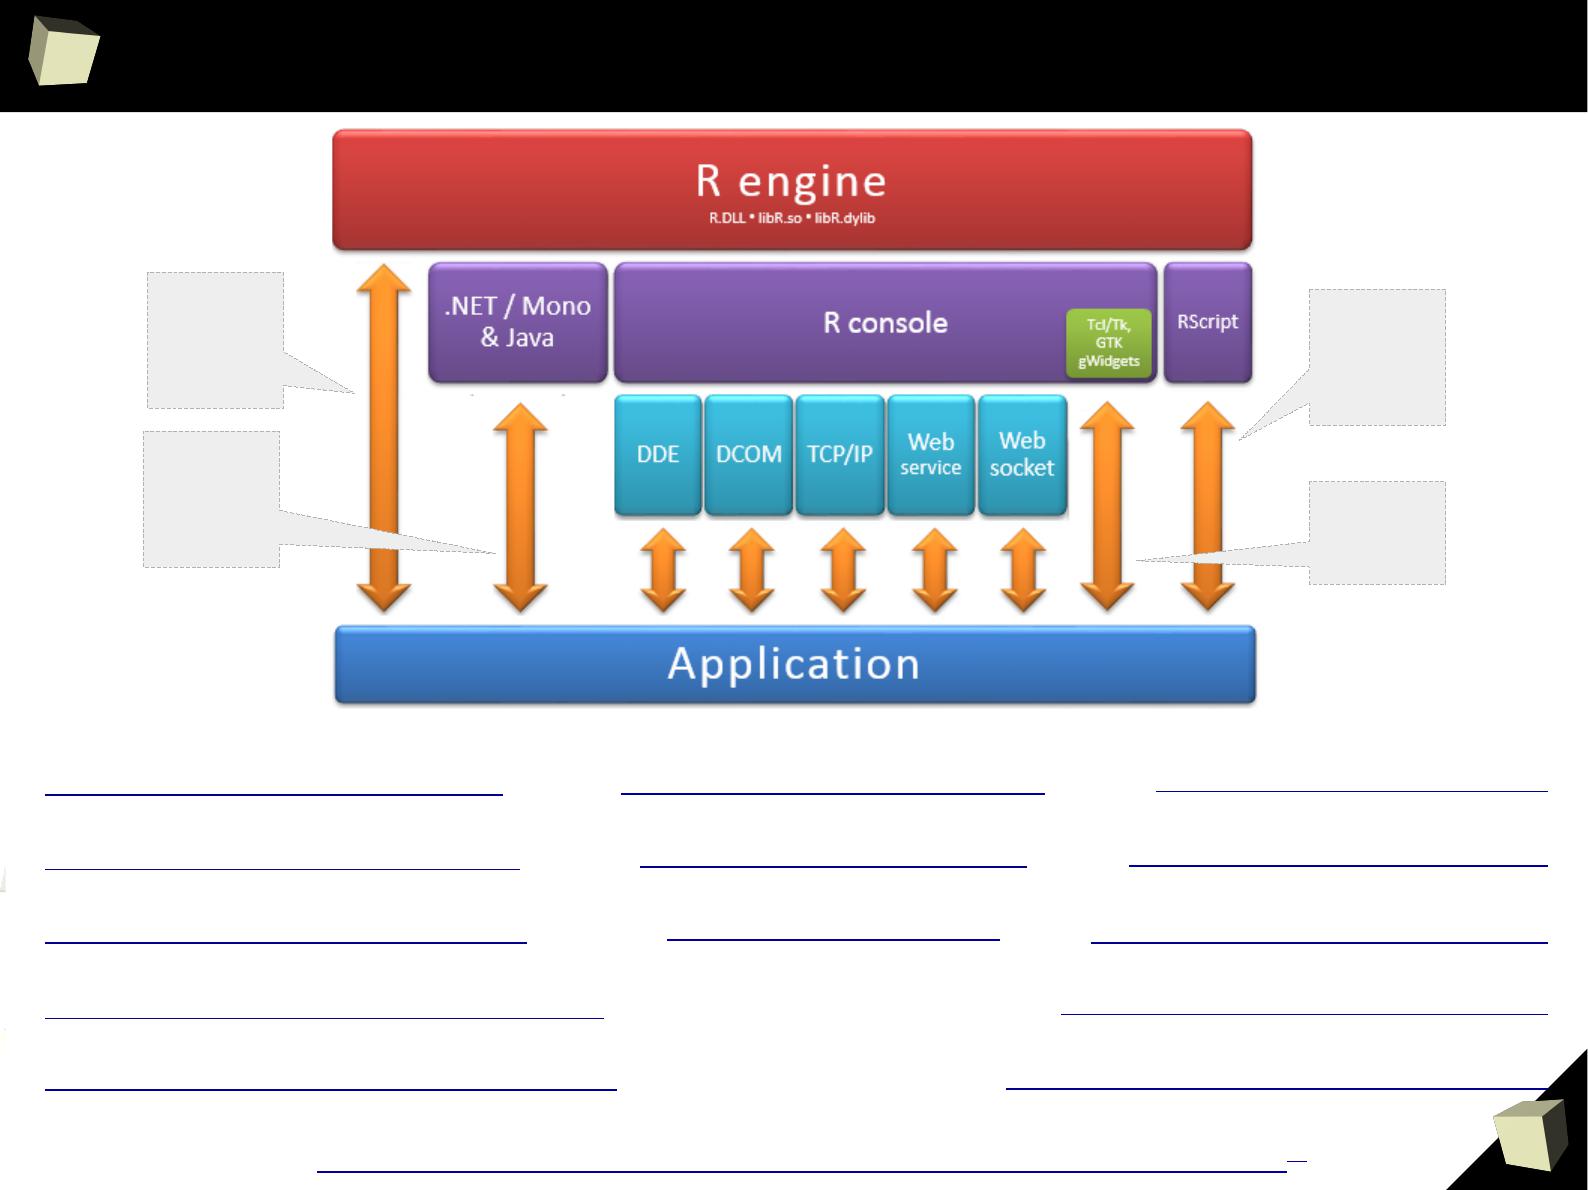
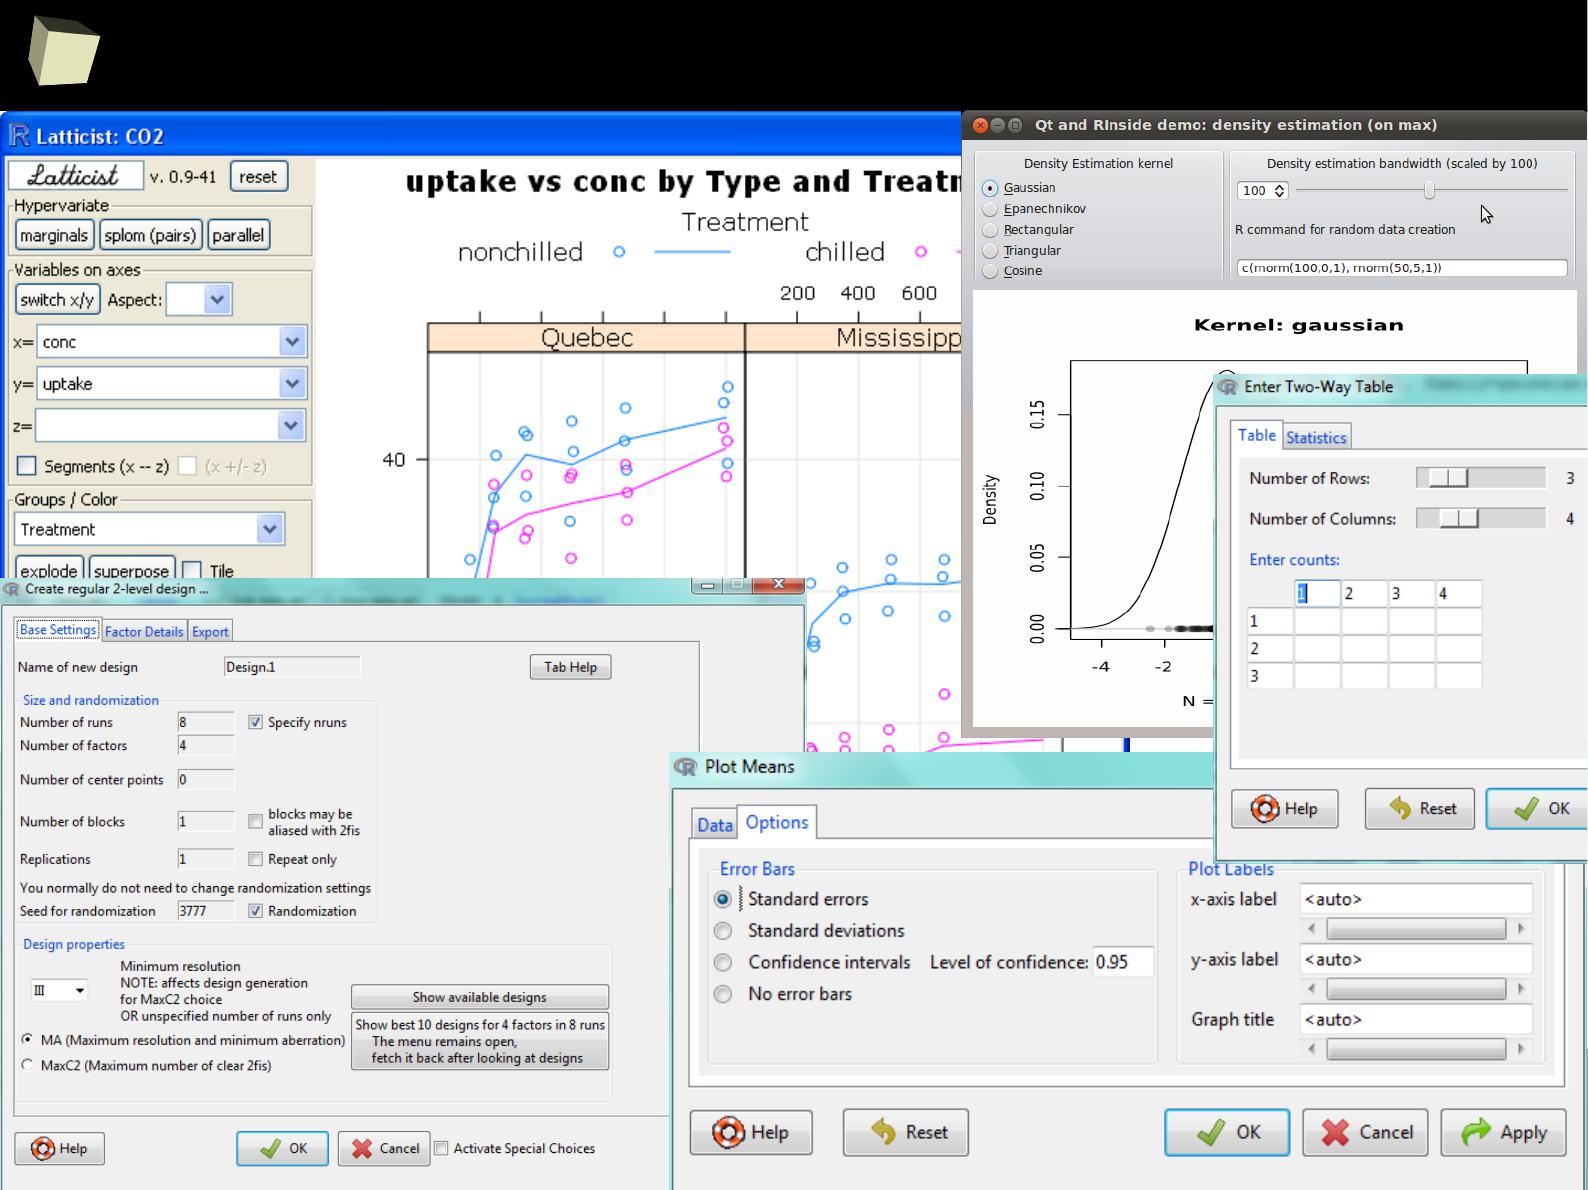
“R” stands for inteRoperability
1
7
9
...”
there are so many ways of speaking
”
http://www.goldenline.pl/forum/2478242/nowy-interfejs-r-net/
PL
http://www.rforge.net/Rserve http://rdotnet.codeplex.com
http://rcom.univie.ac.at
http://rservecli.codeplex.com
http://ndde.codeplex.com
http://www.rforge.net/rJava
http://www.rstudio.com/shiny
http://rpython.r-forge.r-project.org
http://rpy.sourceforge.net
http://rclr.codeplex.com
http://www.omegahat.org/RSPerl
http://dahl.byu.edu/software/jvmr
http://www.rcpp.org
●
C++,
●
Python
●
Perl
●
Fortran
●
PHP
●
C#
●
VB.NET
●
F#
●
Java
●
Scala
Calling R
with a script
name as
parameter
Embedded,
dialog-based
applications
1
8
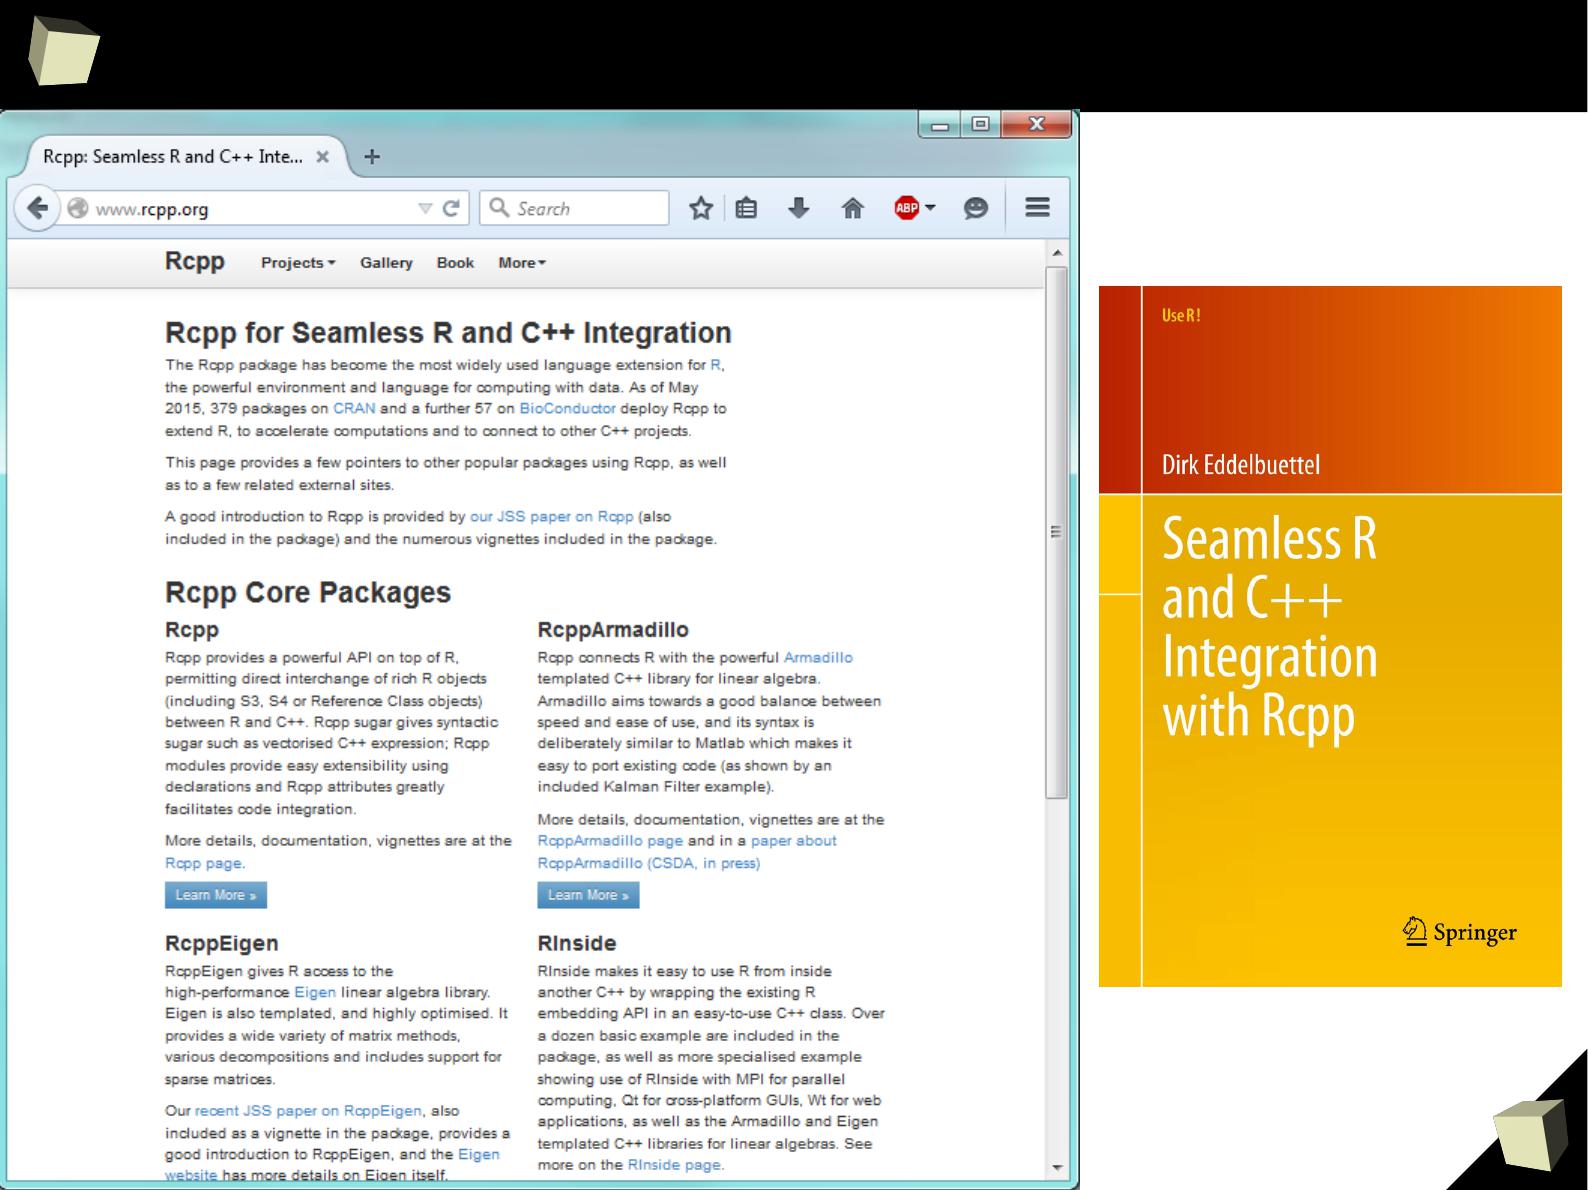
0
Easy R – C++ integration
1
8
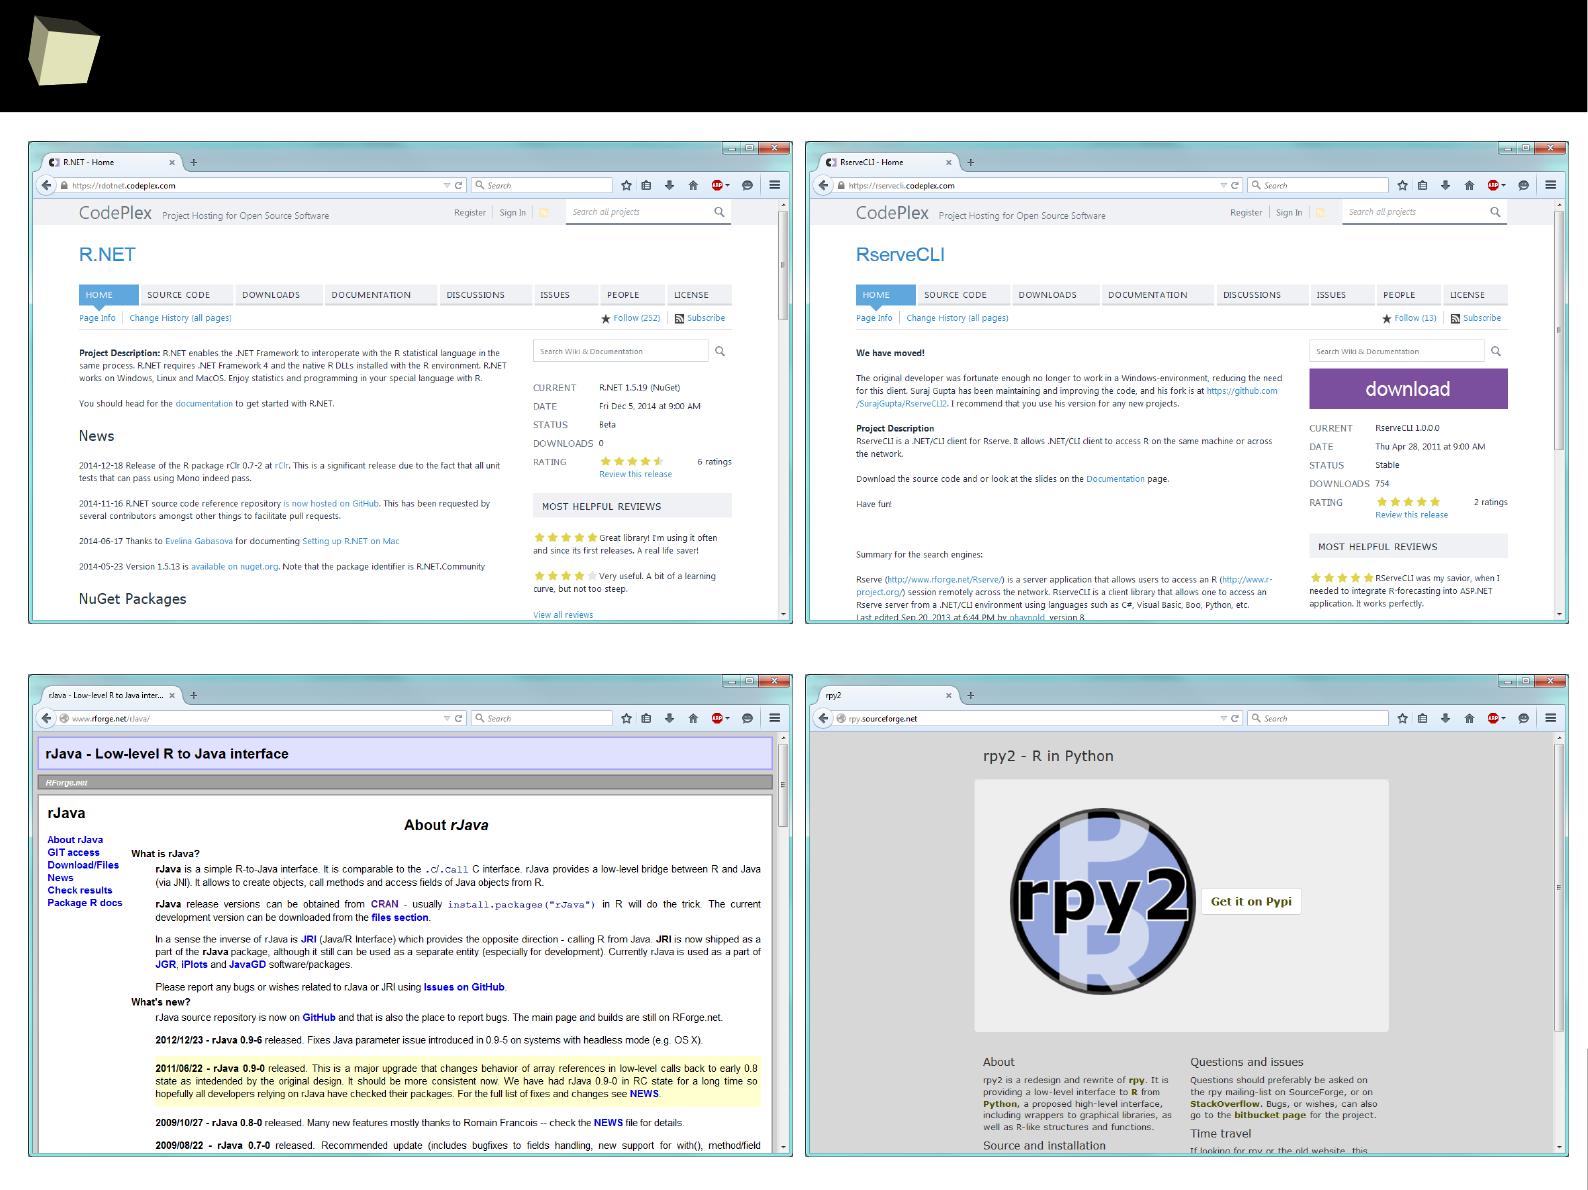
1
Various R bindings
1
8
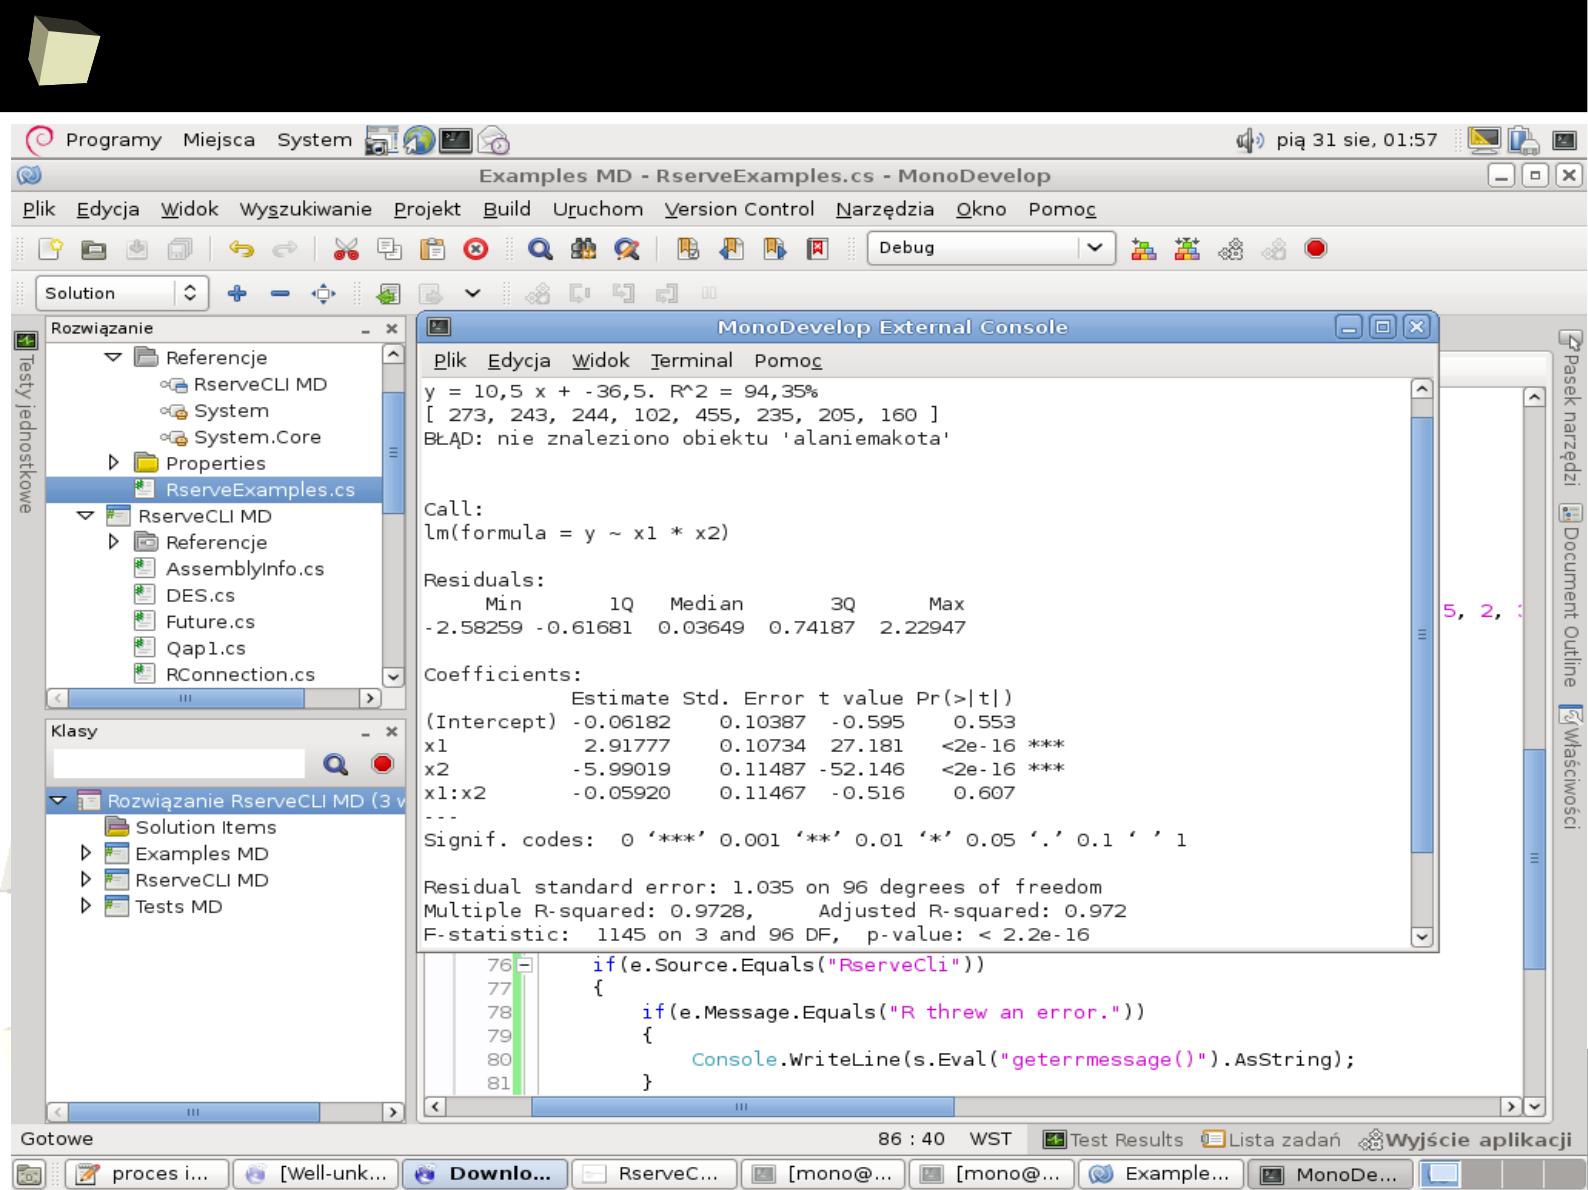
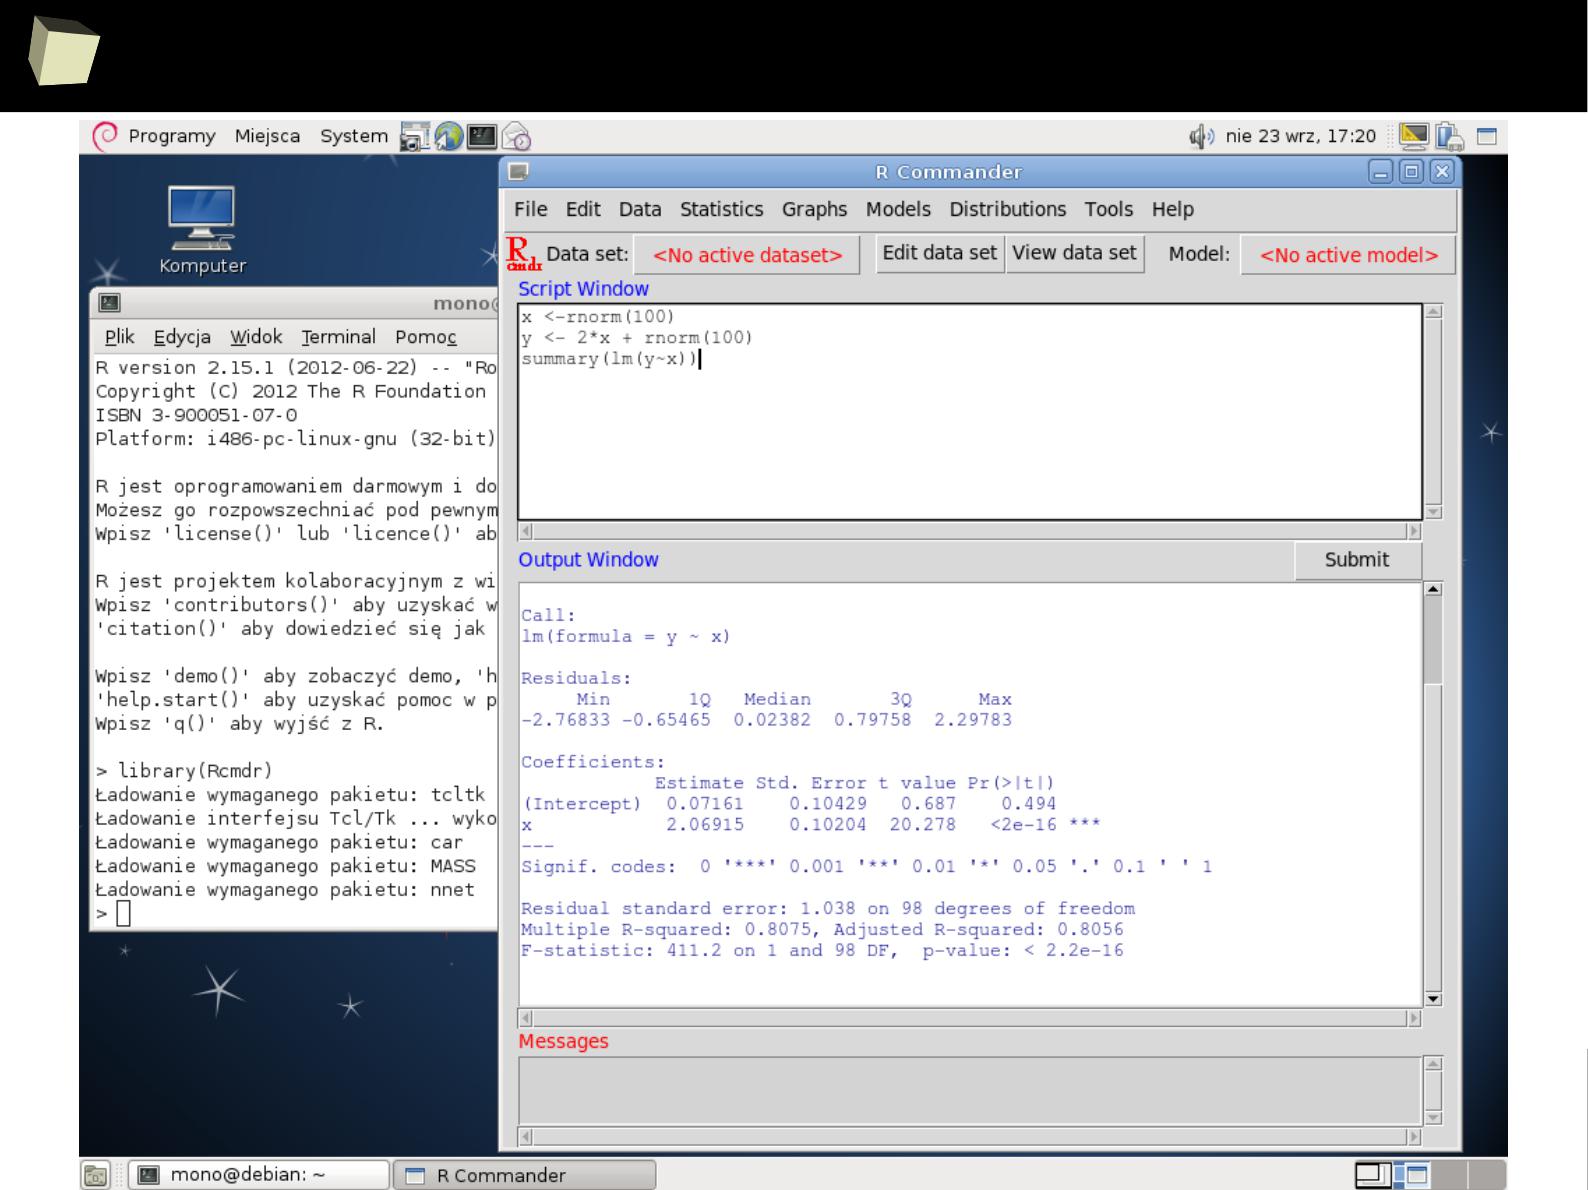
2
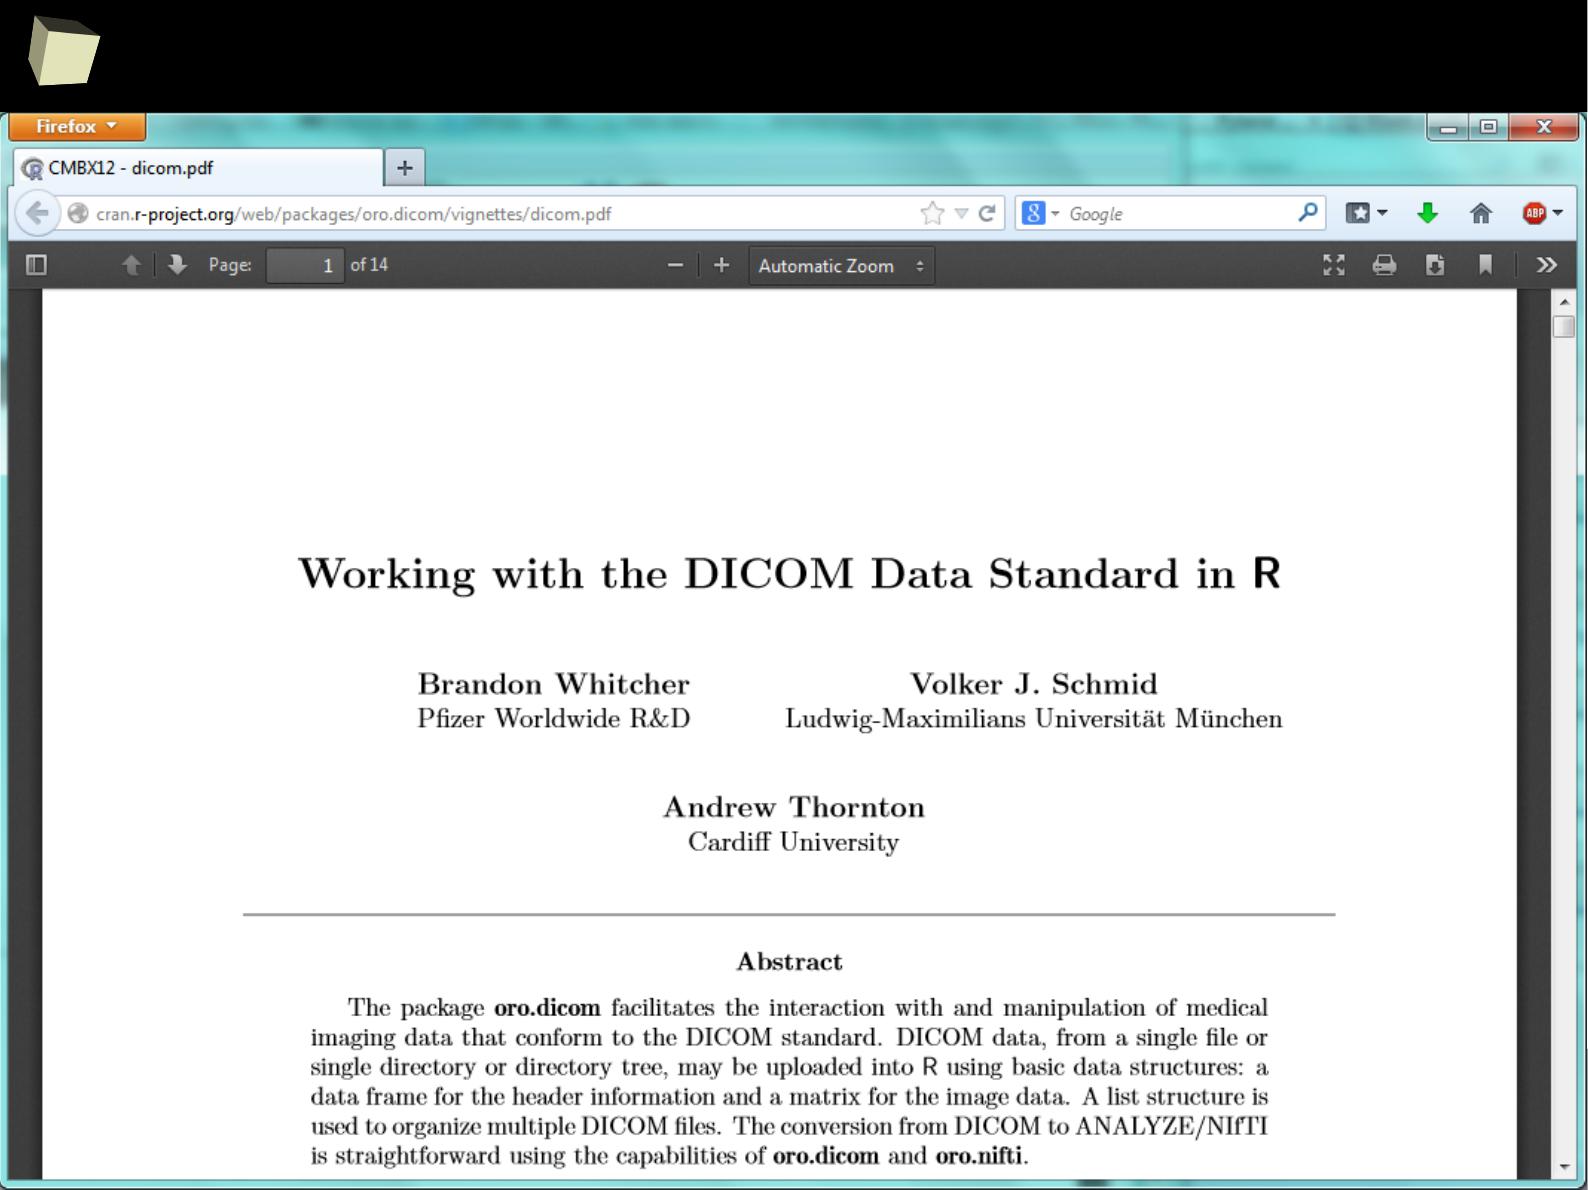
R under Mono on Debian via RserveCLI
1
8
3
R.NET interface
Sample .NET
applications
1
8
4
shining web applications with R and Shiny
1
8
5
shining web applications with R and Shiny
1
8
6
shining web applications with R and Shiny
1
8
7
shining web applications with R and Shiny
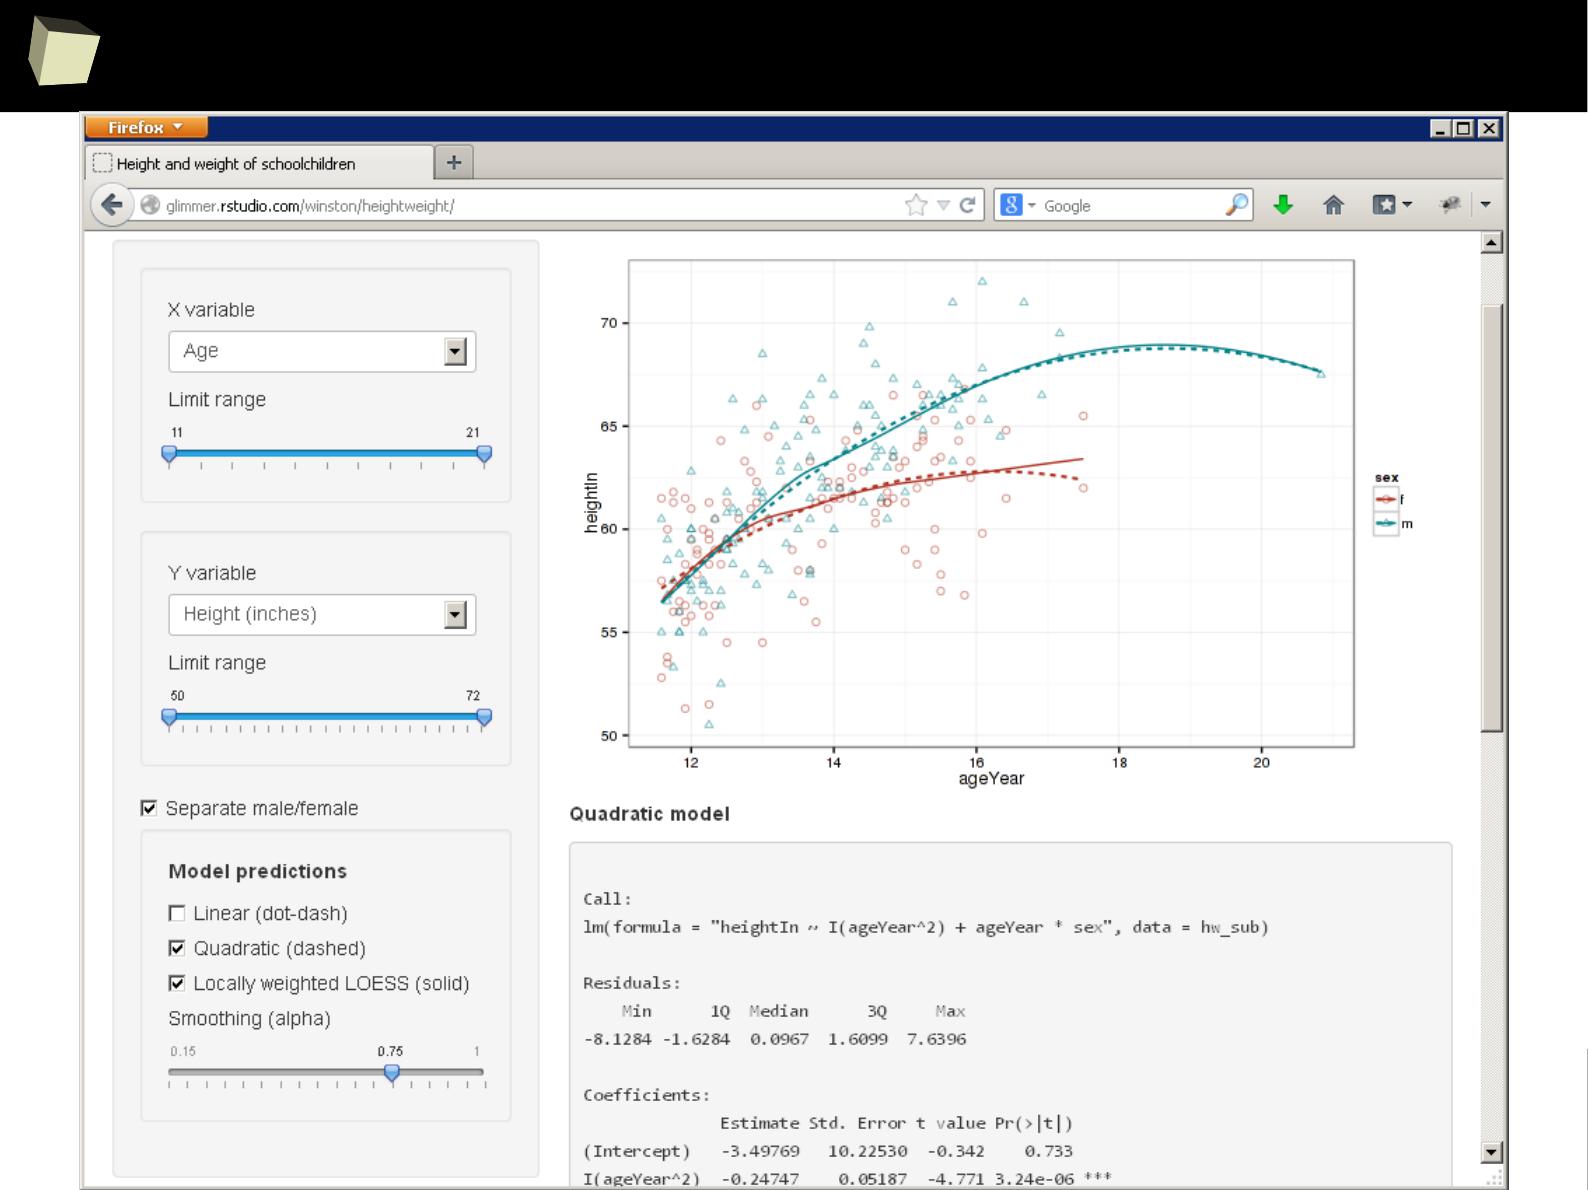
1
8
8
easy
(but shining)
web applications with R and Shiny
1
8
9
some GUI hosted by R

1
9
0
13 reasons why you will love GNU R
I R is (extremely) cheap. In fact - it's free :)
II R has (extremely) wide range of capabilities
III R is (widely) supported by the world of science
IV R is supported by the community
V R is (increasingly) supported by the business
VI R is able to read data in many formats
VII Interoperability is easy to achieve
VIII R is truly cross-platform
IX R offers numerous ways of presenting data
X There are many possibilities to optimize the code
XI R is able to handle large amount of data
XII R has a set of fancy tools and IDEs
XII FDA accepted using R for drug trials!
1
9
1
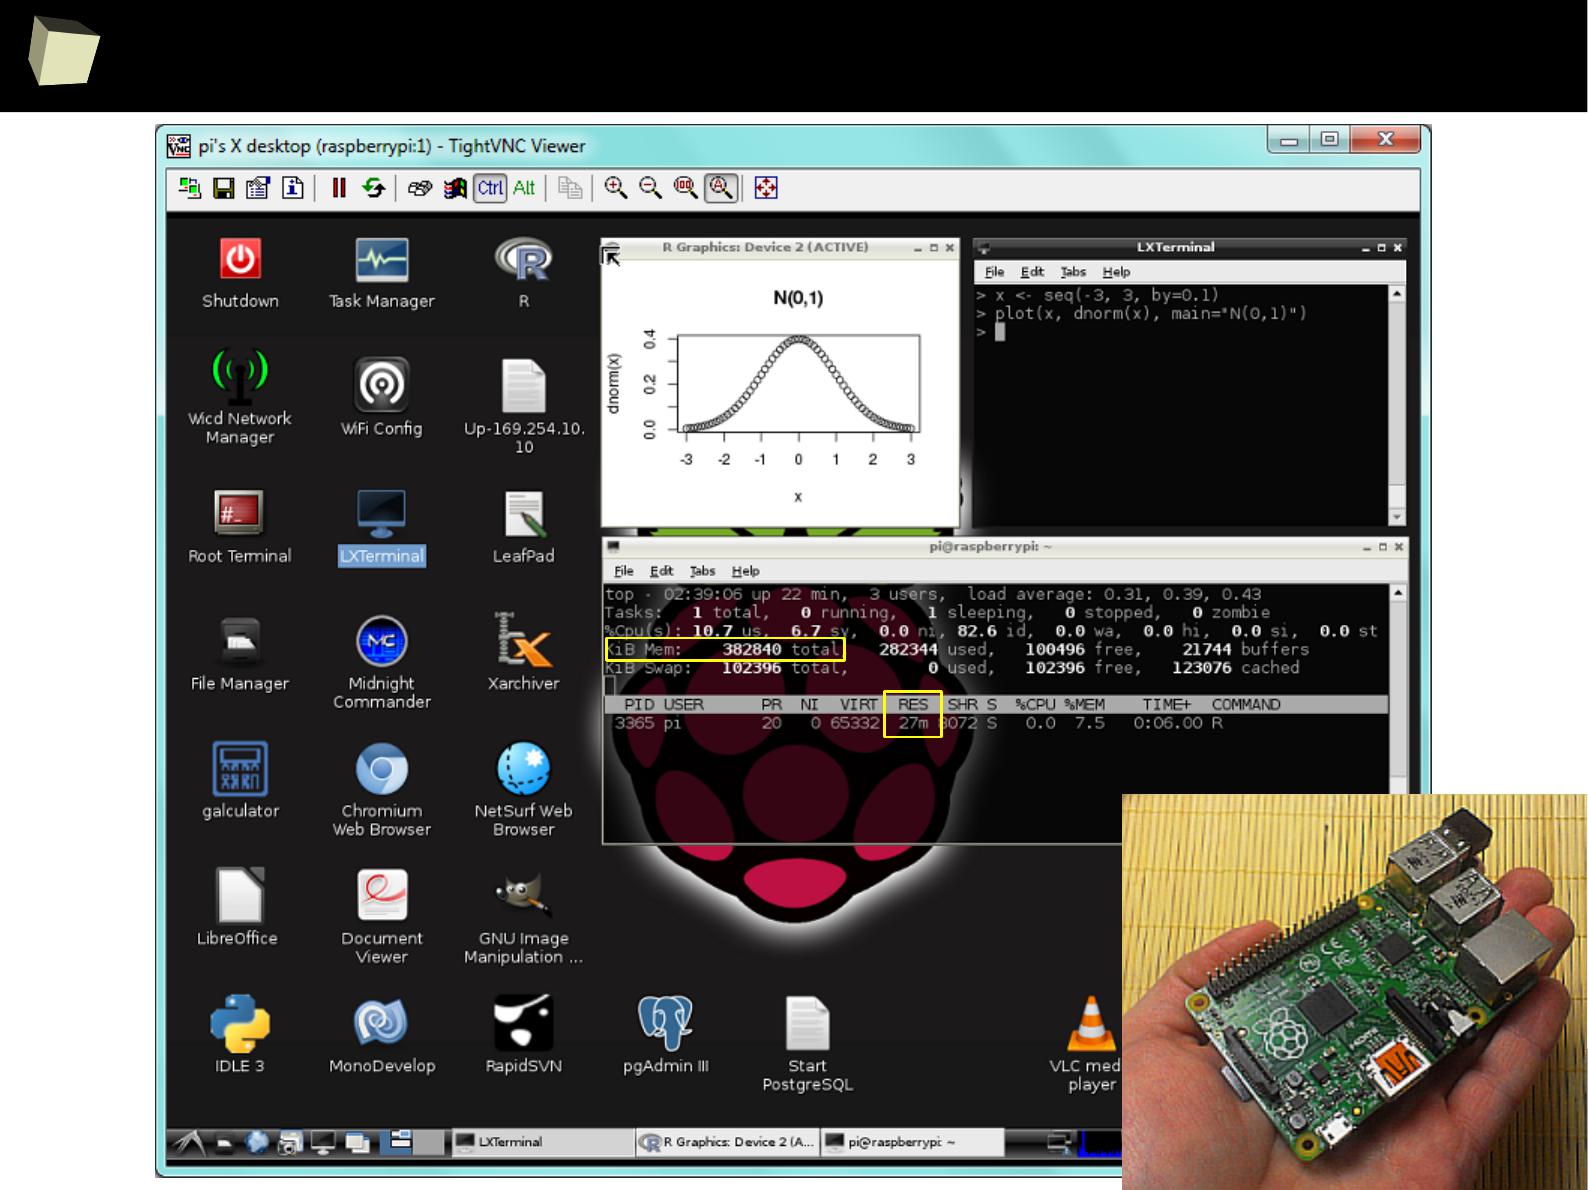
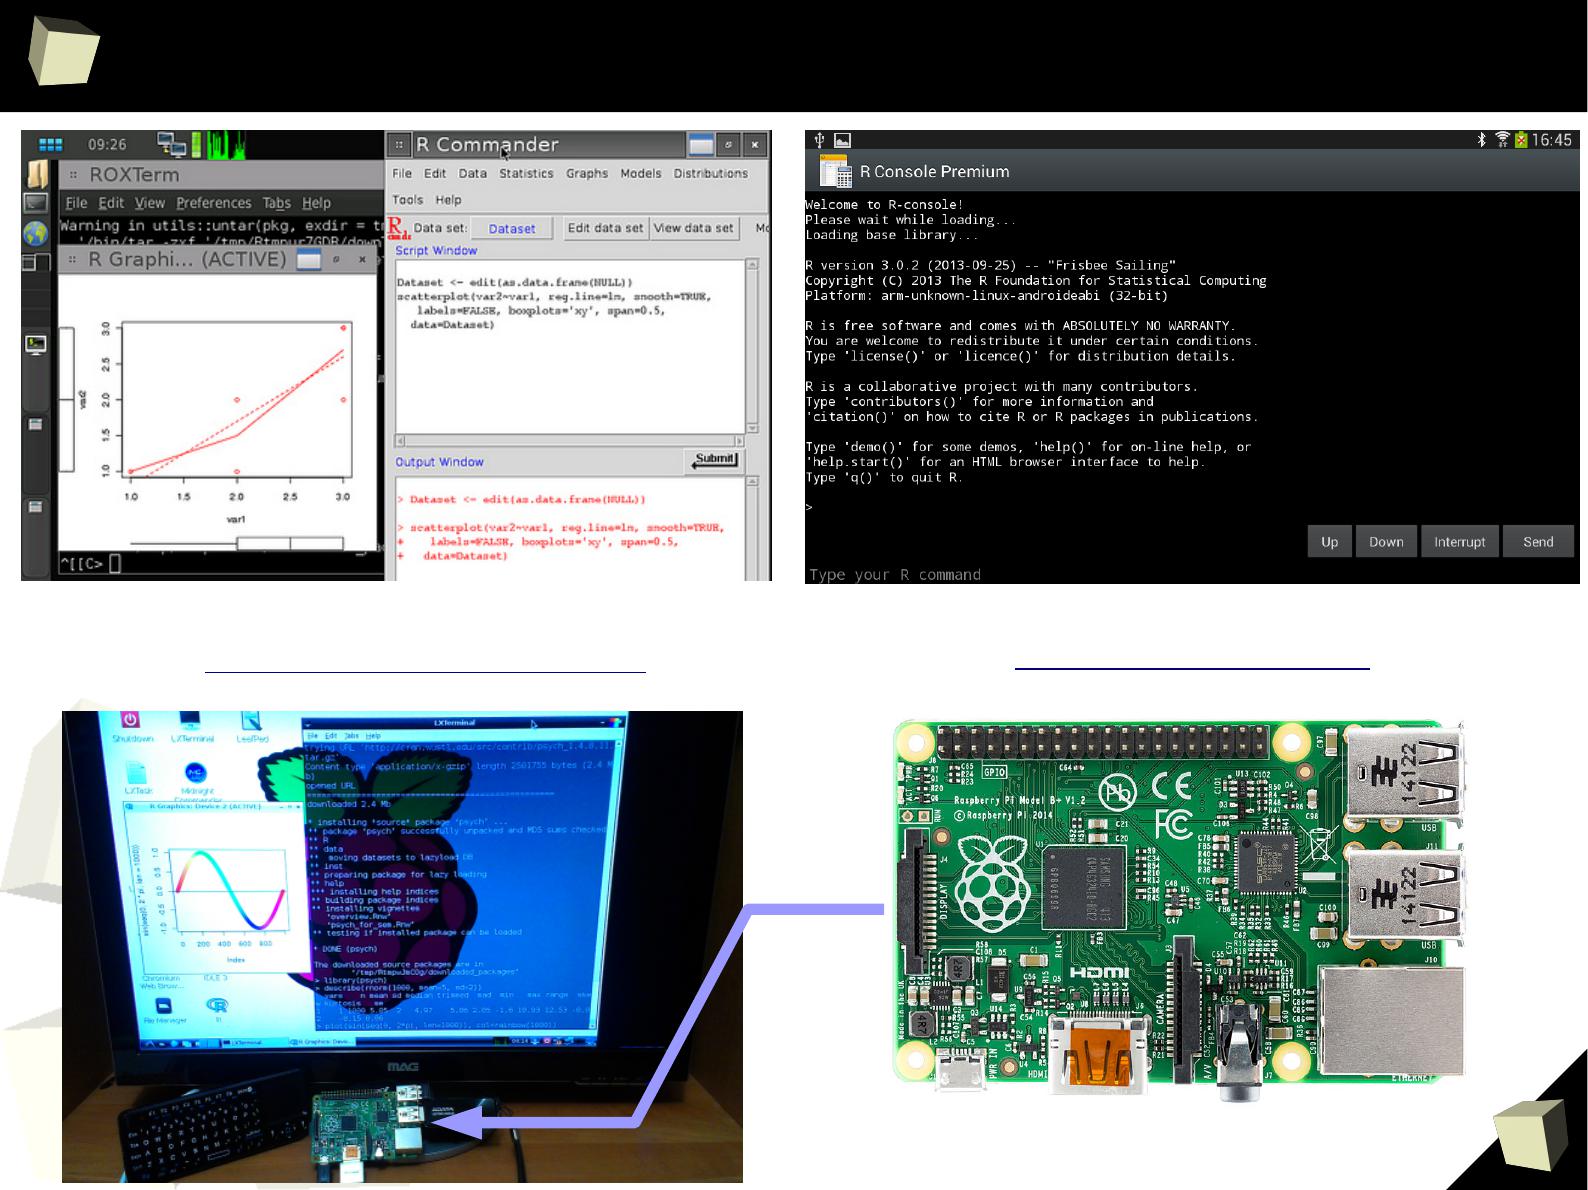
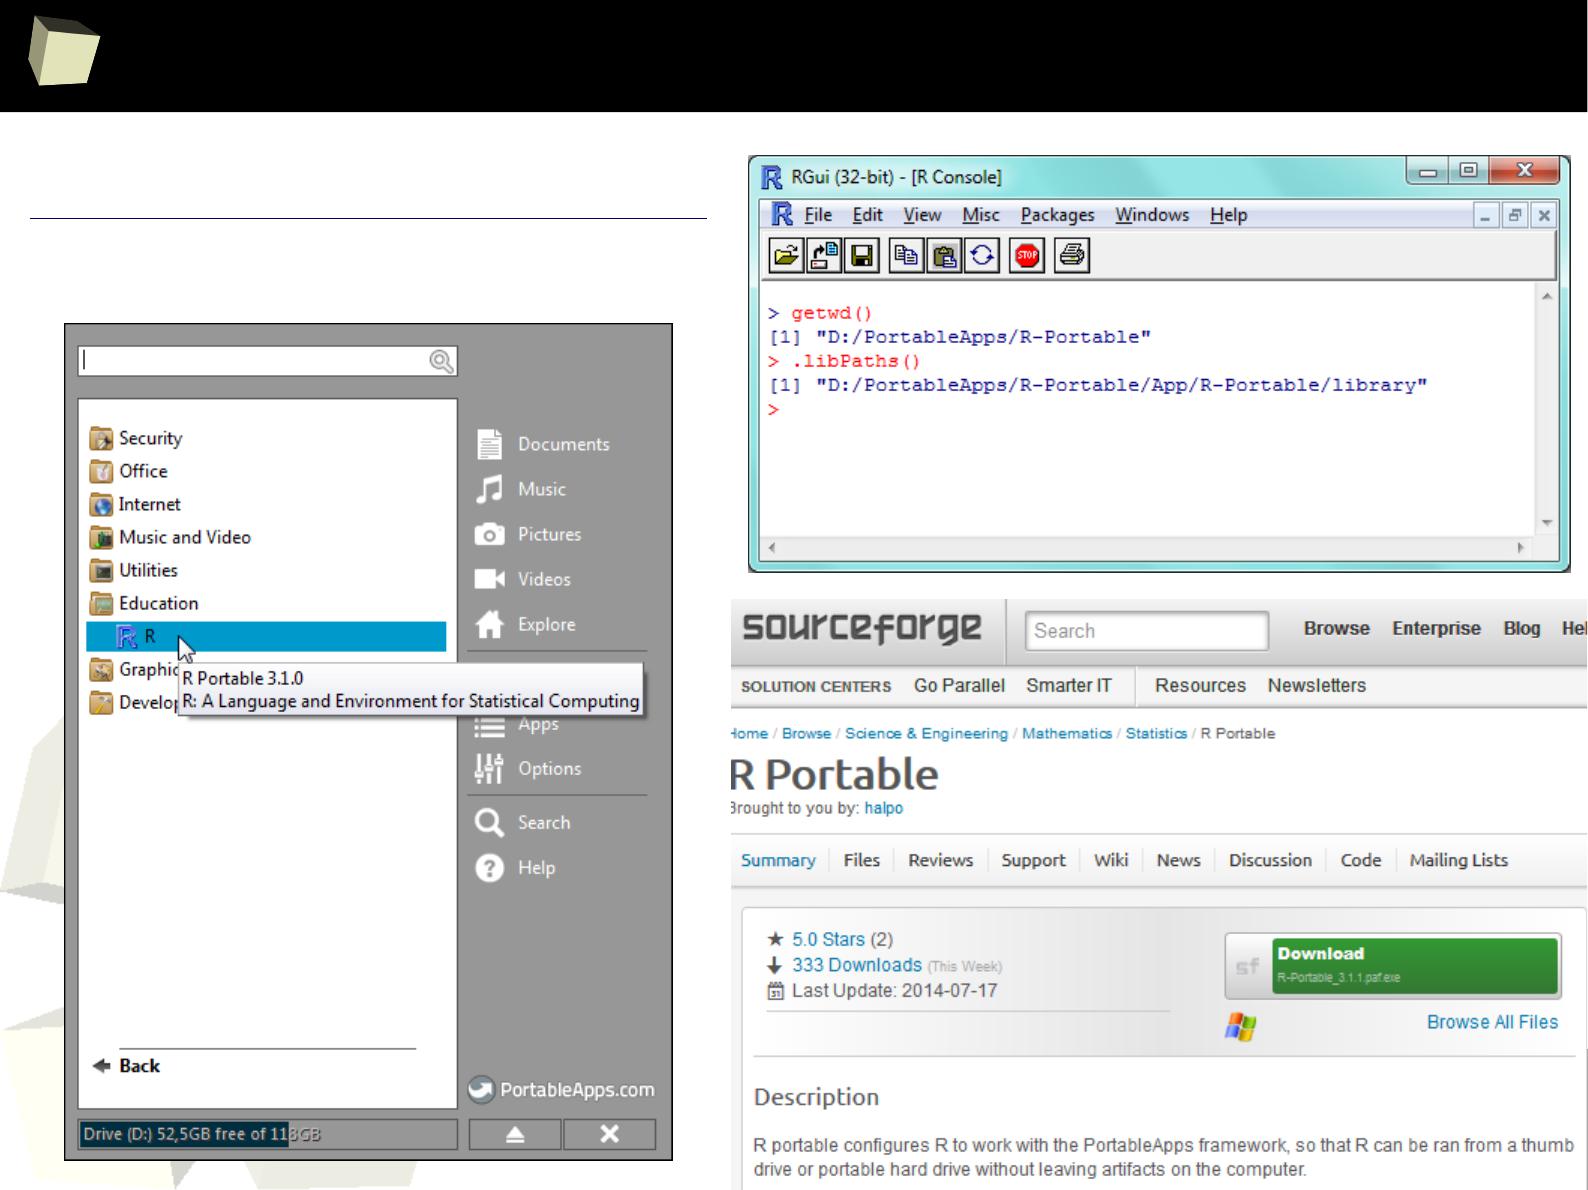
R is truly cRoss-platform
R can be run:
●
on many operating systems: Windows (95-8.1), Unix (Solaris, AIX, HP-UX),
Unix-like (GNU/Linux, FreeBSD), OSX and mobile: iOS, Android, Maemo
●
on minicomputers like RaspberryPi (Raspbian OS)
●
without installation, from any storage (USB device, CD/DVD, SD card)
portable
– just copy/paste the directory with R. You can have many versions of it.
Those properties make R an ideal base for creating:
●
Handy, self-contained tools used by CRO's Data Management and
Biometrics departments for easy monitoring the quality of collected data.
●
Cheap, easy to deliver and backup (copy/paste) computing environments
/free Linux + R + RStudio + PostgreSQL/MySQL + SVN + TrueCrypt + OpenVPN + VNC + rsync + Apache /
●
Independent computing units based on simplified minicomputers.
1
9
2
GNU/Debian “Wheezy”
1
9
3
R and fRiends on Debian “Stretch”
1
9
4
MacOS / OS X
1
9
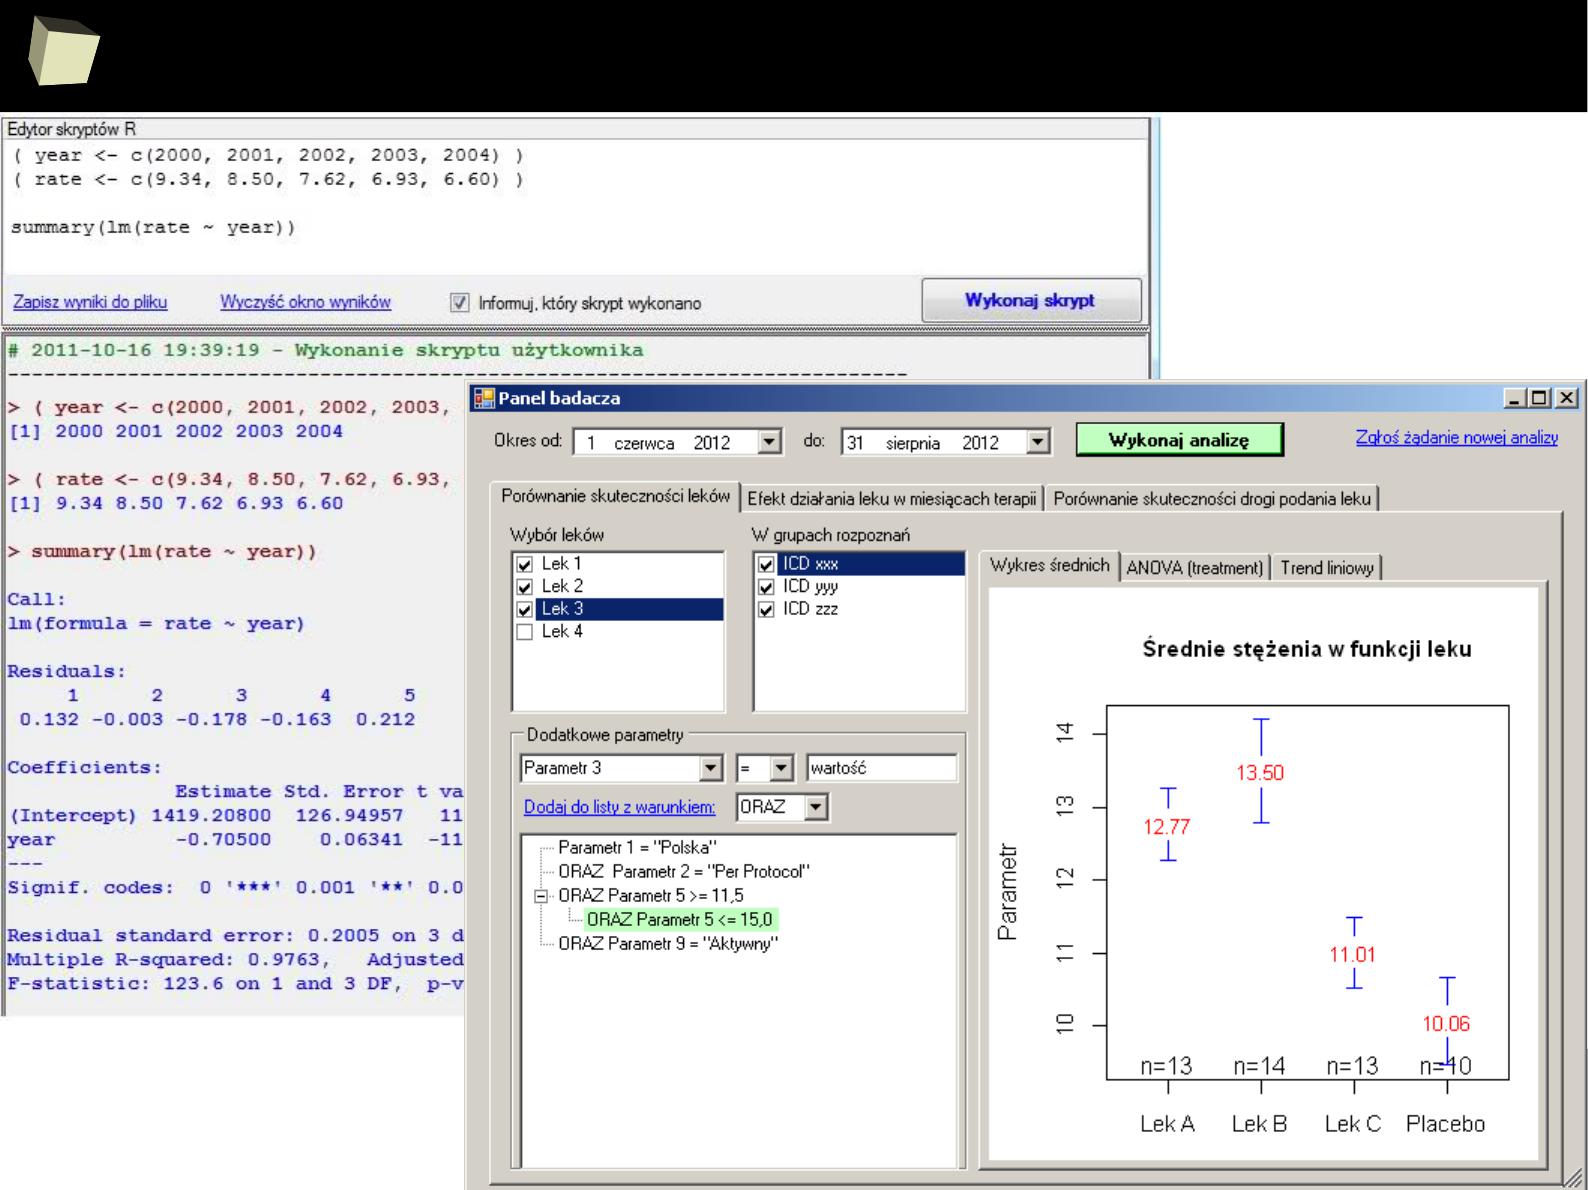
7
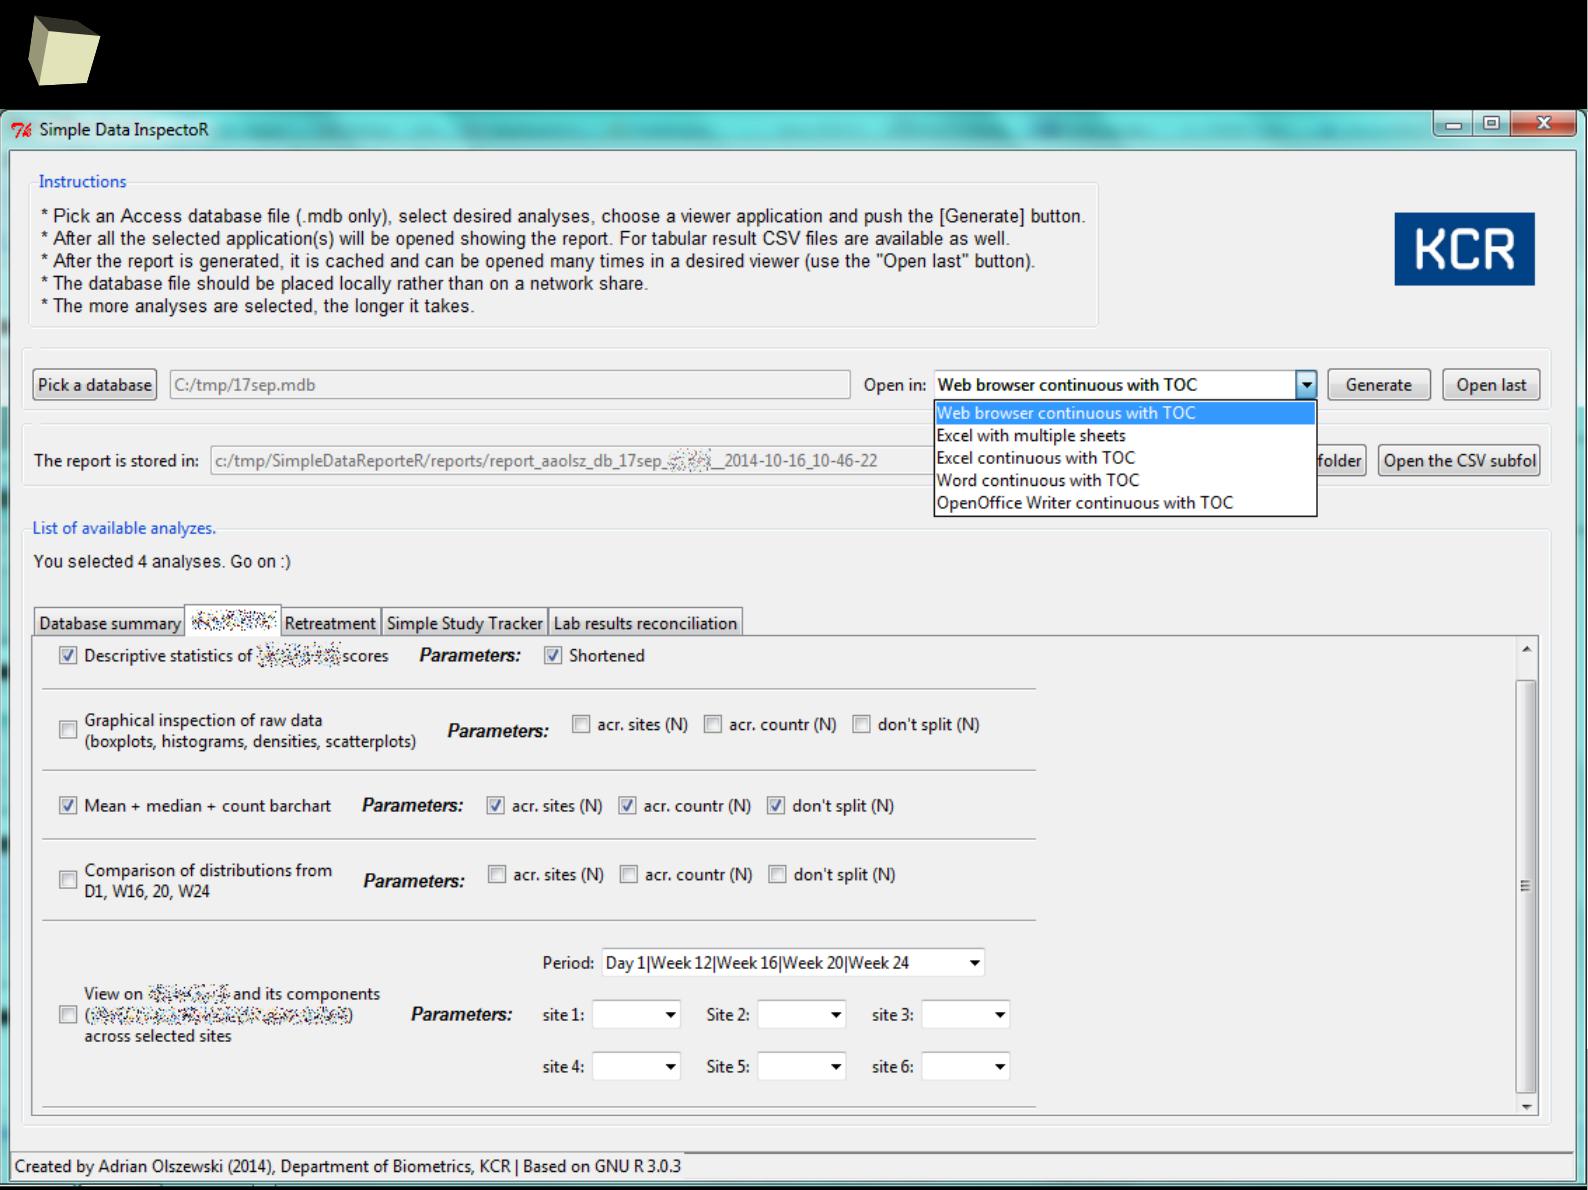
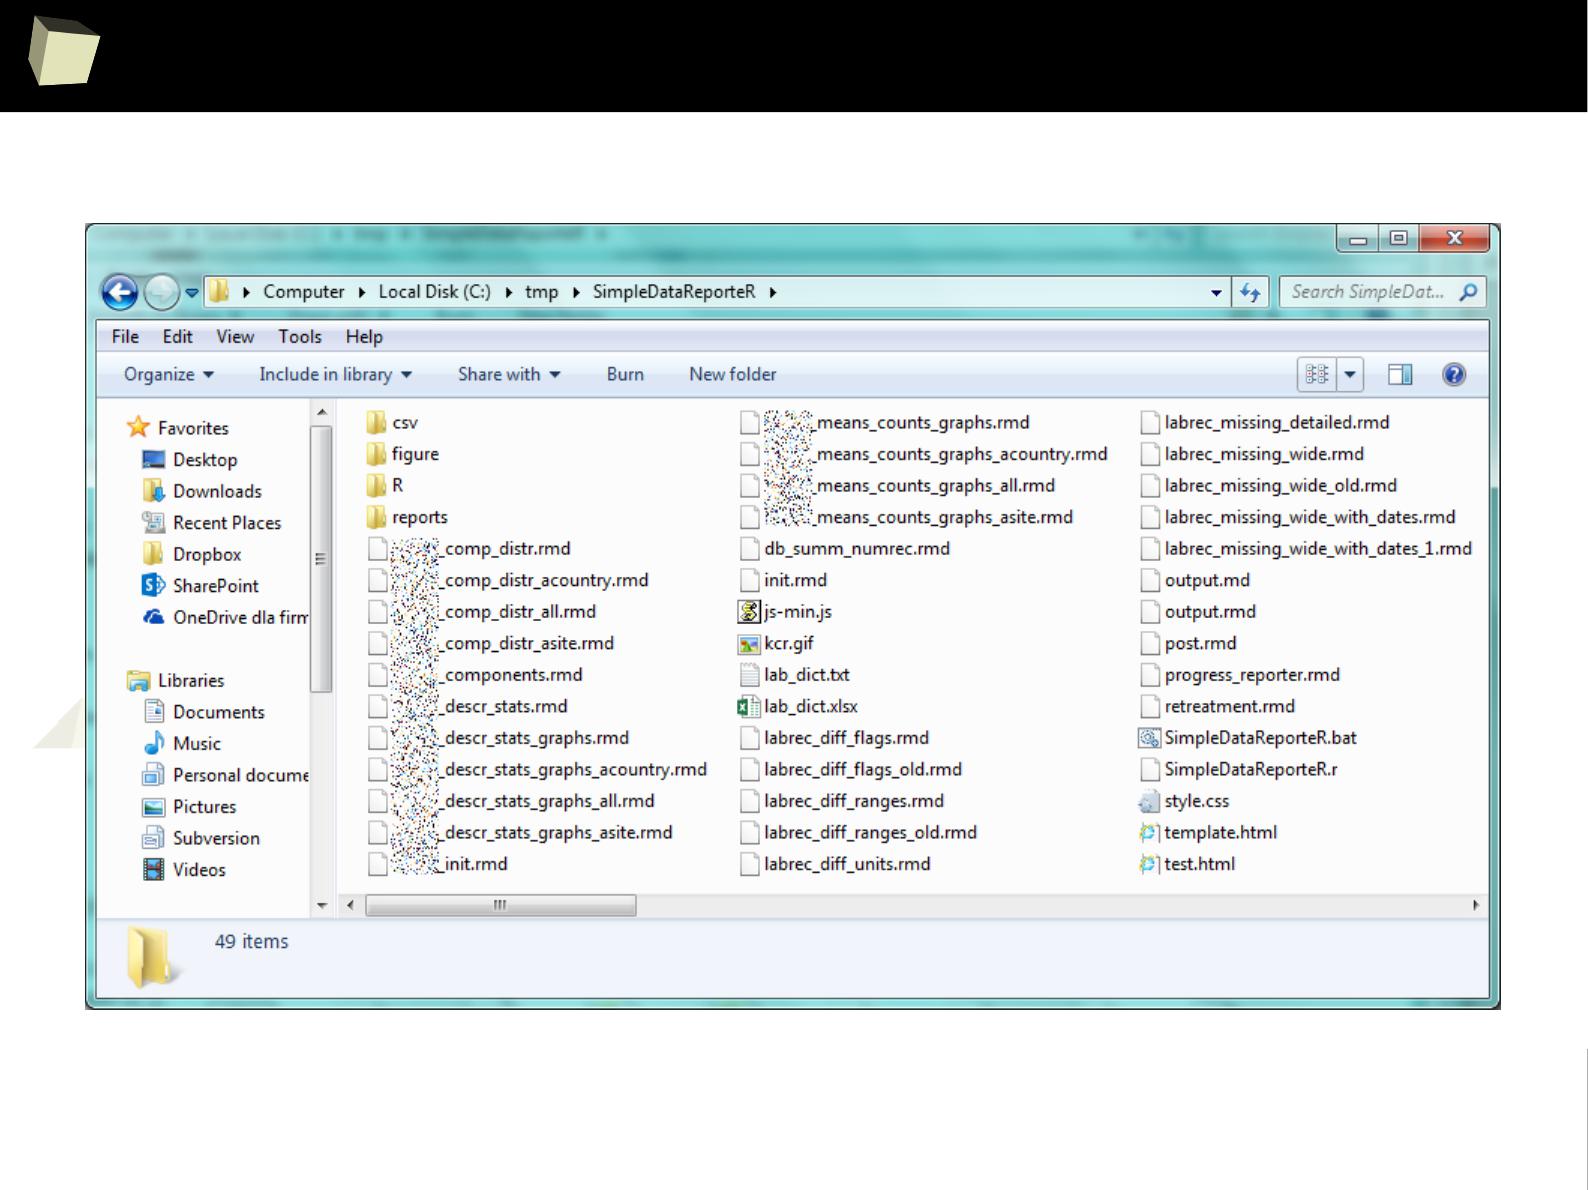
PoRtable in use – Simple Data InspectoR
1
9
8
♫
...
all you need is R
♫
Complete application: ~240MB raw,
~140MB after compression

1
9
9
13 reasons why you will love GNU R
I R is (extremely) cheap. In fact - it's free :)
II R has (extremely) wide range of capabilities
III R is (widely) supported by the world of science
IV R is supported by the community
V R is (increasingly) supported by the business
VI R is able to read data in many formats
VII Interoperability is easy to achieve
VIII R is truly cross-platform
IX R offers numerous ways of presenting data
X There are many possibilities to optimize the code
XI R is able to handle large amount of data
XII R has a set of fancy tools and IDEs
XII FDA accepted using R for drug trials!

2
0
0
It's showtime!
R can produce output in a rich set of formats, such as:
●
pictures: JPG, PNG, BMP, GIF, TIFF, SVG, EMF
●
animations: GIF
directly or via ImageMagic
, AVI
via Ffmpeg
●
plain text files: CSV, TSV, XML, XPT (SAS transport files), ASCII
●
rich format docs: RTF, PS, PDF, MS Word (*.doc; *.docx
OpenXML
),
Open/Libre Office Writer (*.odt
OpenDocument
)
●
spreadsheets: MS Excel (*.xls; *.xlsx), OpenOffice Calc (*.ods)
●
HTML pages: simple pages, complex reports or presentations
●
HTML files can be easily read by Word and Excel. Tables,
paragraphs, and styles are preserved
●
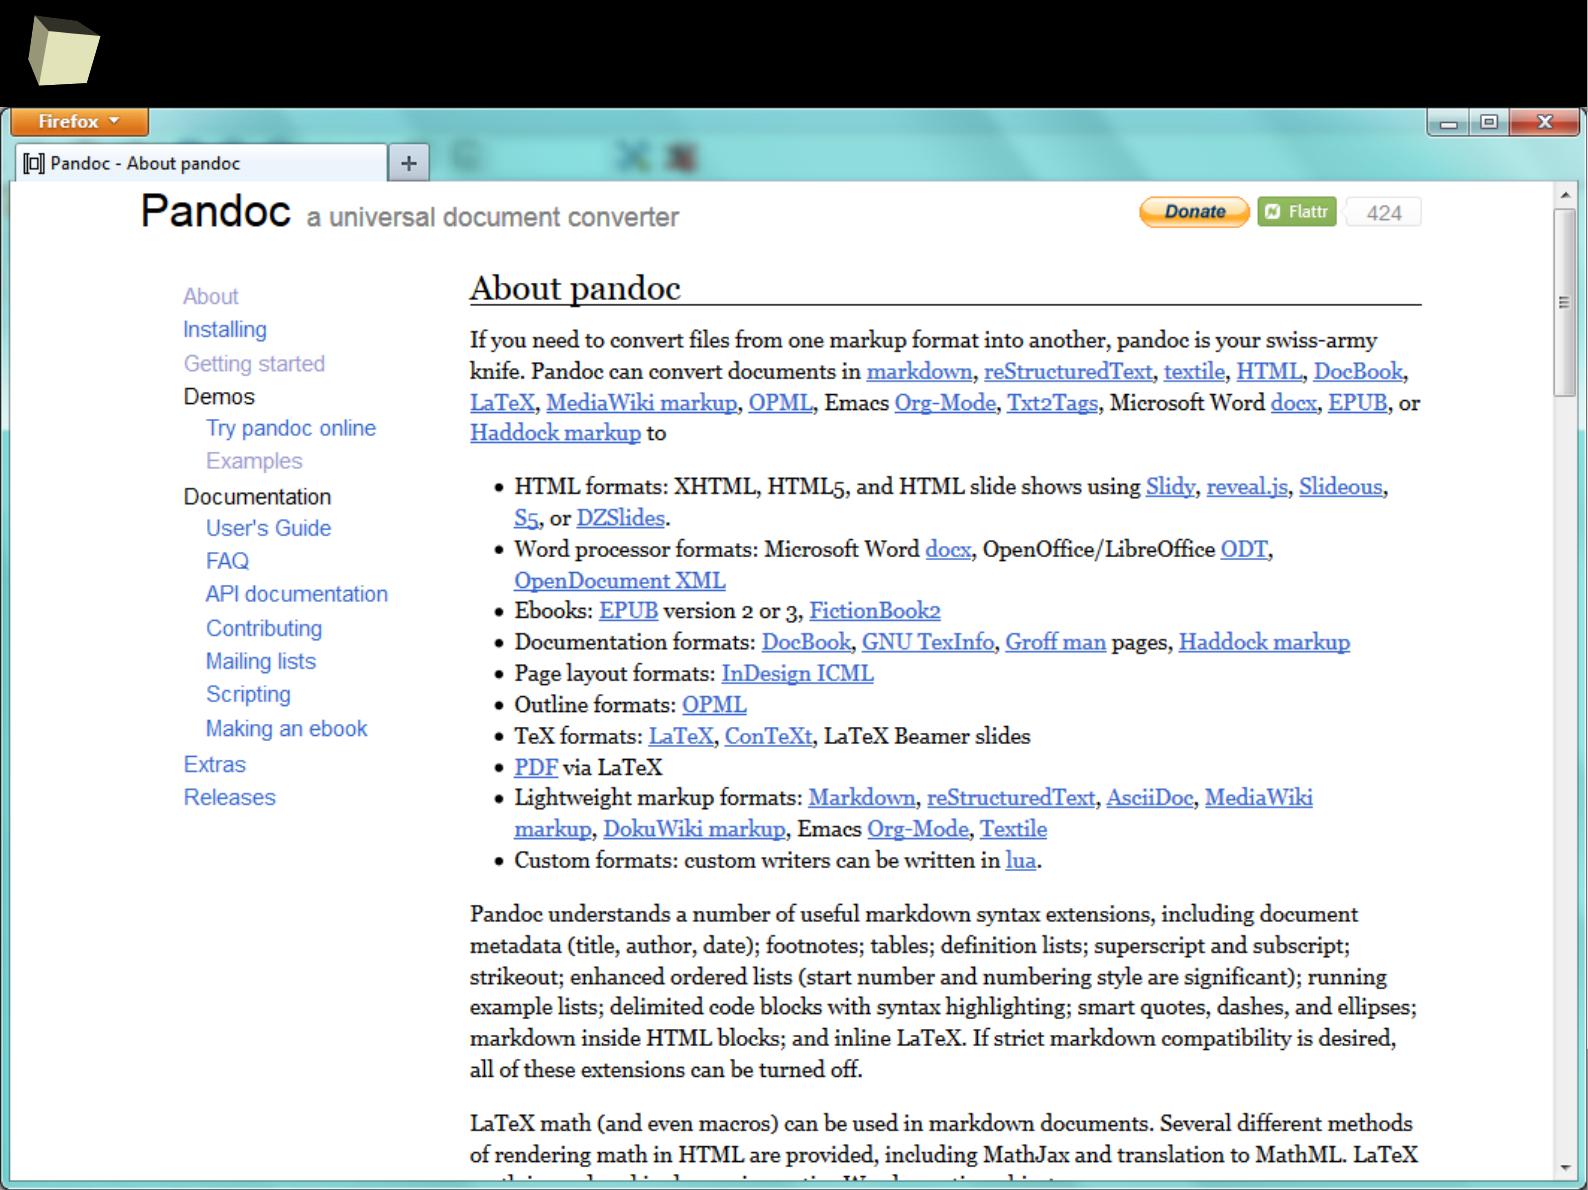
HTML is convertible to many other formats via pandoc
●
There is a way to obtain multi-sheet Excel workbooks
●
R can also send the results to an external application via WebService
JSON

2
0
1
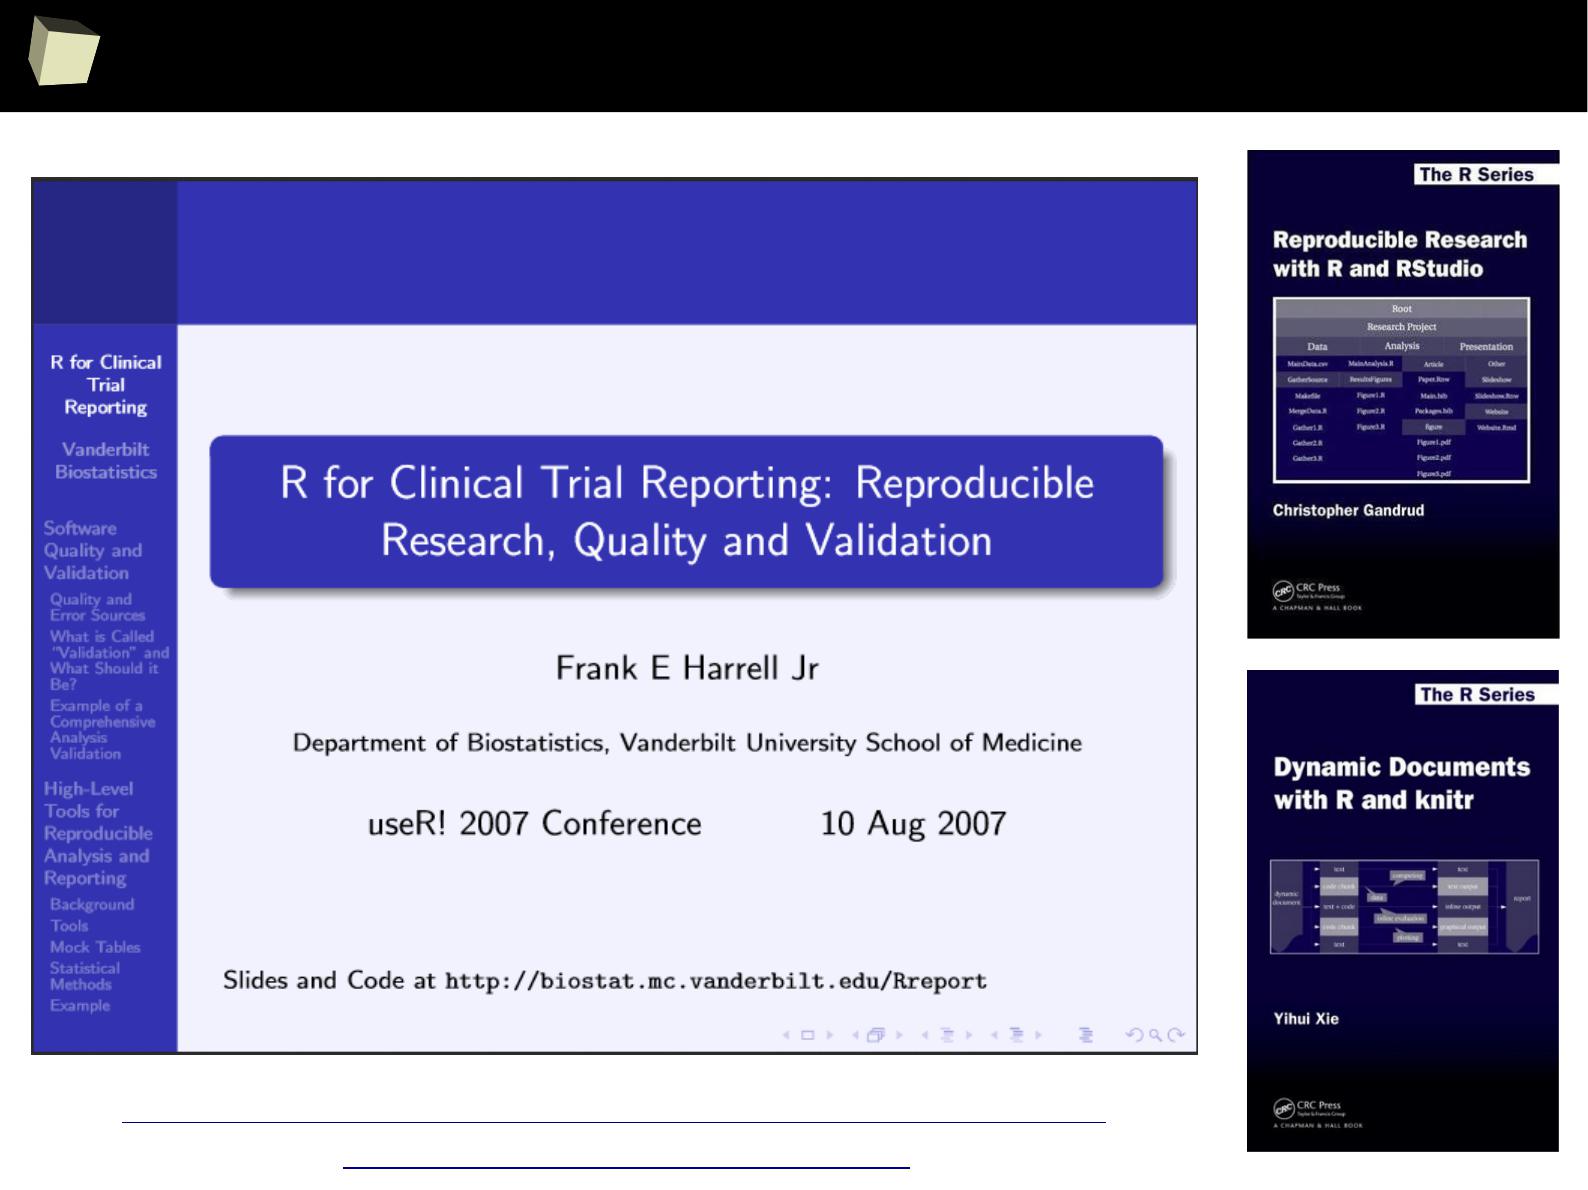
Reproducible Research
Definitions:
●
The goal of reproducible research is to tie specific instructions to data analysis
and experimental data so that scholarship can be recreated, better
understood and verified.
http://cran.r-project.org/web/views/ReproducibleResearch.html
●
The term reproducible research refers to the idea that the ultimate product of
academic research is the paper along with the full computational environment
used to produce the results in the paper such as the code, data, etc. that can
be used to reproduce the results and create new work based on the research.
http://en.wikipedia.org/wiki/Reproducibility#Reproducible_research

2
0
2
Reproducible Research
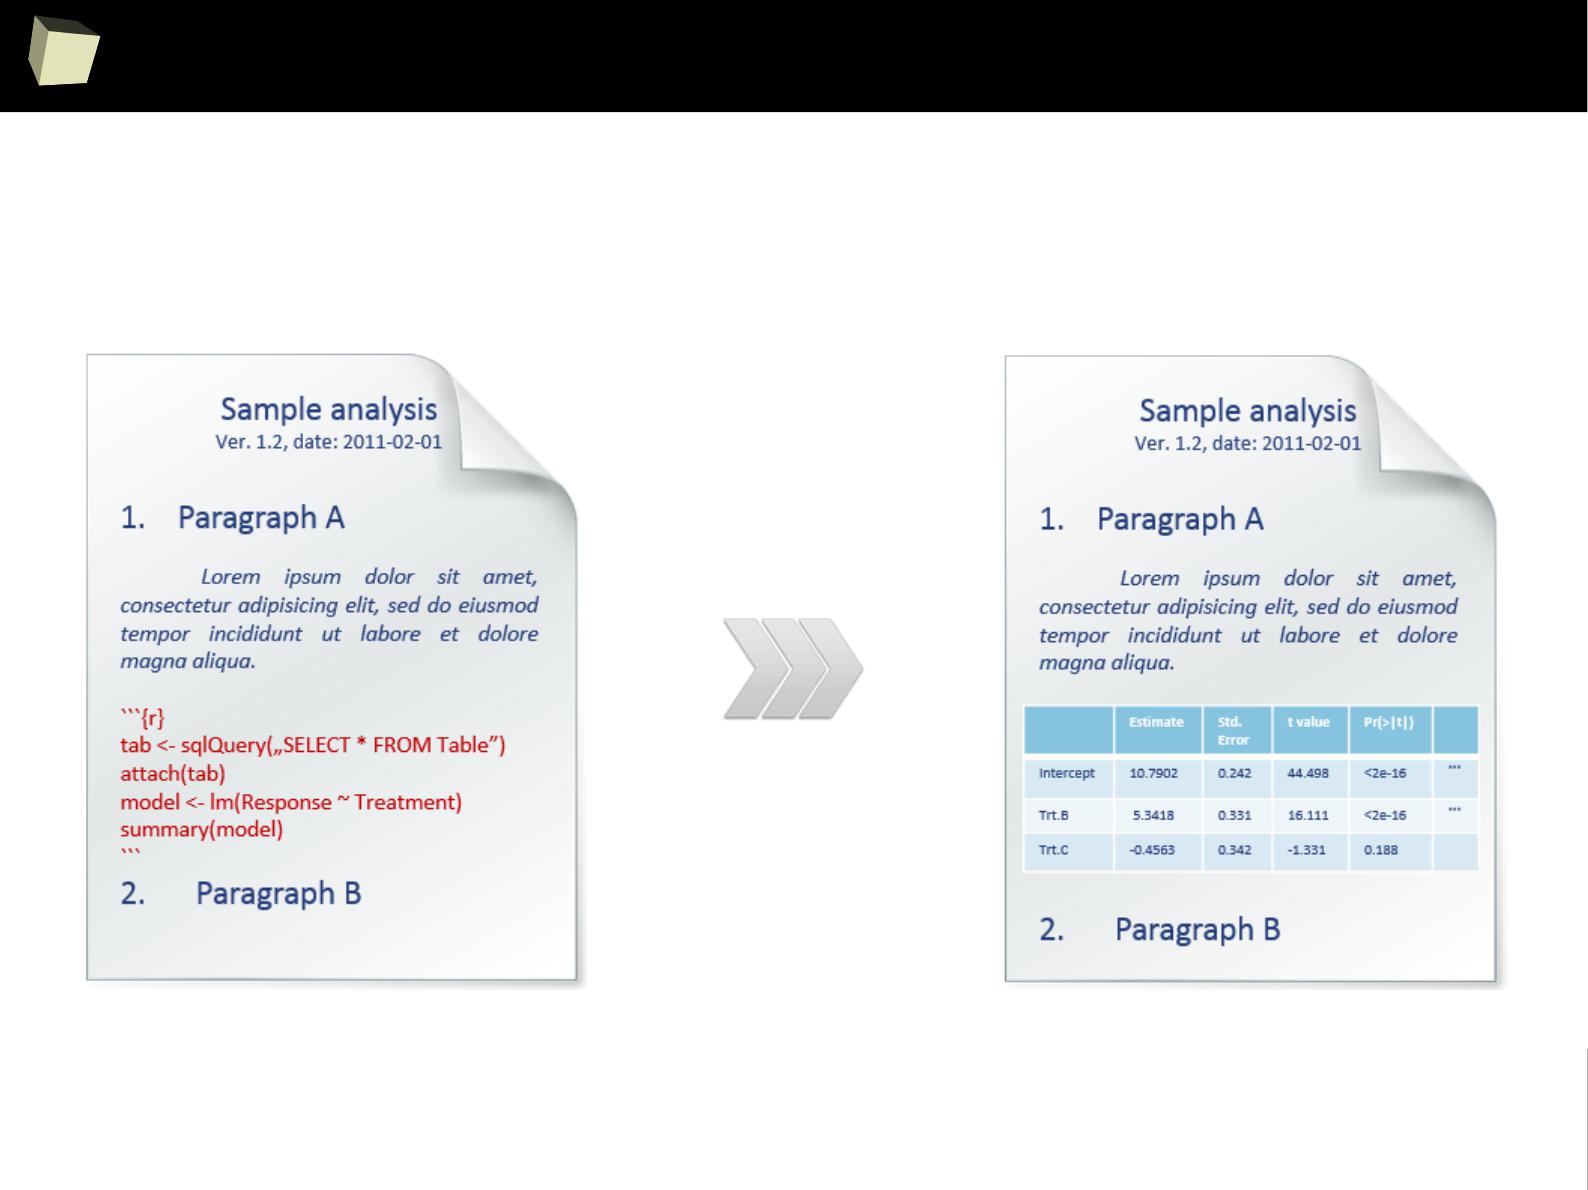
In simply words, documents are created from templates containing presentation
code (Markdown, HTML, LaTeX) or formatted paragraphs (MS Word, Open
Document, RTF) mixed with chunks of R code.
After the template is processed, chunks of R code are replaced with the result
they produce.
With this approach one can forget about continuous copying and pasting objects
(charts and tables) from the statistical package into a word processor.
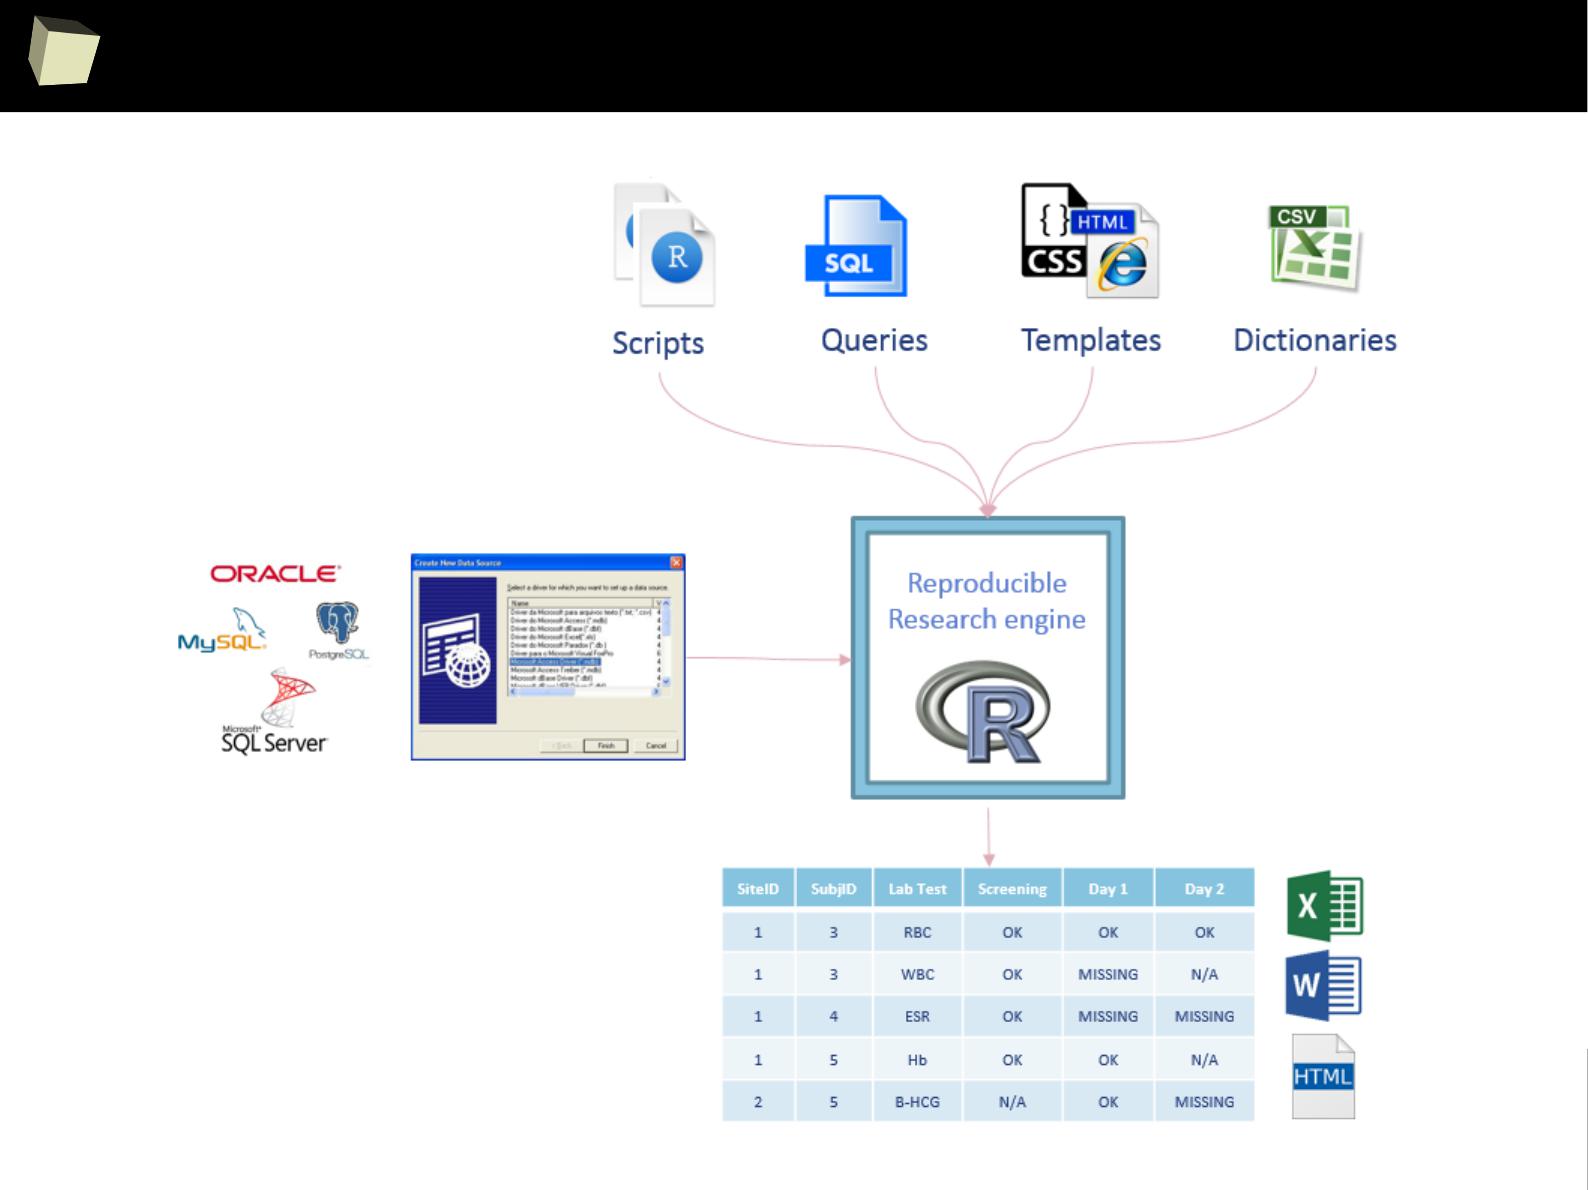
Such documents are self-contained in that, they are capable to perform alone all
the tasks required to complete rendering:
●
setup the environment (install required packages, apply configuration),
●
read data from the indicated sources or generate artificial datasets
●
analyze the retrieved data and produce output objects (tables, graphics)
2
0
3
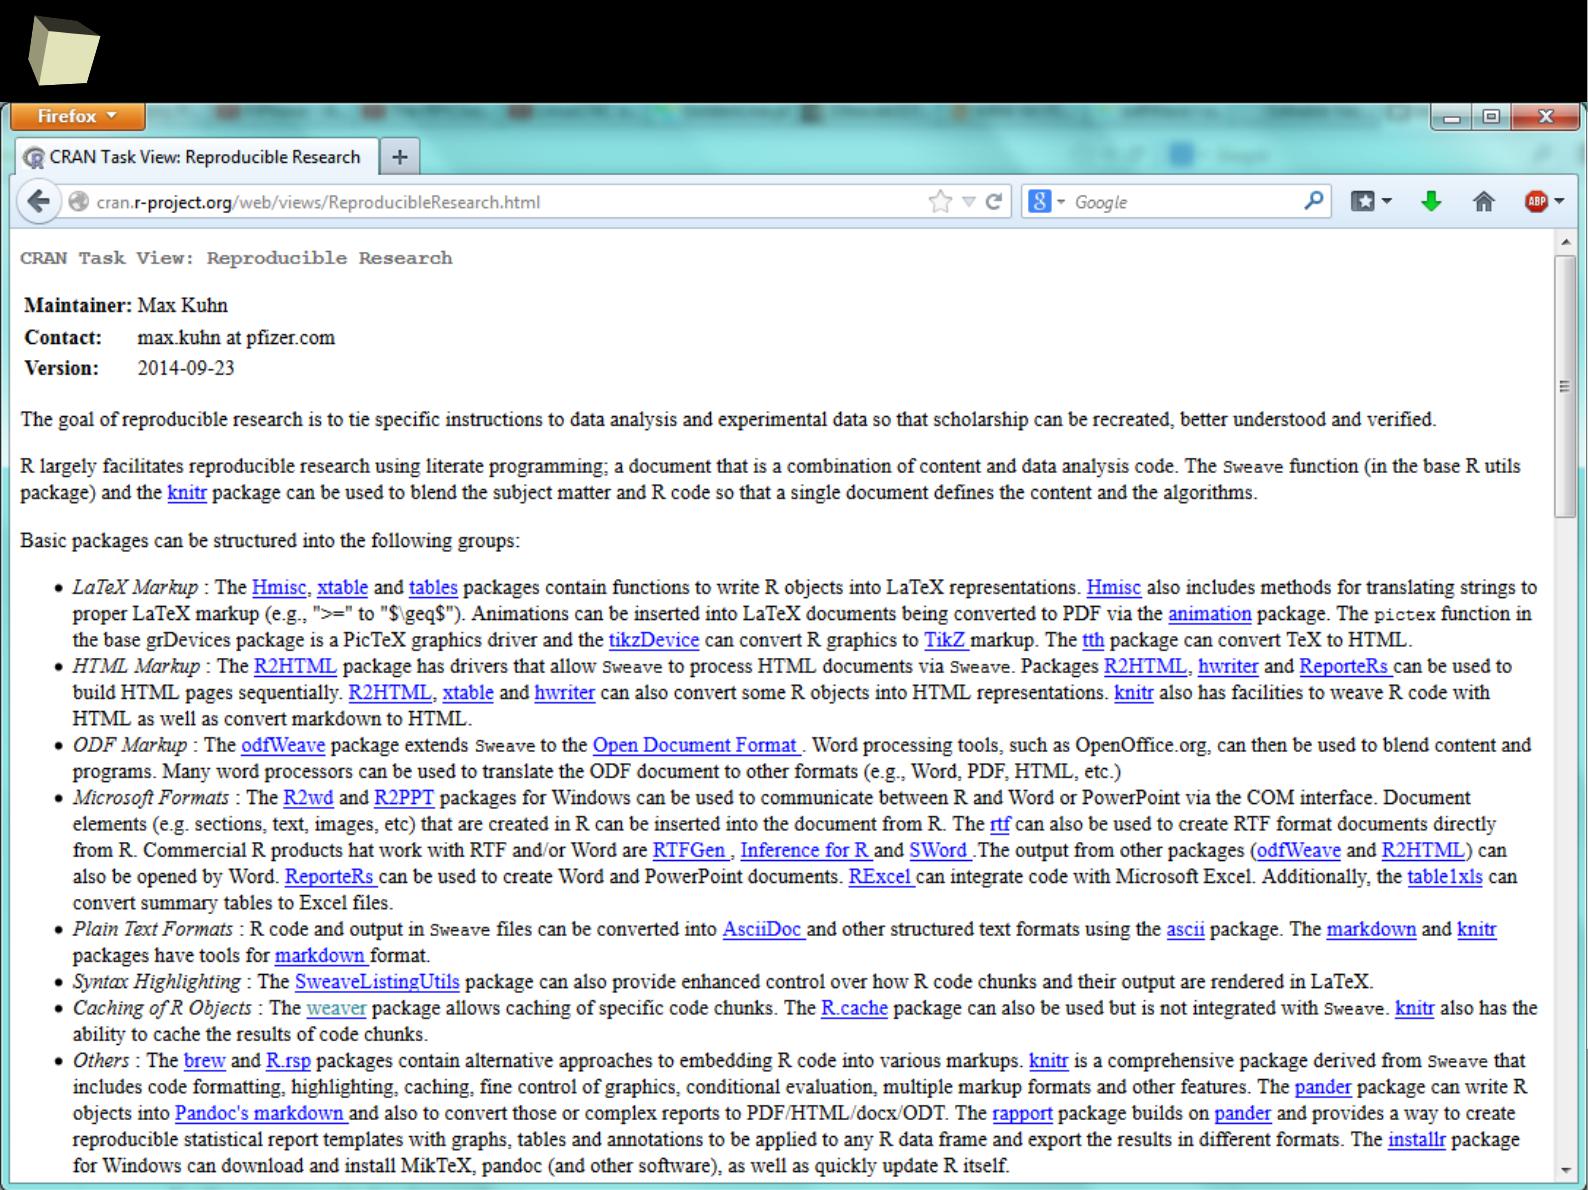
Reproducible Research
●
Knitr + pandoc
●
Sweave
●
OdfWeave
●
ReporteRs
2
0
4
Reproducible Research
2
0
6
Reproducible Research

2
0
7
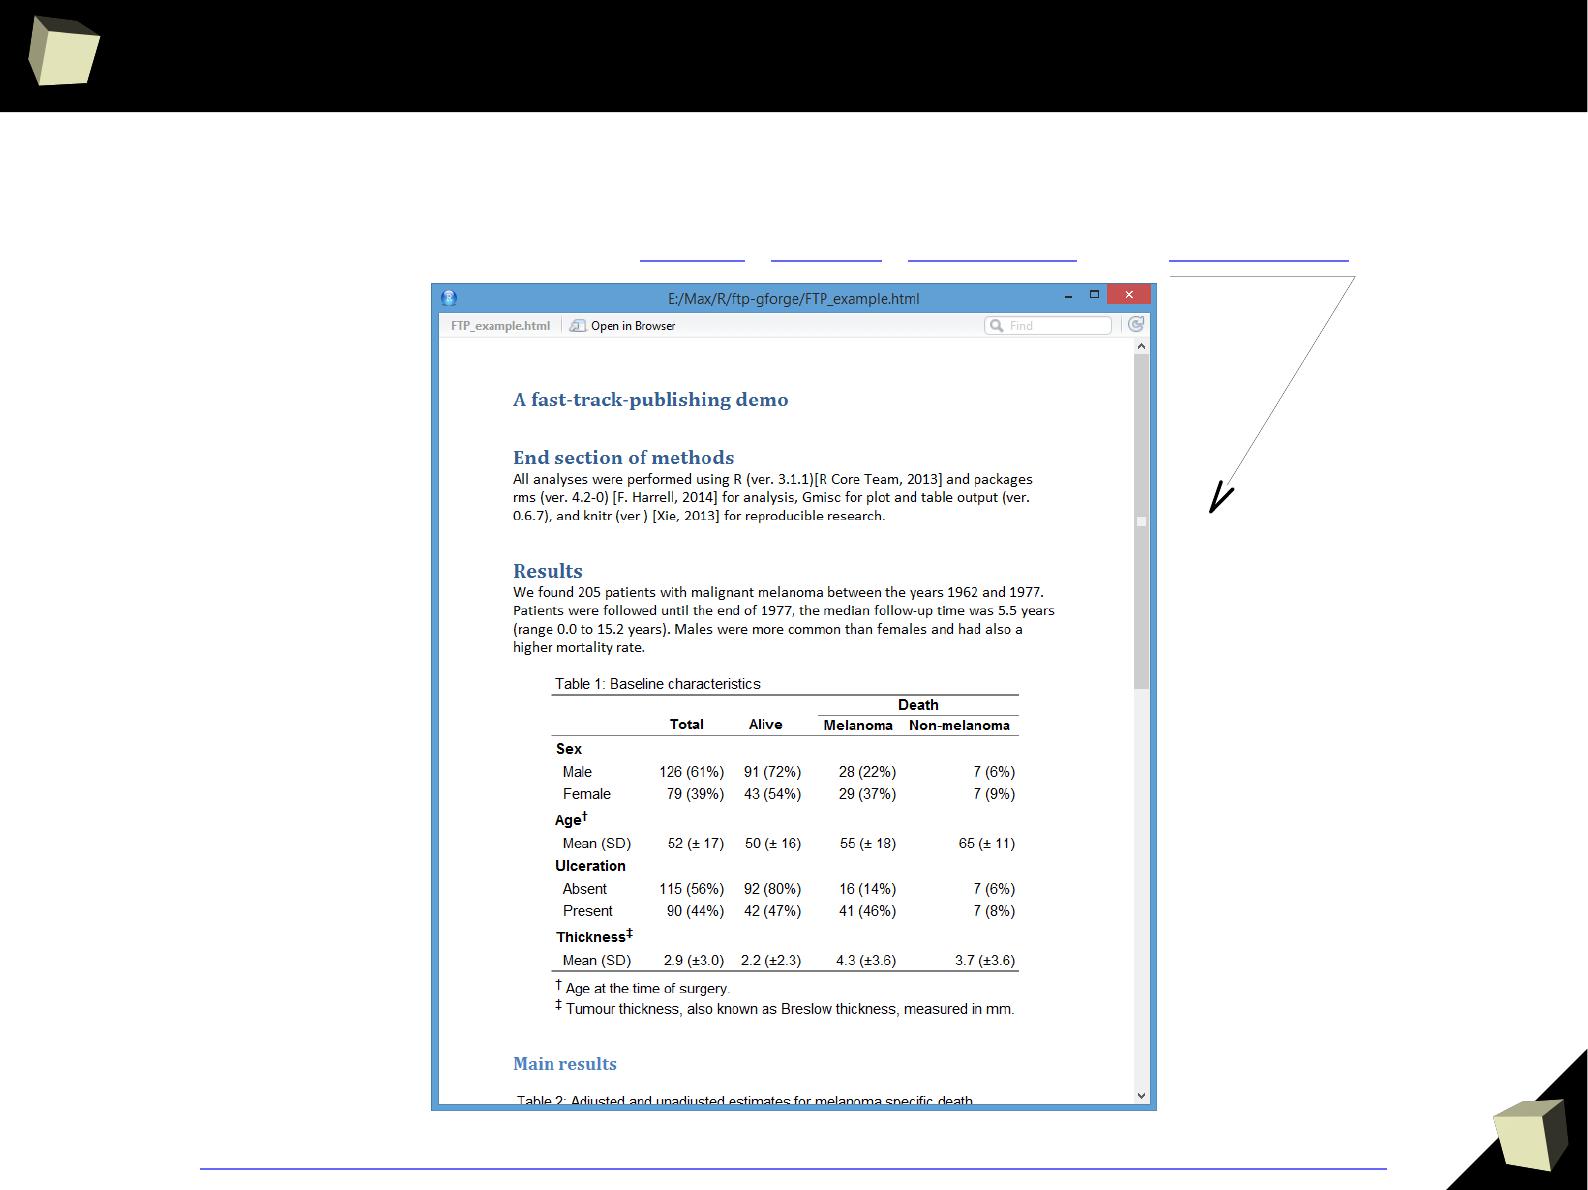
Reproducible Research – knitr and Sweave
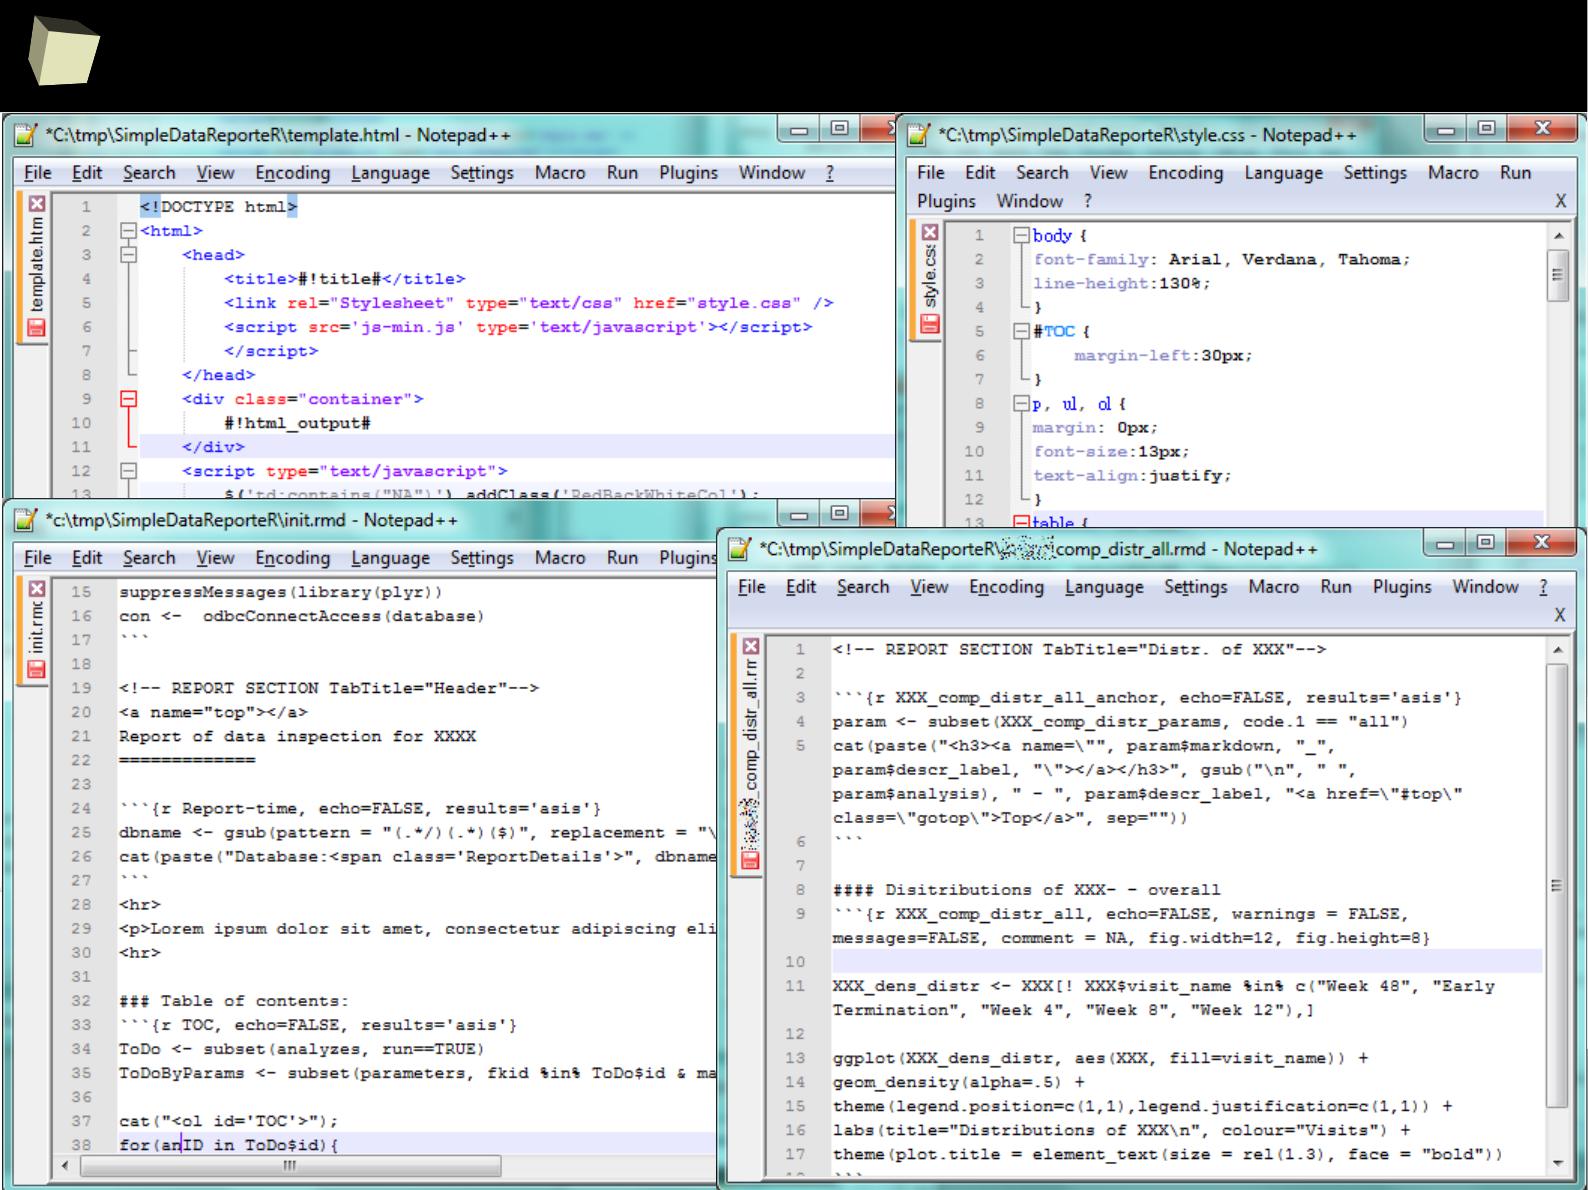
With HTML, Latex, R Markdown, xtable and CSS processed by Sweave or knitr
and (optionaly) pandoc, one can produce complex, professionally looking and
reproducible reports in various formats, e.g. DOCX, ODT, HTML, RTF and PDF.
This R-scripts-driven approach might seem a bit complicated, but it gives the
user maximum flexibility and control over how the final product will look like.
HTML and CSS WYSIWYG editors are useful here.
Chunks of R code may be saved into named sub-reports for later reuse in many
places in the template. They can be turned on/off depending on the result of a
conditional expression.
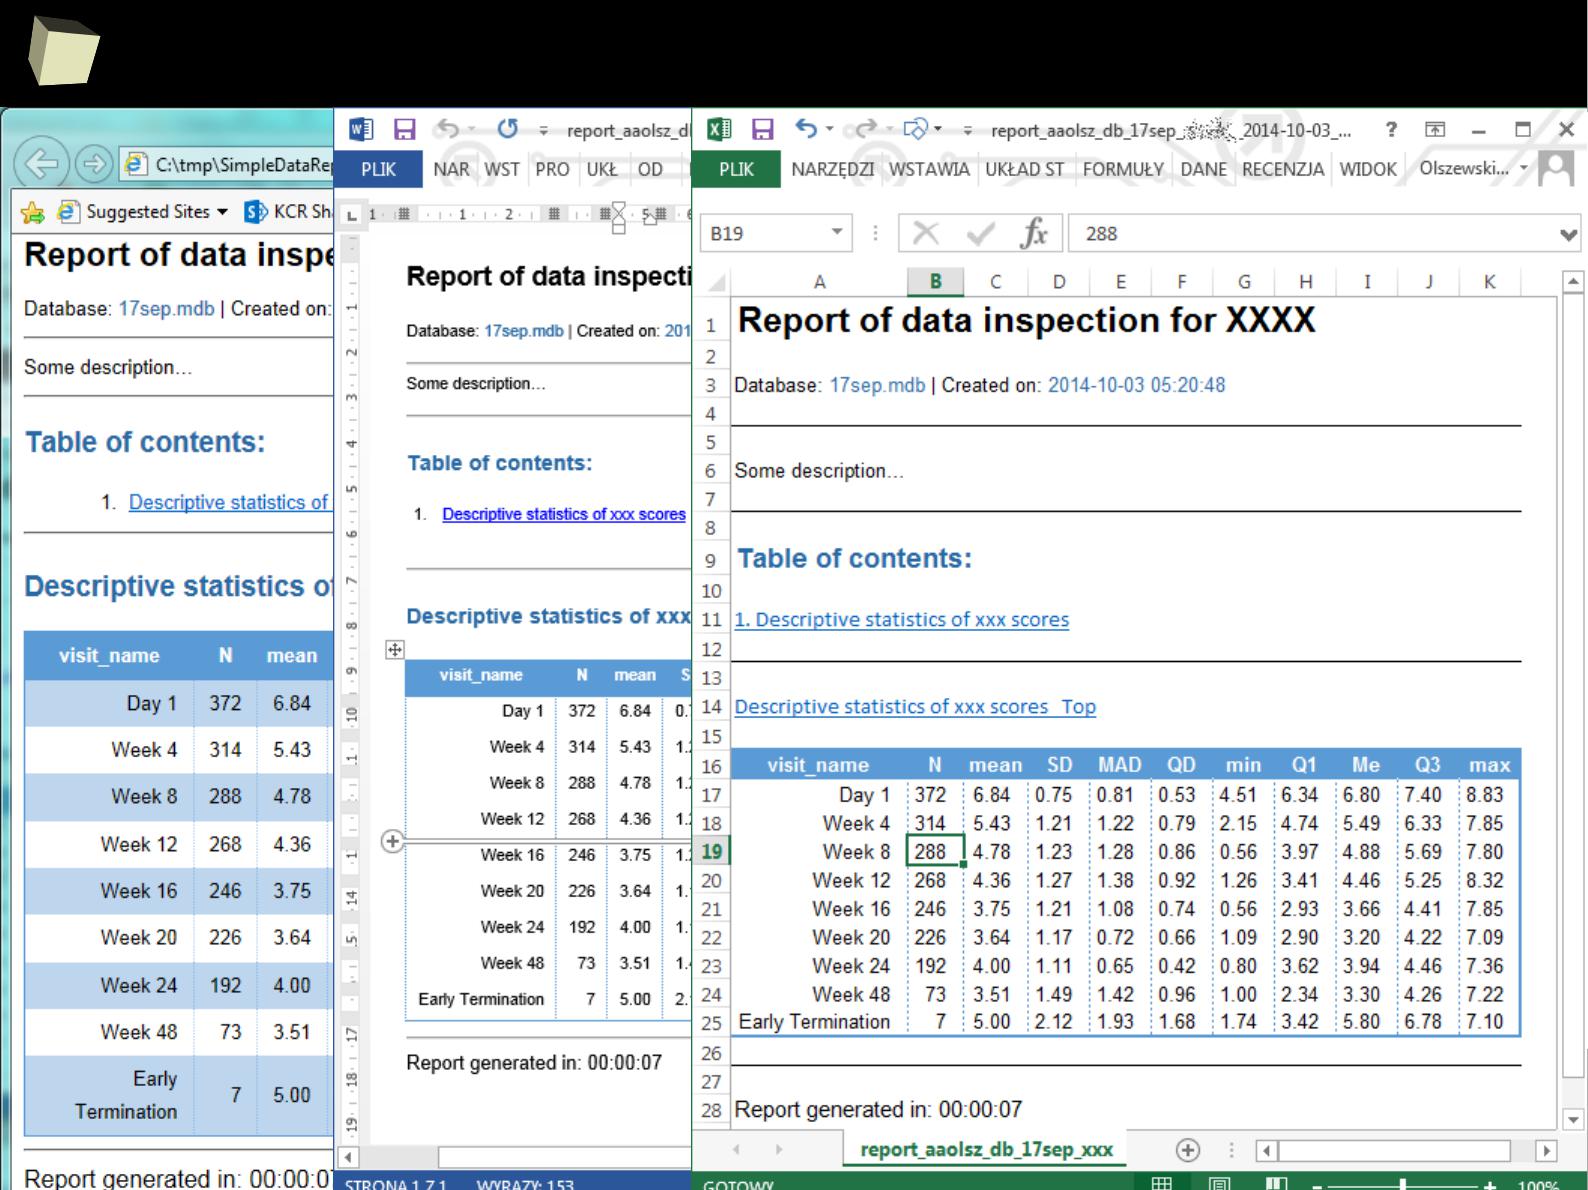
Produced HTML file can be displayed in a web browser, opened directly in a
word processor or spreadsheet or converted to another format (DOCX, PDF).
This is a perfect tool for automated generation of reports or record the flow of
analyses (= R code along with results).
2
0
8
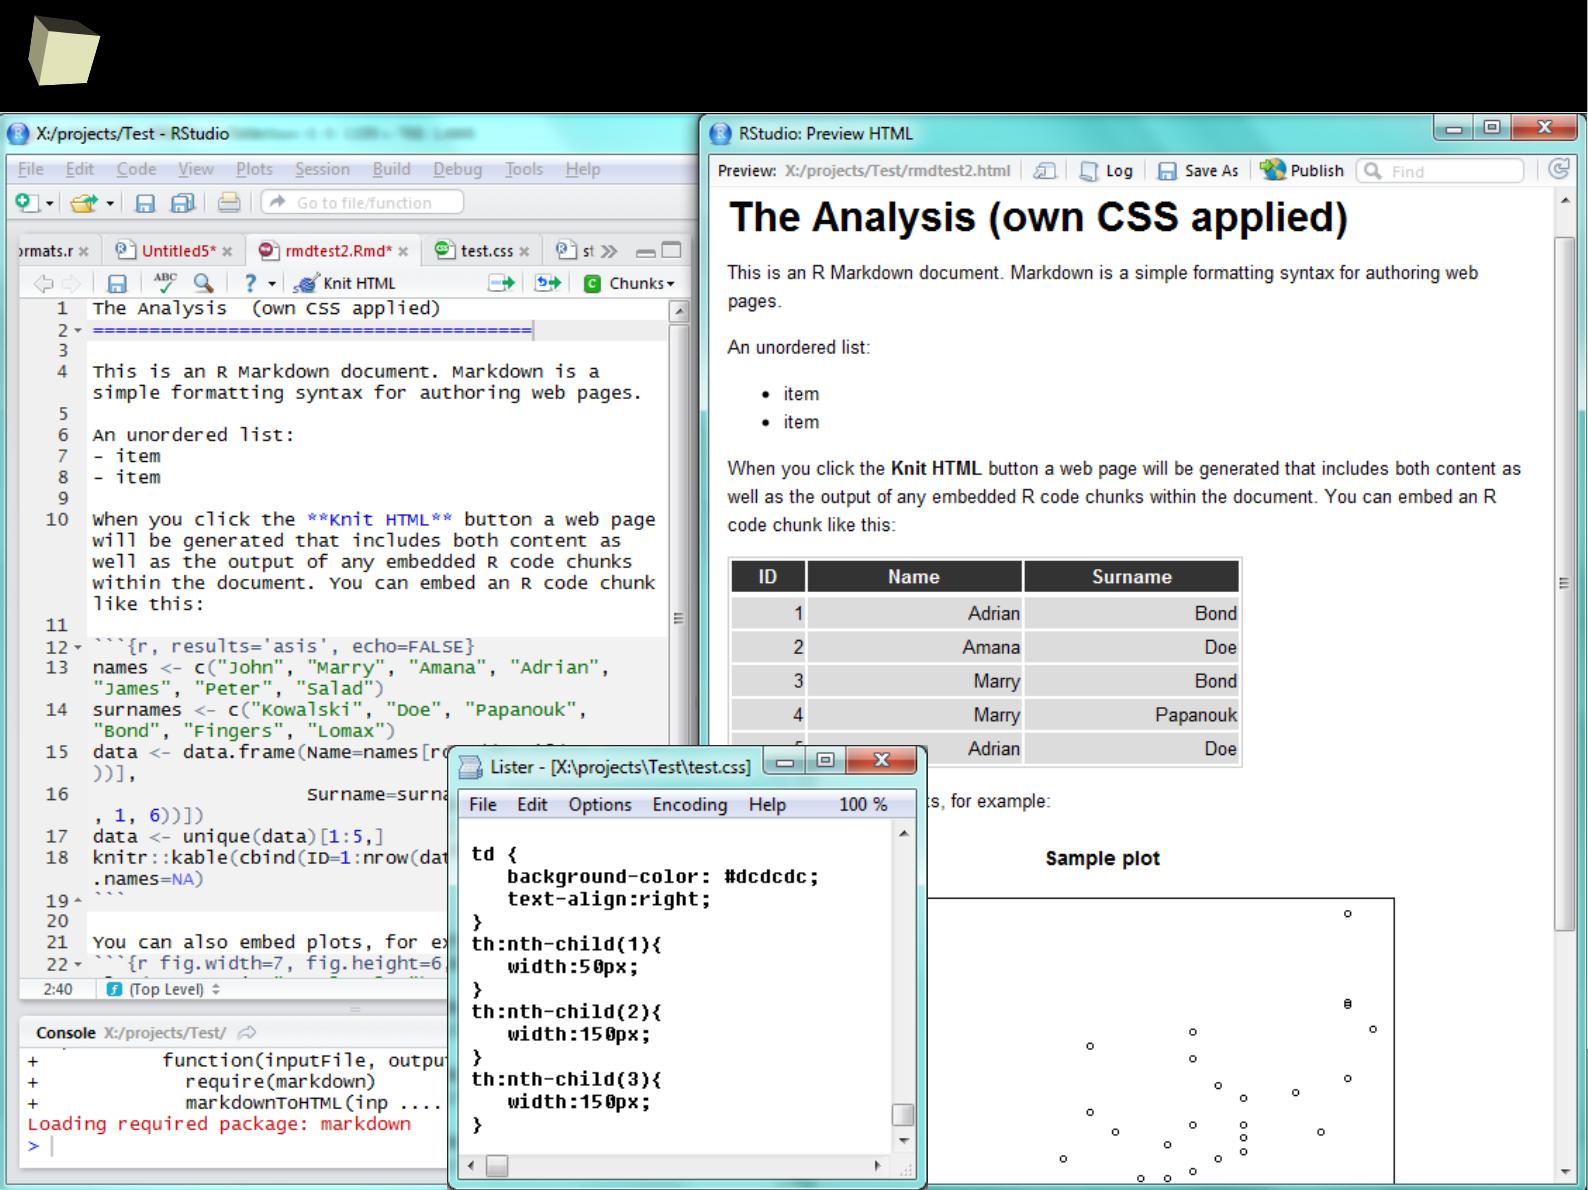
knitr + R Markdown + HTML + CSS
2
0
9
HTML report opened in Word and Excel
2
1
1
pandoc – convert to real DOC / OXML / PDF / ODF
2
1
2
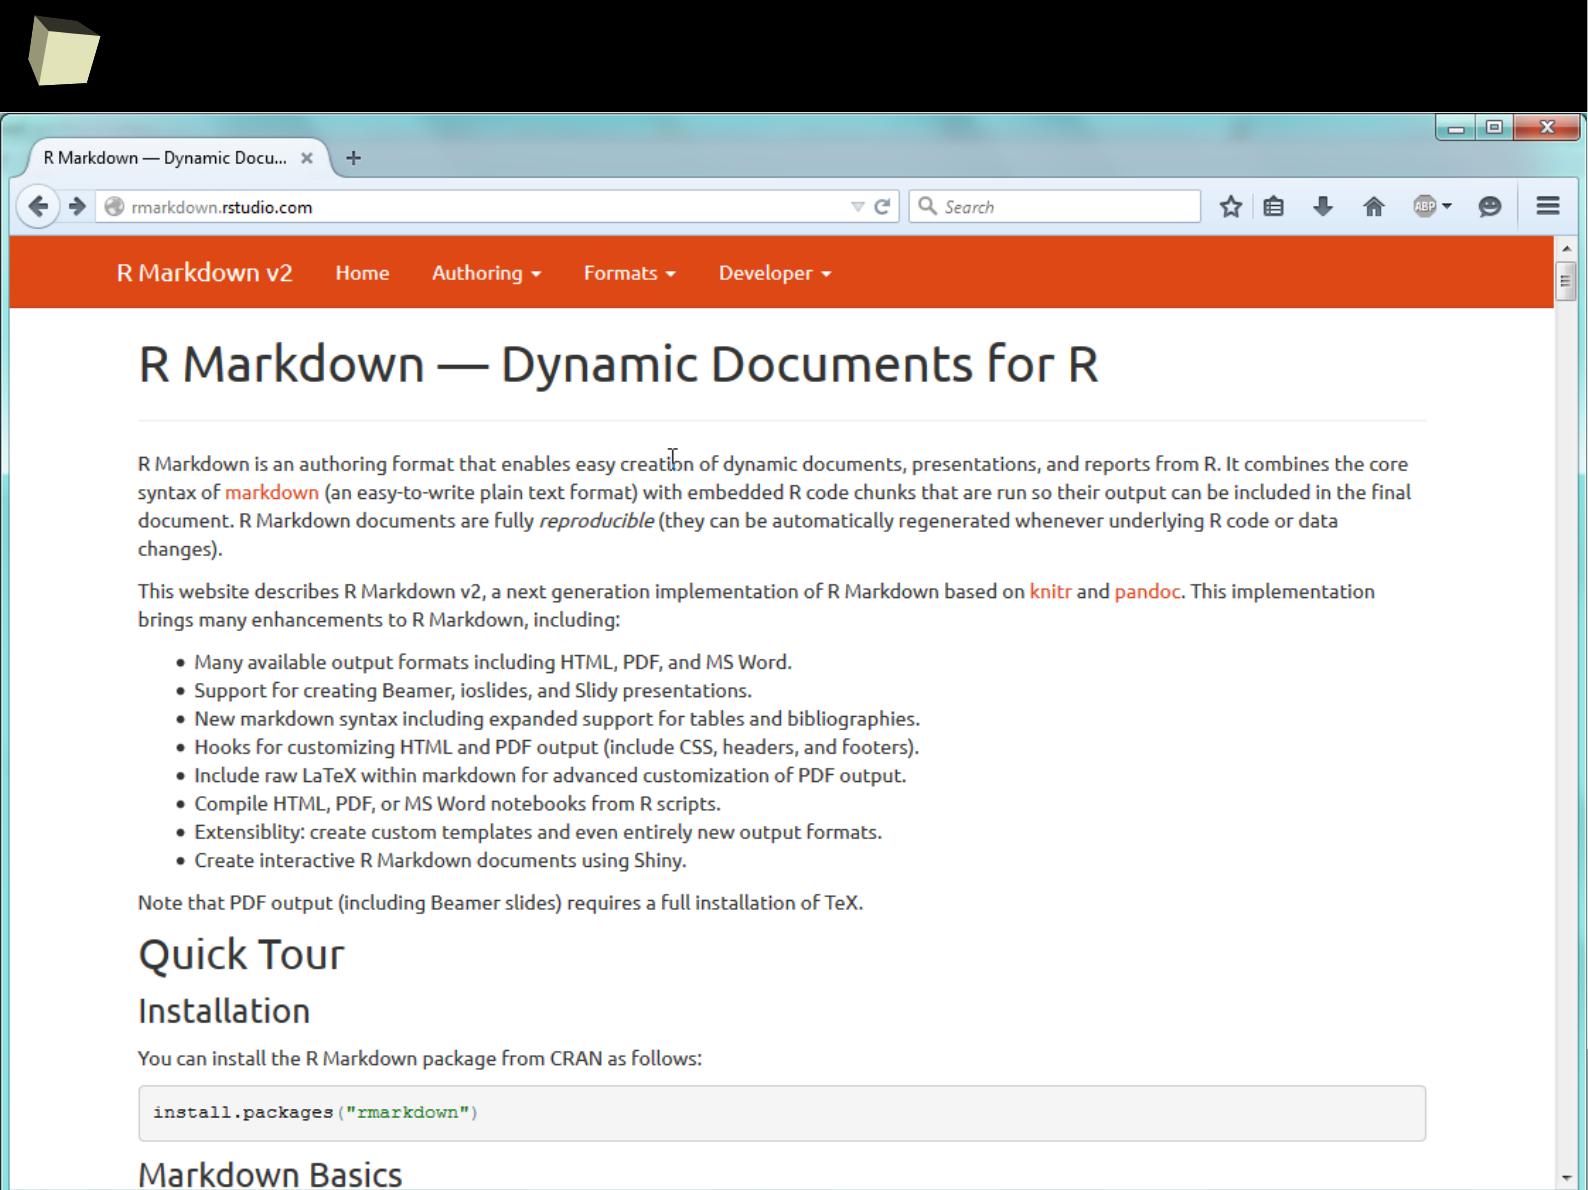
Reproducible Research with RMarkdown
RStudio
2
1
3
Take a moment and discover R Markdown!

2
1
4
Reproducible Research with ODF – odfWeave
OdfWeave is an adaptation of Sweave for OpenDocument files. Such files serve
as a template of the report with R code embedded in. MS Office, Open/Libre
Office and Calligra Suite (formerly KOffice) work with the OpenDocument format
smoothly.
OdfWeave is flexible and simple to use. It allows to create templates directly in a
word processor. This is the most convenient way to accomplish the Reproducible
Research goals. Styling can be applied (in a limited extent) from the R code and,
mostly – in the editor.
The R code may be embedded into a template document or stored in a separate
file, which is then referenced in the template. Both approaches have their pros
and cons. The second approach is particularly useful, when the same code is
shared between (reused in) many documents.

2
1
5
Reproducible Research with ODF – odfWeave
Unfortunately, some serious caveats and limitations must be noted:
●
MS Word incorrectly saves a definition of autonumbered captions which
causes all captions begin from: “Table: 999”
●
MS Windows does not honor UTF-8 locale. Therefore odfWeave cannot
handle mixed characters from different alphabets (óęłéüš яфы βθΣΩ),
especially ASCII (English) and non-ASCII (Russian, Greek). There are three
options to solve this issue:
●
process document under Linux or MacOS, which are Unicode-enabled
●
use old good non-Unicode fonts, one for each language, e.g. Symbol
for Greek characters and math symbols.
●
replace all non-ASCII characters with their ASCII equivalents in the
fetched data by using iconv(text, "UTF-8", "ASCII//TRANSLIT")
●
Ä, Á, Ą --> A | Ë, É, Ę --> E | Õ, Ó --> O (U)
●
Ň, Ń --> N | Ü, Ó --> U | Š, Ş, Ś --> S etc.
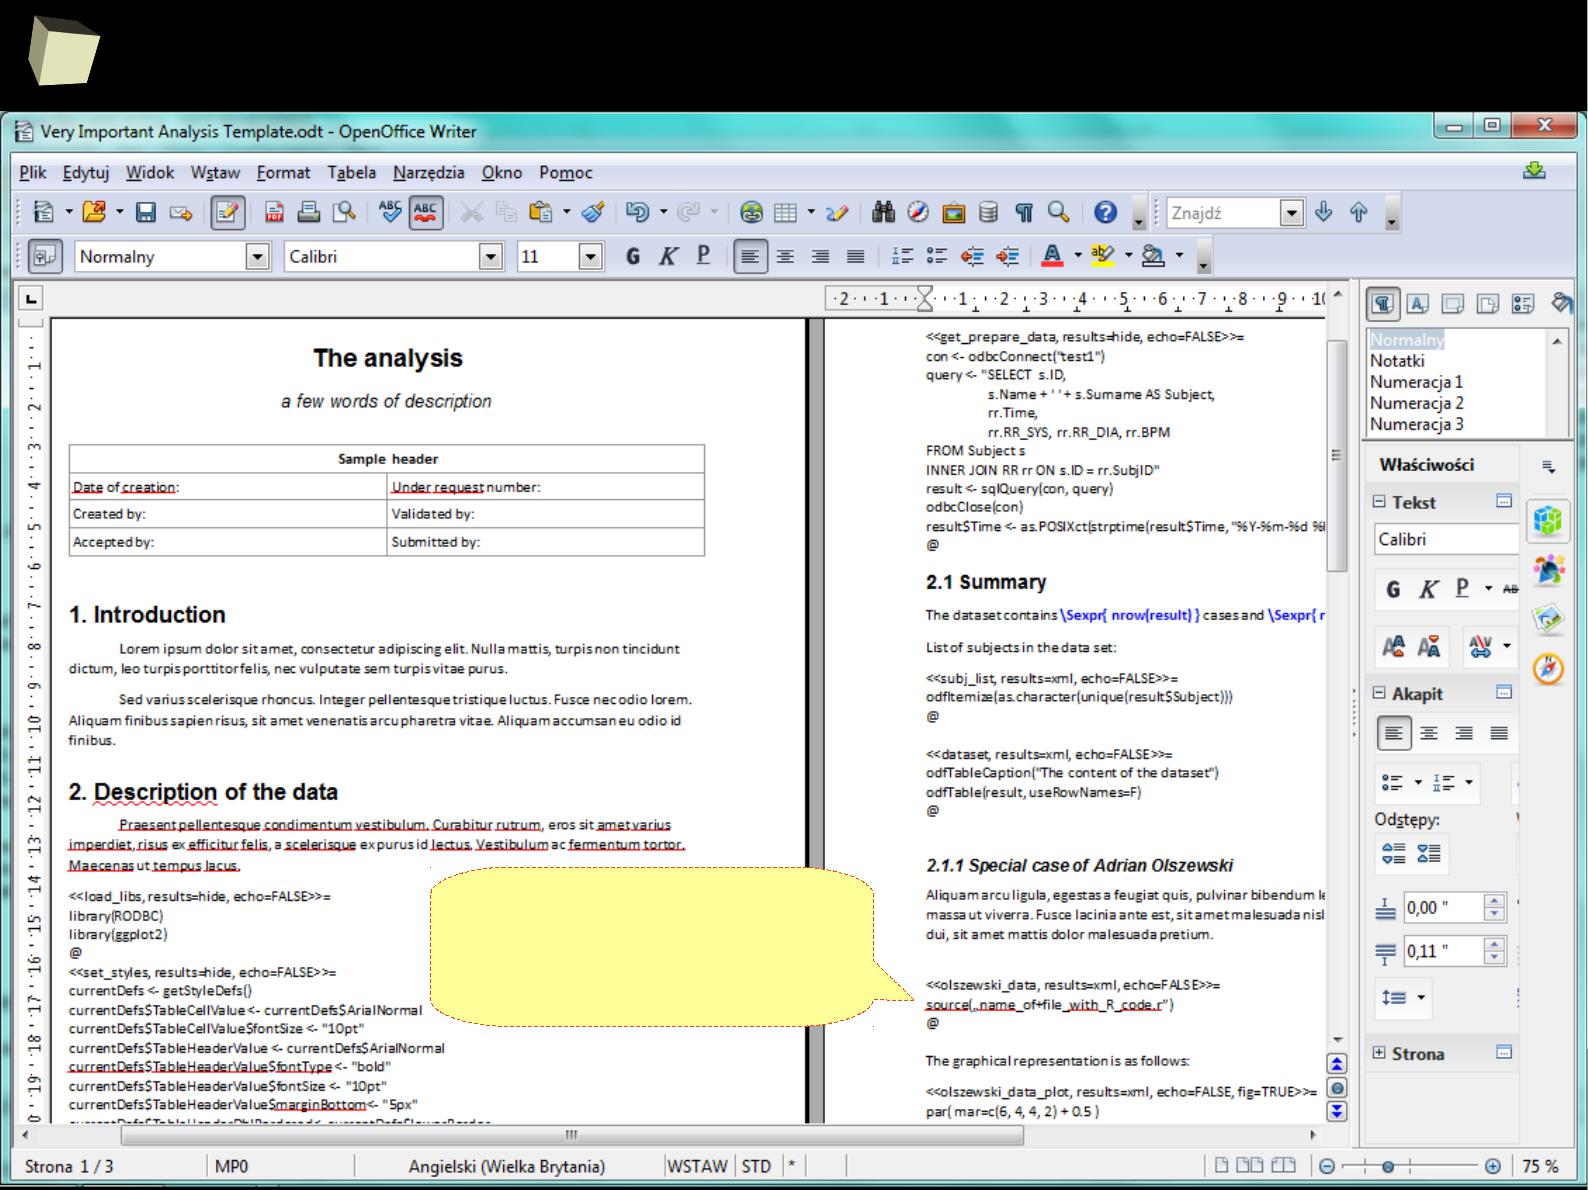
2
1
6
From an ODF template...
much better option:
don't embed a code into the template,
put it in a separate file and refer to it:
source("an019_32.r")
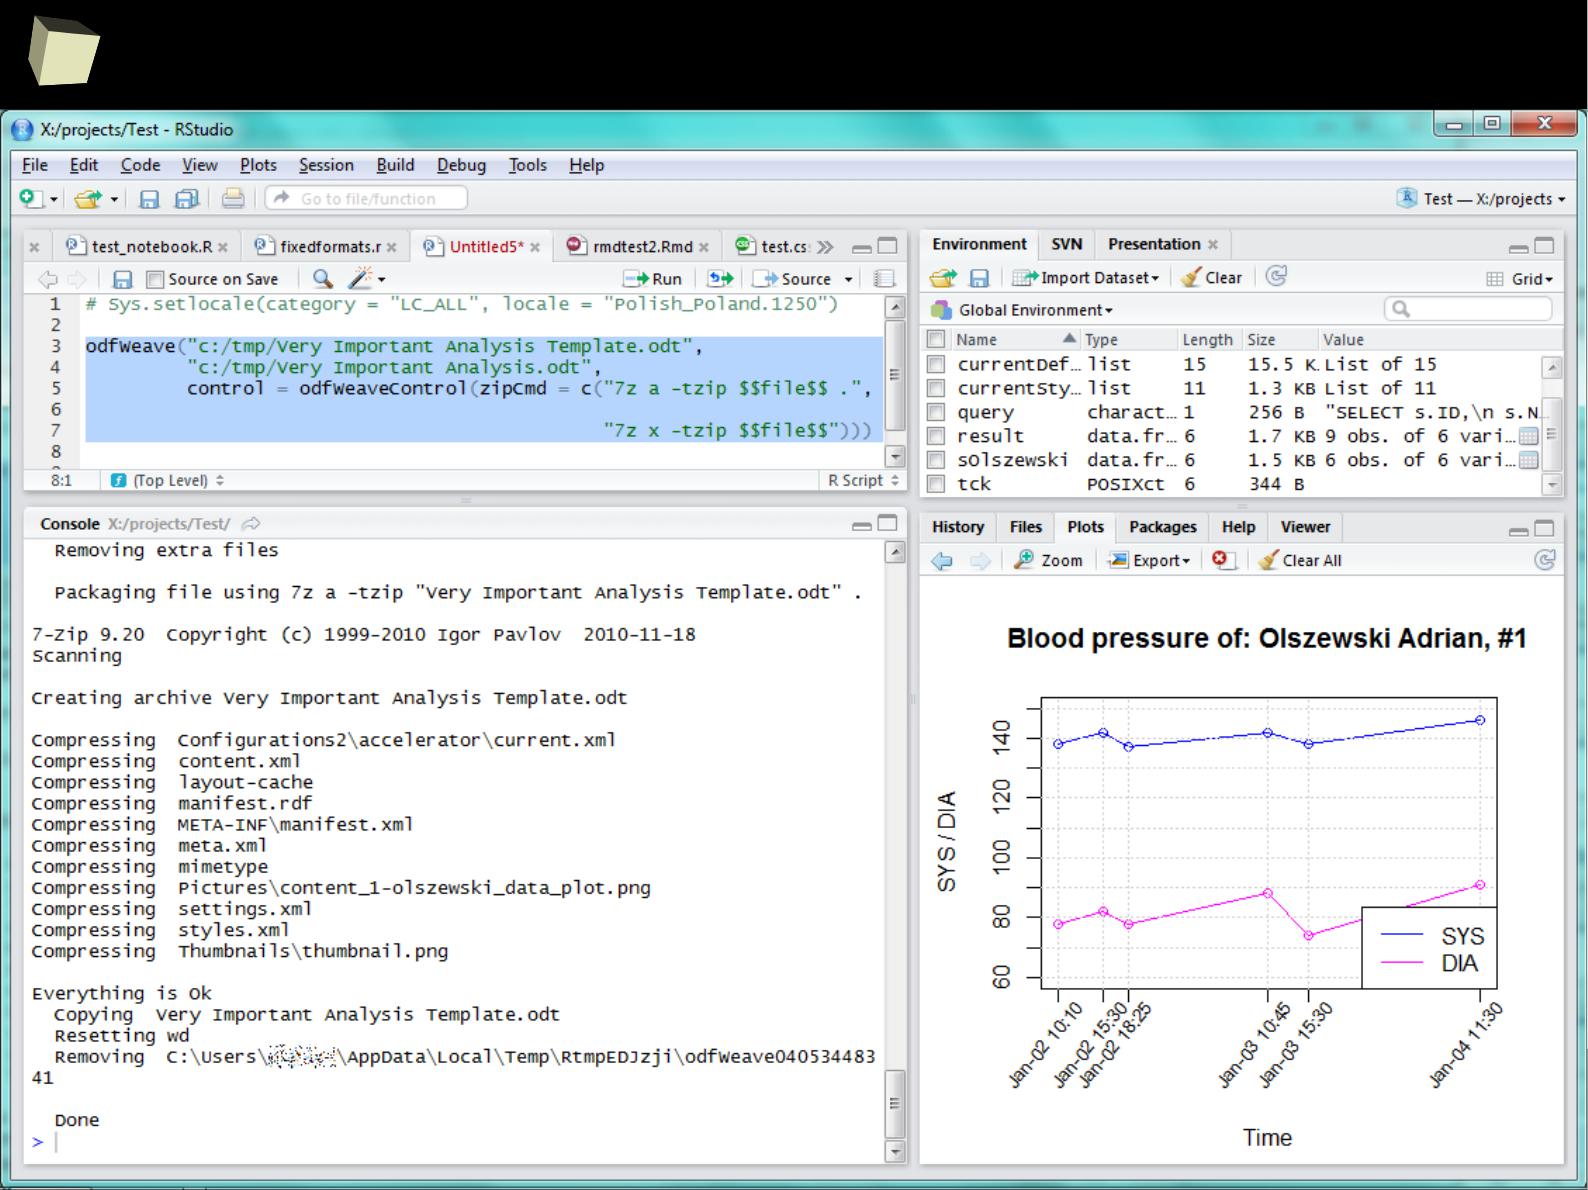
2
1
7
...via the odfWeave engine...
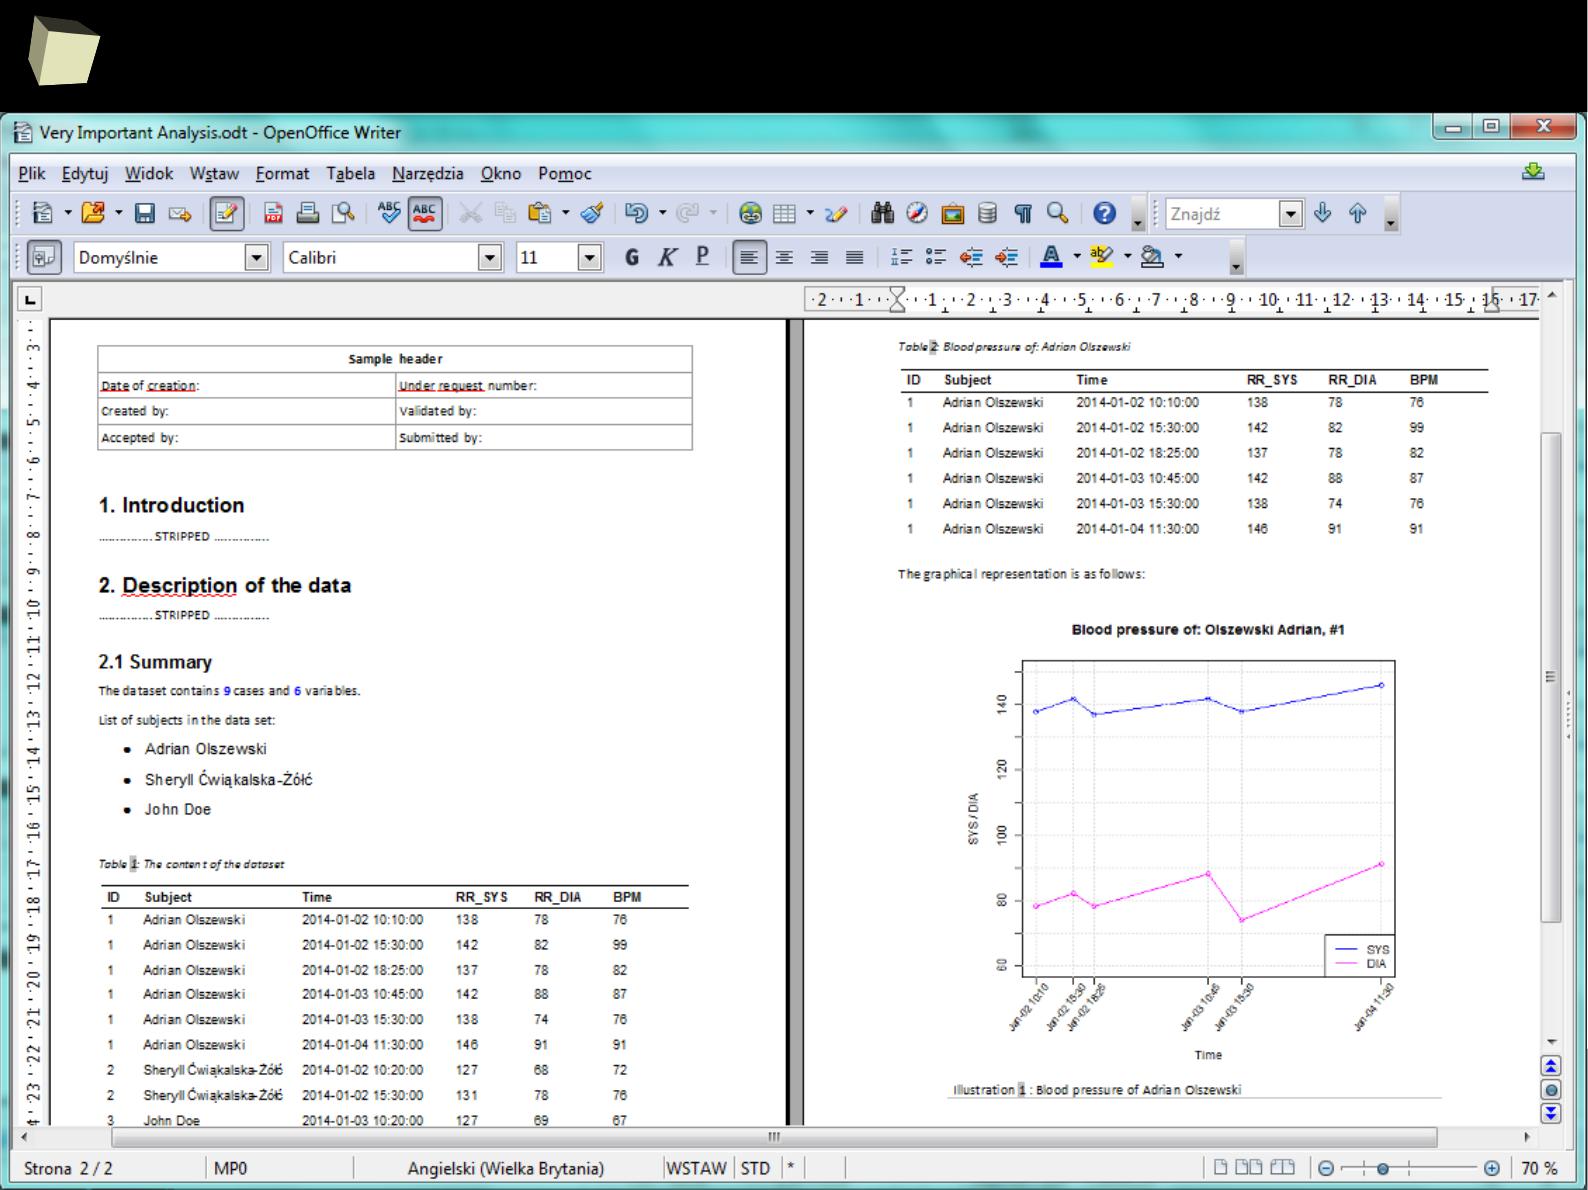
2
1
8
...to the final document
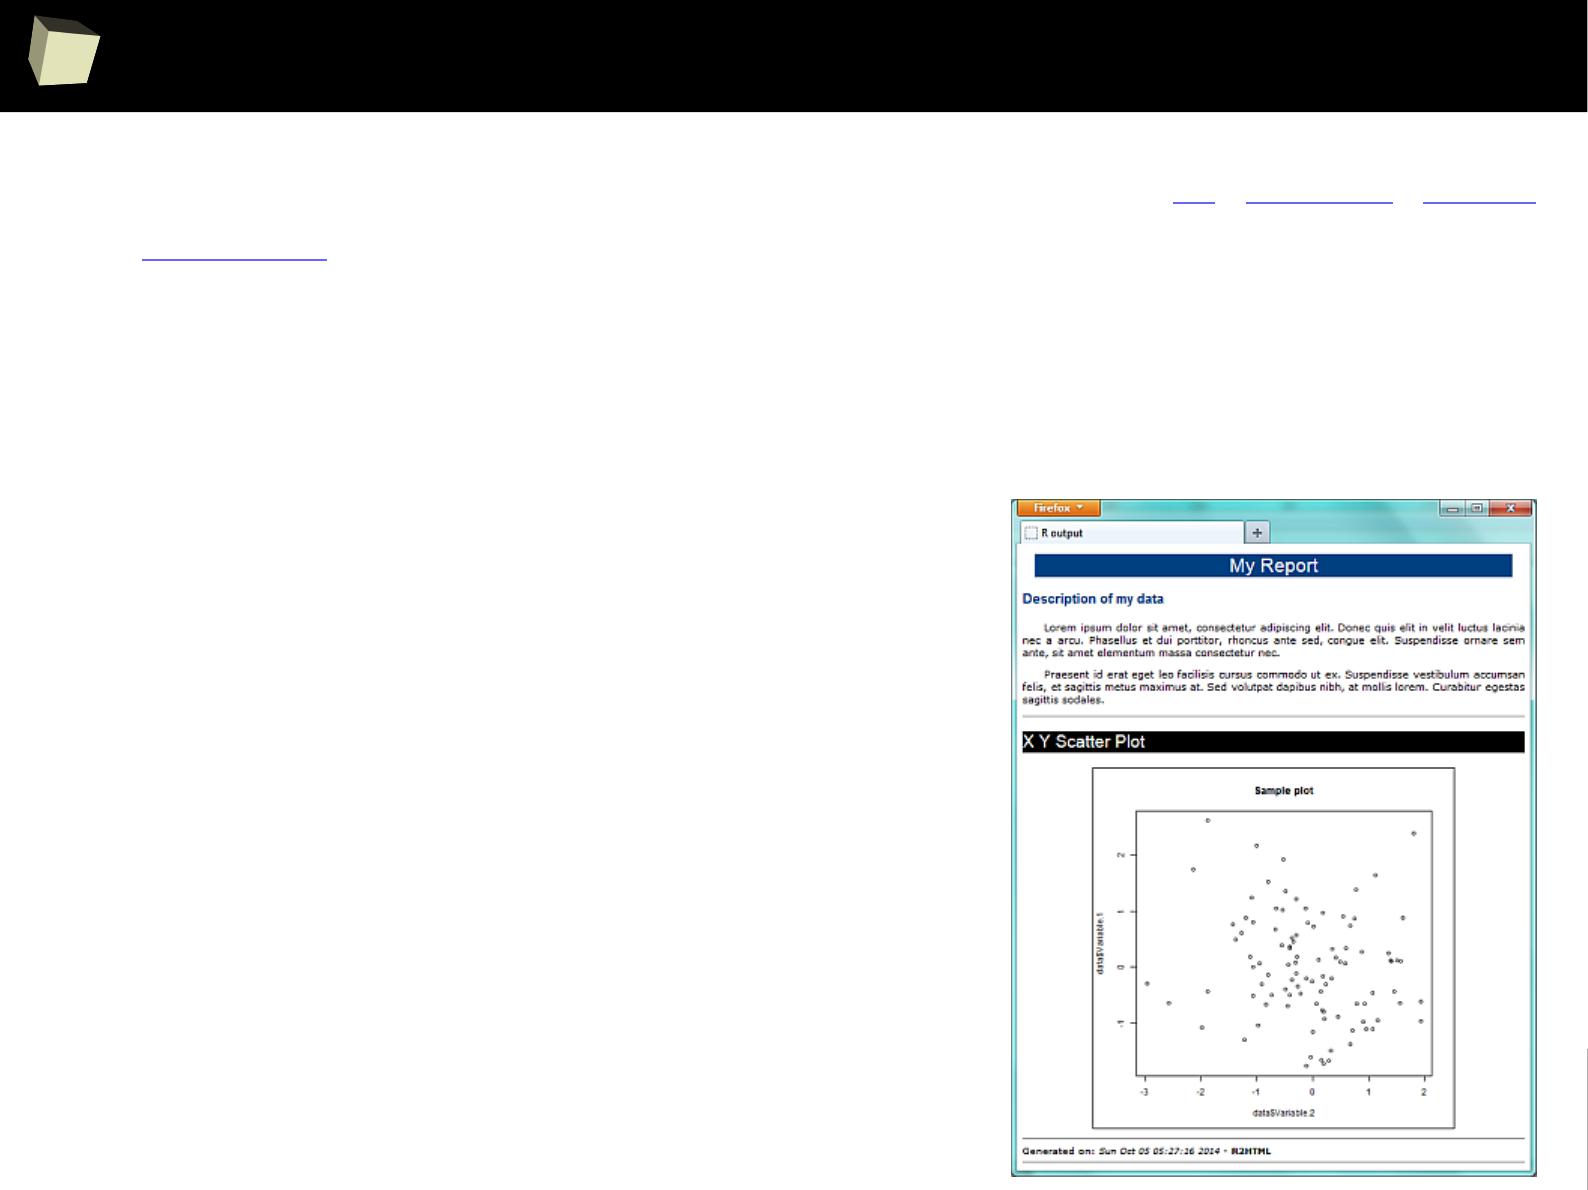
2
1
9
Let's do the same otheR way
R allows the user to create documents directly from code. rtf, R2HTML, R2PPT
and ReporteRs packages do the job. This is similar to how it is done in SAS.
The philosphy of document creation here is different from the approach taken in
odfWeave or knitr. There is no mixing formatted paragraphs with R code. Every
single object (literal, paragraph, table, graphics) is created by a specific
function, directly in R.
data <- data.frame("Var 1" = rnorm(100),
"Var 2" = rnorm(100))
HTMLStart(outdir="c:/mydir", file="myreport",
extension="html", echo=FALSE...)
HTML.title("My Report", HR=1)
HTML.title("Description of my data", HR=3)
HTML("Lorem ipsum dolor sit amet,...")
HTML("Praesent id erat eget leo facilisis...")
summary(data)
HTMLhr()
HTML.title("X Y Scatter Plot", HR=2)
plot(data$Var.1~data$Var.2, main="Sample plot")
HTMLplot()
HTMLStop()
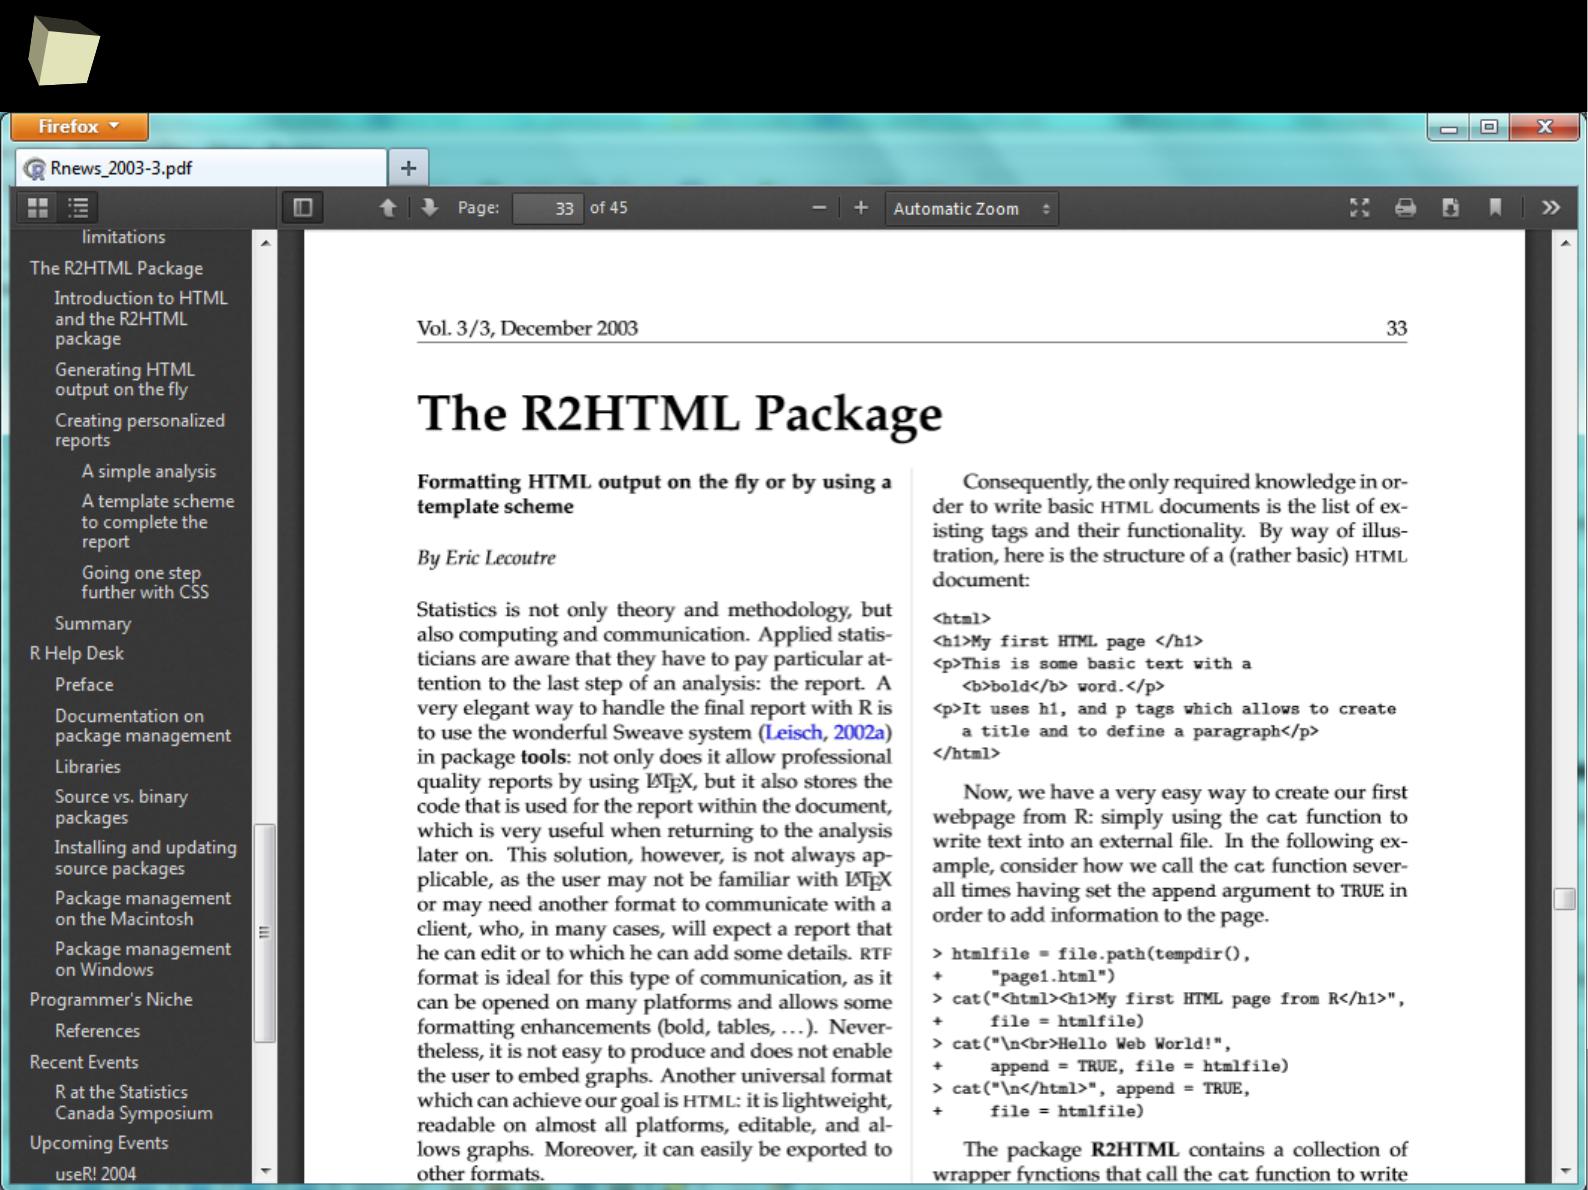
2
2
0
R2HTML is a well known yet a bit outdated tool...
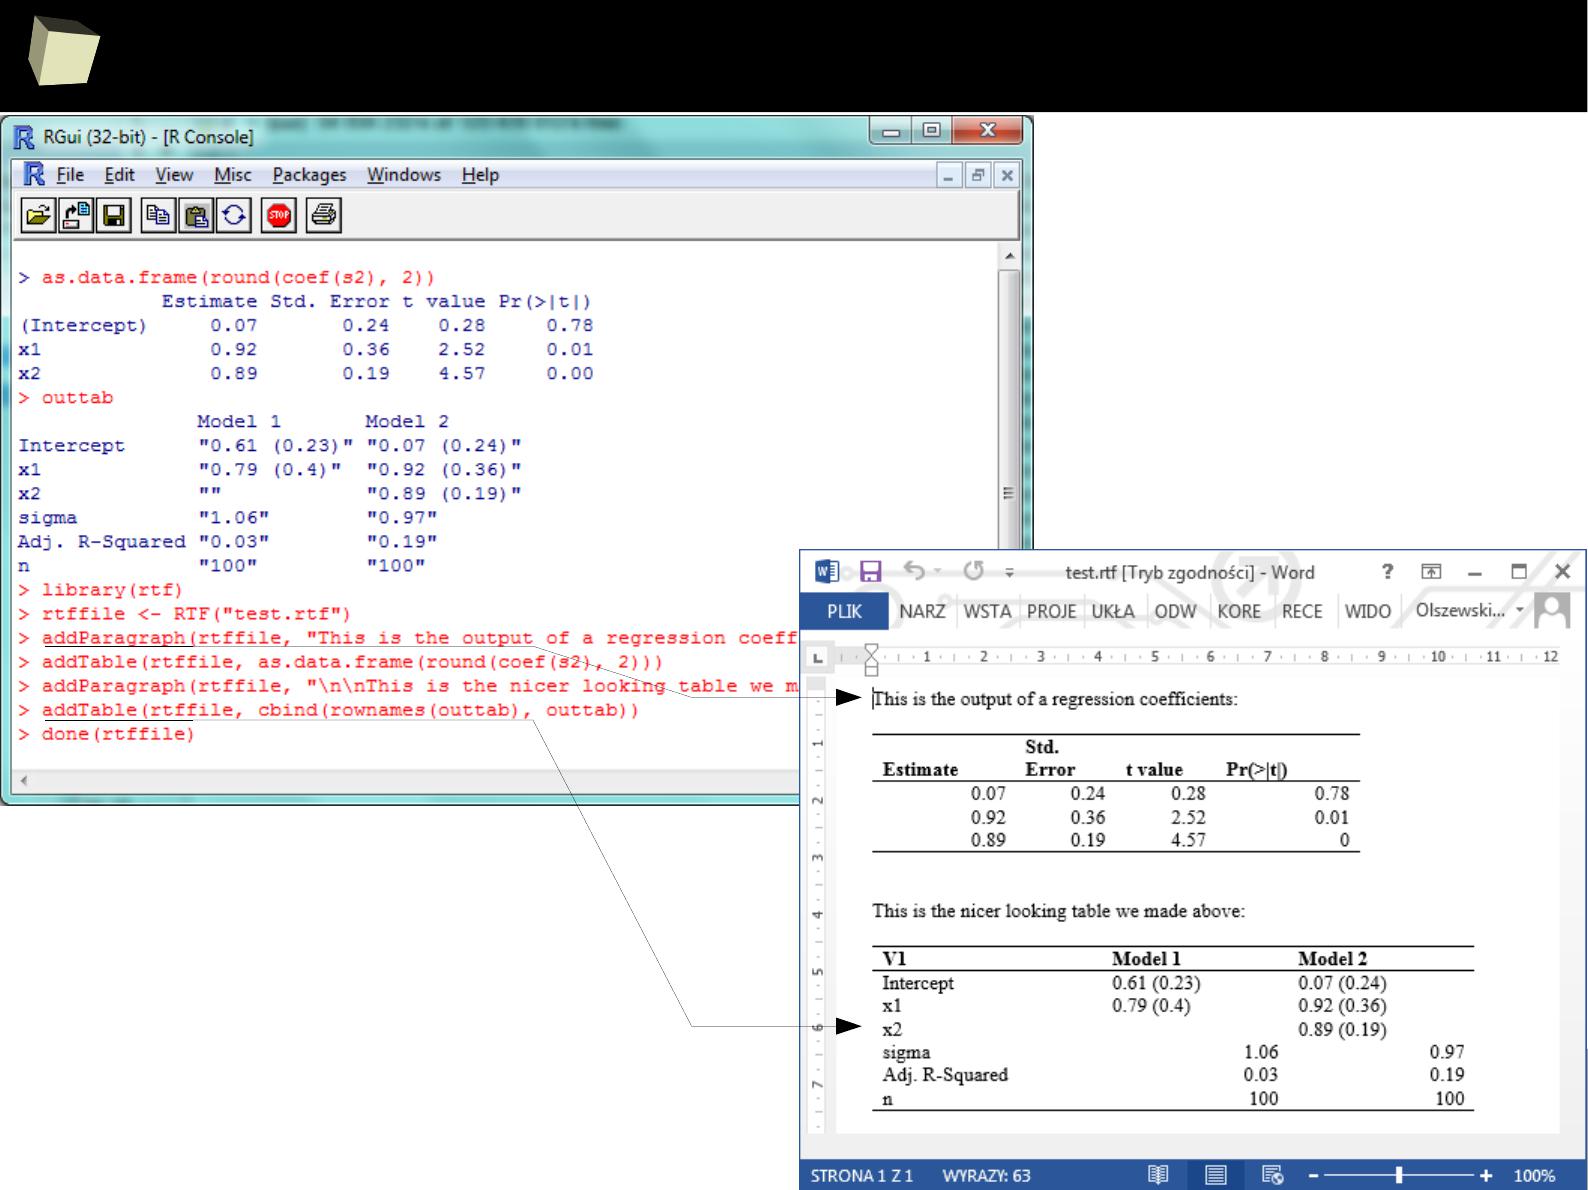
2
2
1
...as well as rtf package...
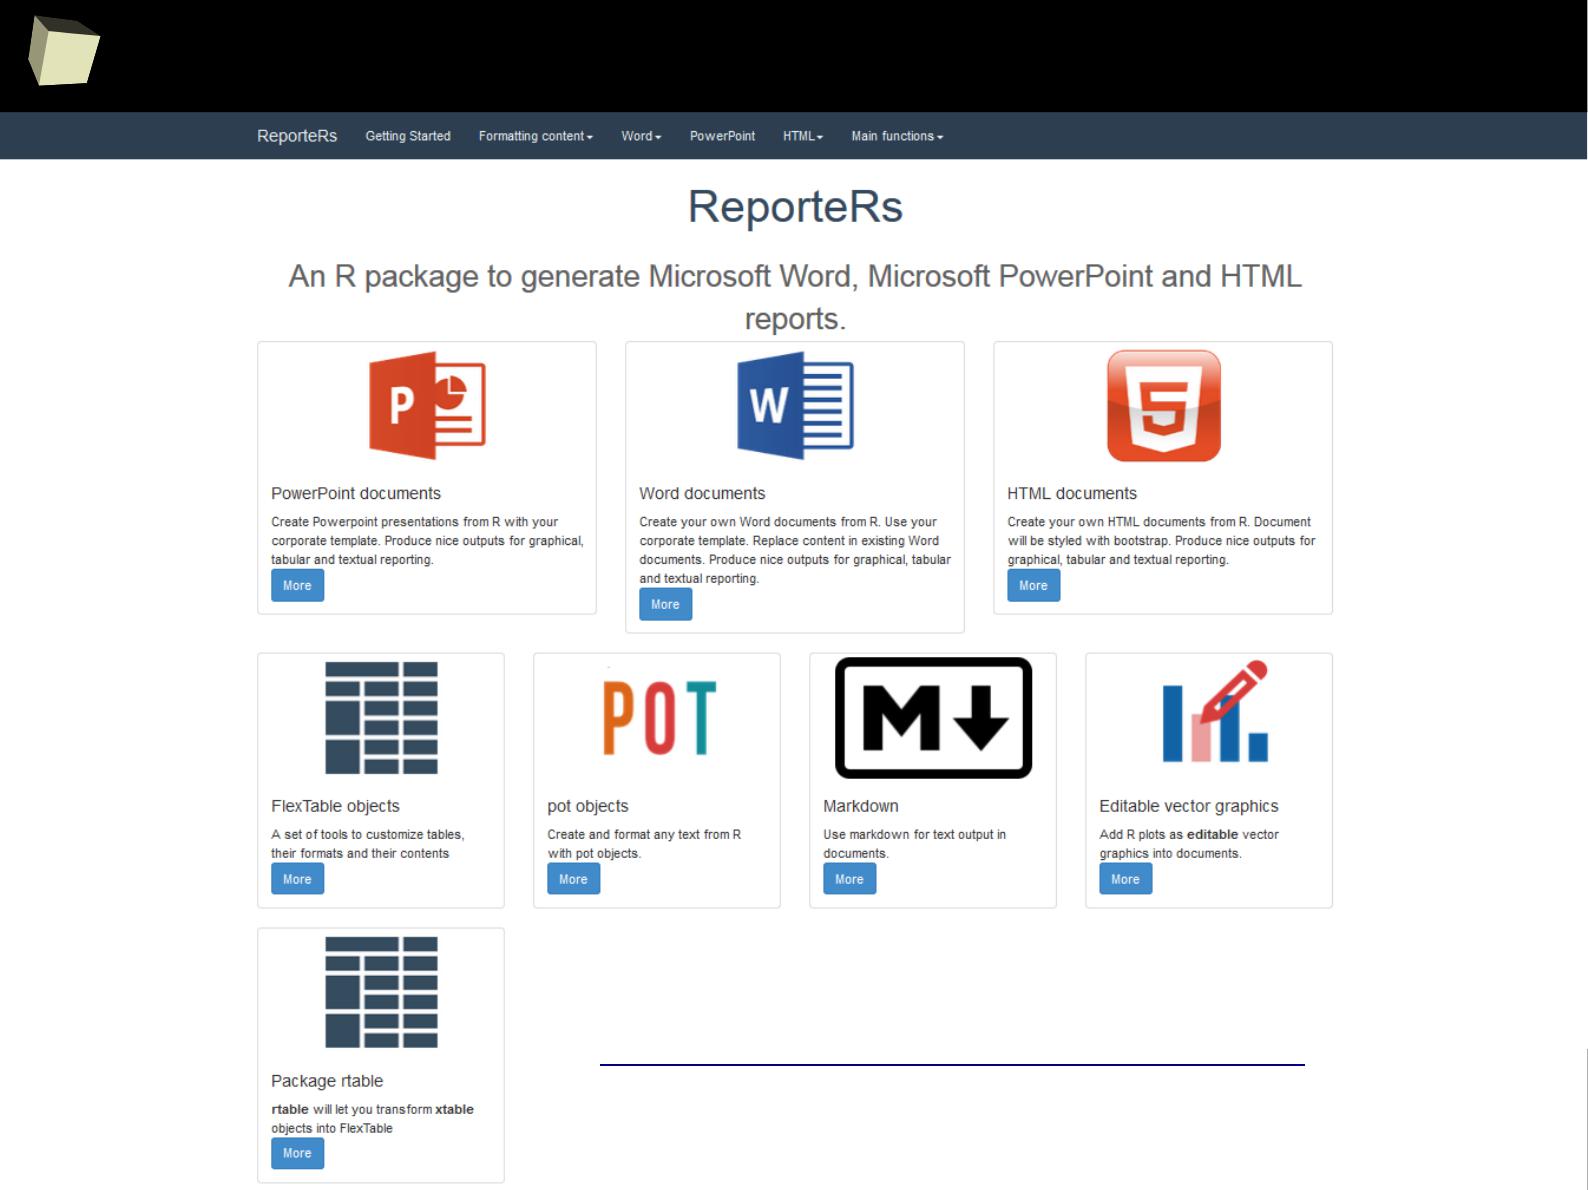

2
2
3
ReporteRs the King
ReporteRs is just outstanding package which allows to create Word, PowerPoint
(OpenXML) and HTML5 presentations without need to have MS Office installed.
It is hard to enumerate all capabilities offered by the package:
●
Styles – use the power of styles to easy control format of each object, and
●
add auto-numbered captions to tables and graphics. These captions are
recognizable by TOC generator, so one can easily add a list of tables.
●
add nested, numbered or bulleted lists (also from code)
●
Templates – use predefined styles, prepare overall layout of a document
and fill it with a content, replacing “bookmarks” with tables and graphics
●
Editable, scalable graphics (requires MS Office > 2007) – must see this!
●
Flexible tables, with cells spanning multiple rows and columns, advanced,
conditional formatting, “zebra style”. FlexTables are compatible with knitr.
●
Multilevel ordered lists with advanced, level-dependent, numbering
●
Footnotes, “pot objects” and many more!
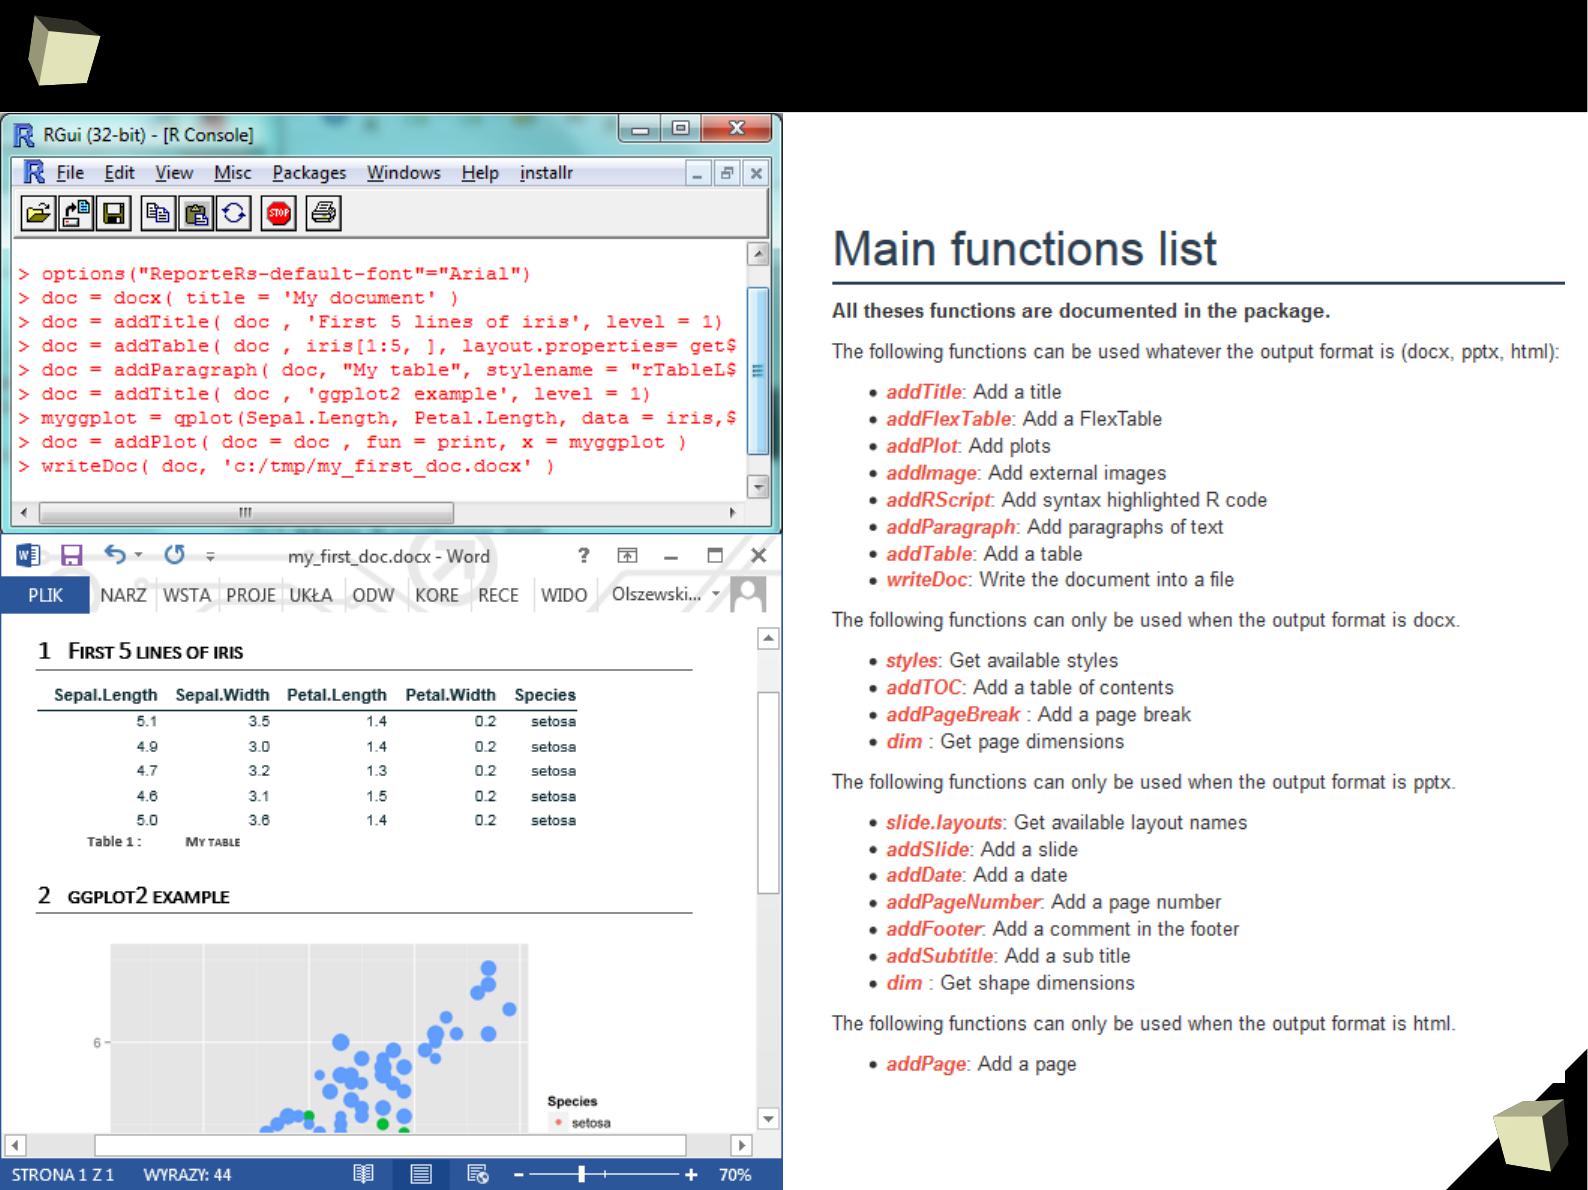
2
2
4
ReporteRs in action
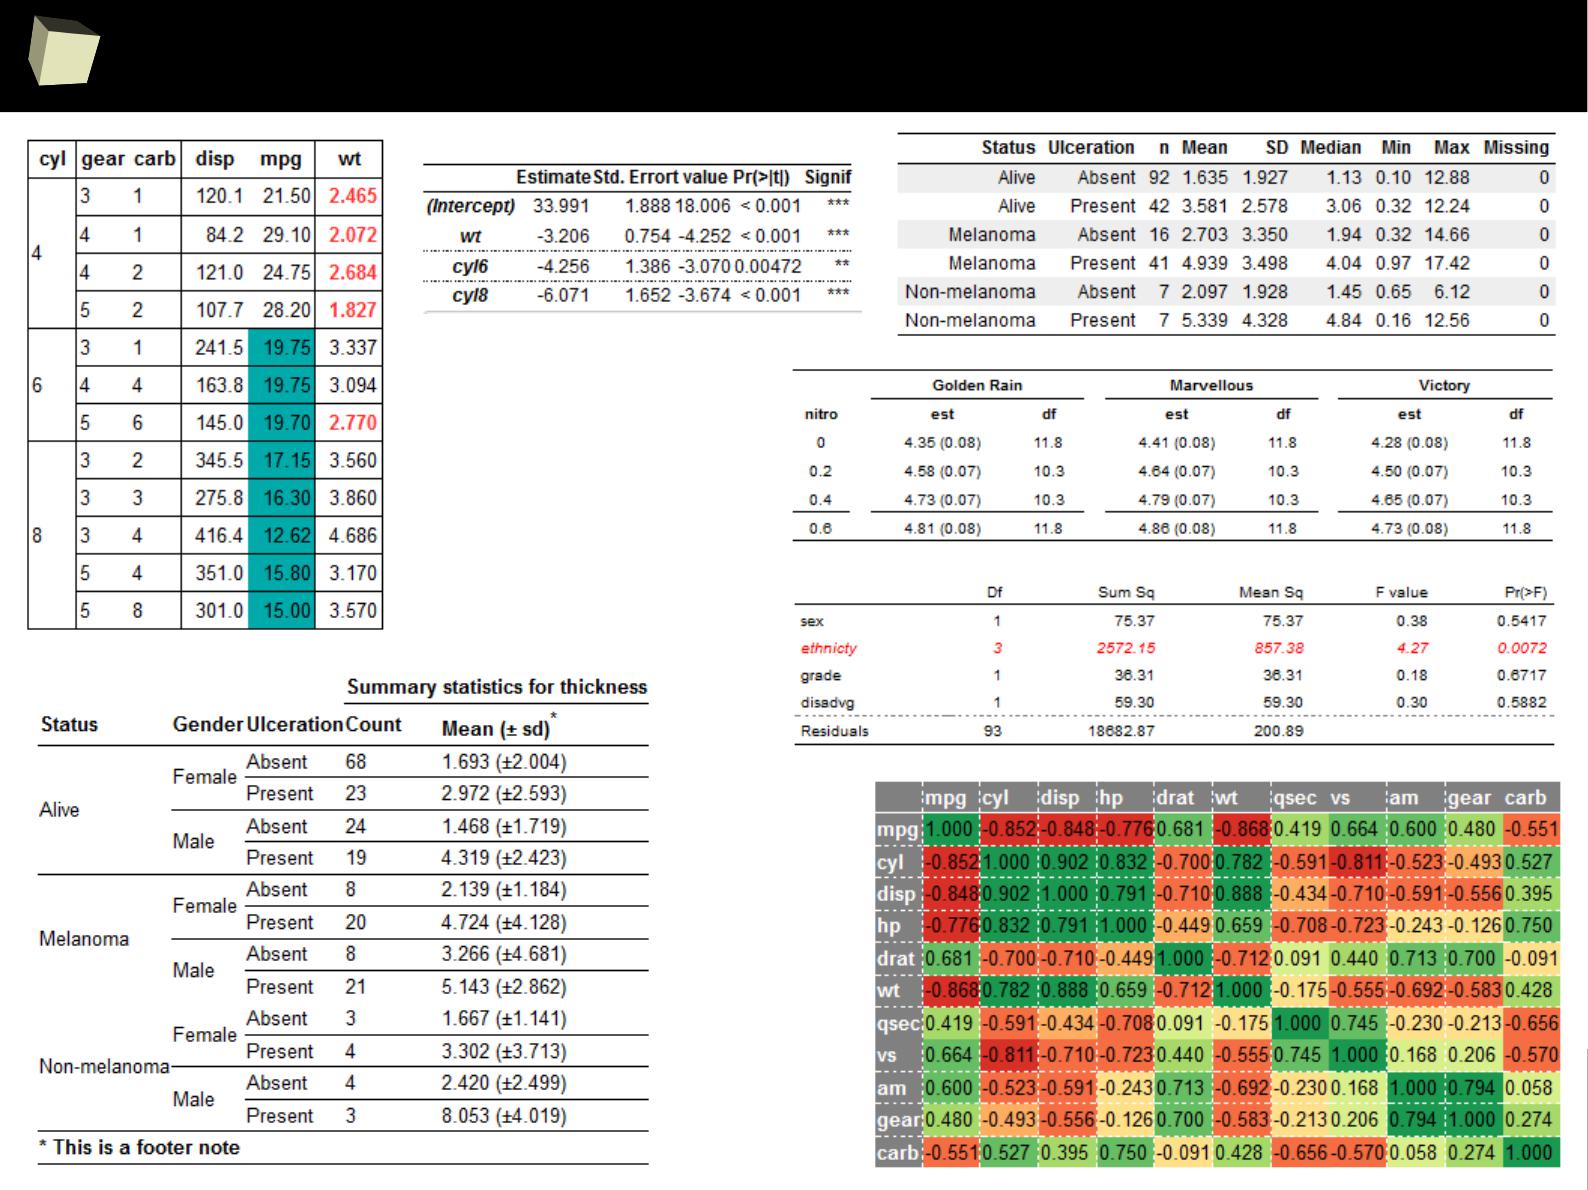
2
2
5
ReporteRs - tables
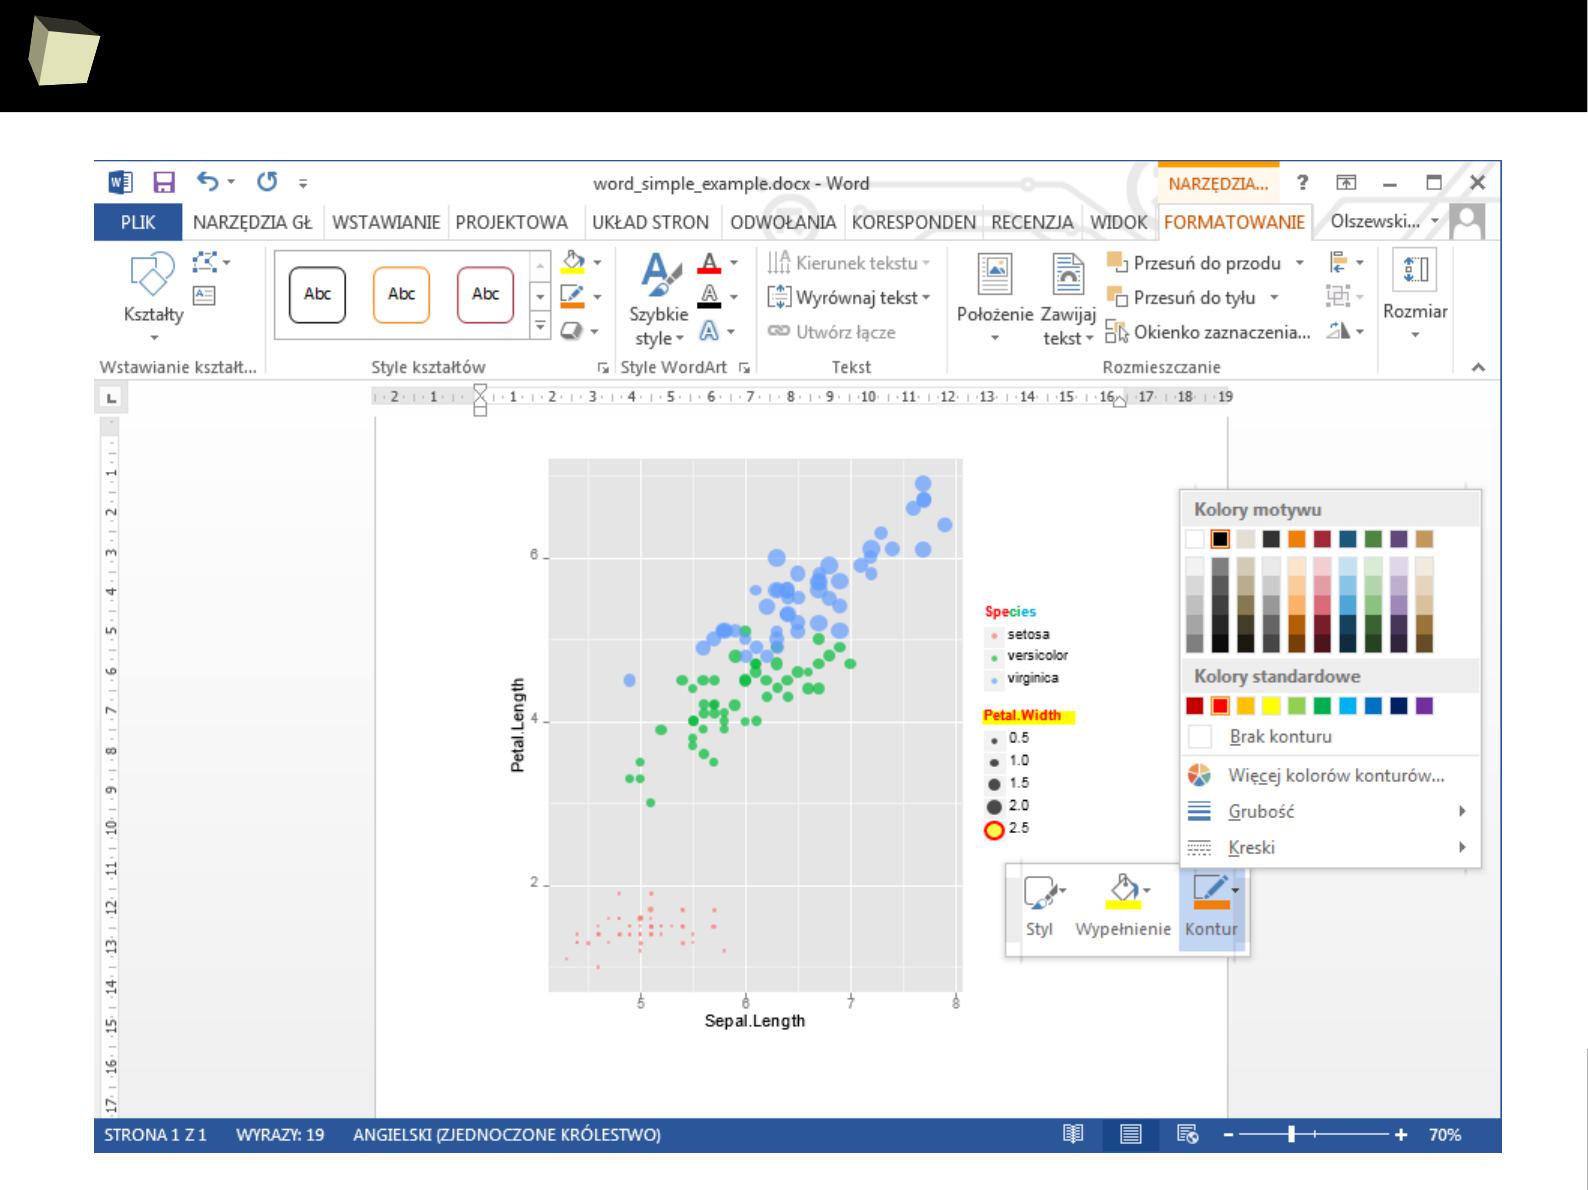
2
2
6
ReporteRs – editable graphics
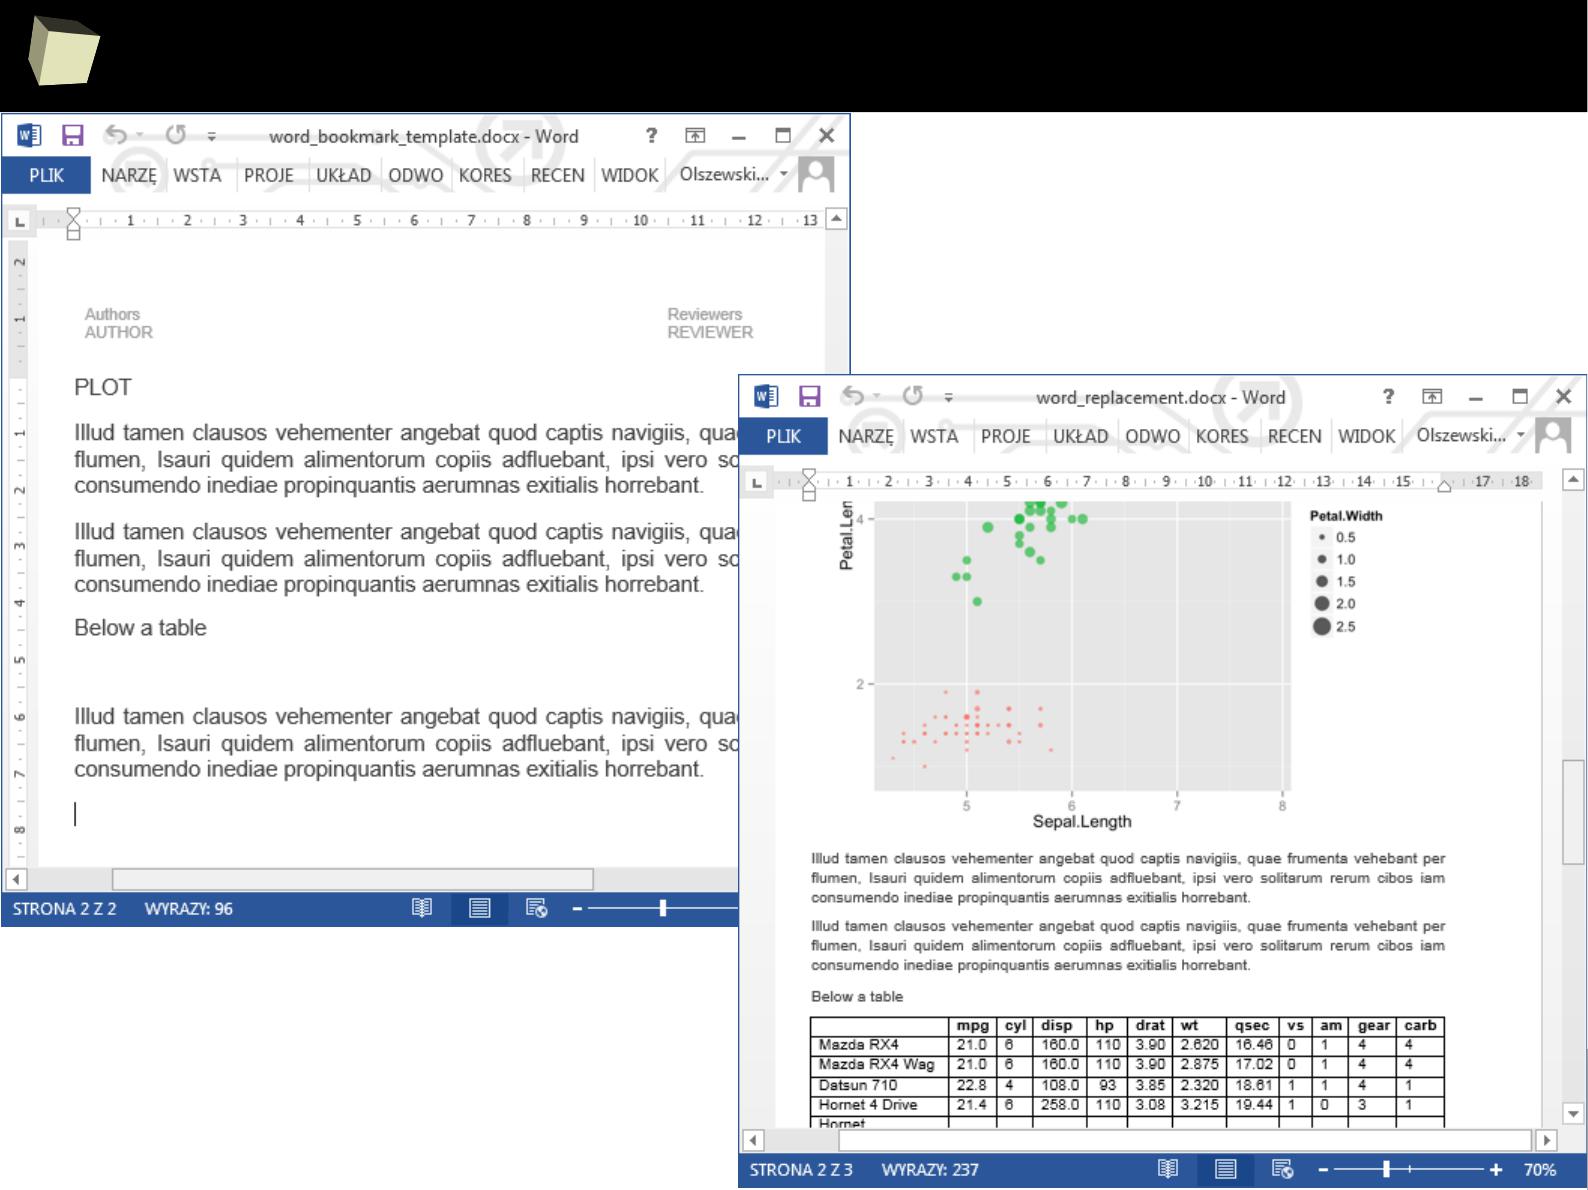
2
2
7
ReporteRs – replacing content in a template

2
2
8
13 reasons why you will love GNU R
I R is (extremely) cheap. In fact - it's free :)
II R has (extremely) wide range of capabilities
III R is (widely) supported by the world of science
IV R is supported by the community
V R is (increasingly) supported by the business
VI R is able to read data in many formats
VII Interoperability is easy to achieve
VIII R is truly cross-platform
IX 1/3 :) Tables. Clinical Tables.
X There are many possibilities to optimize the code
XI R is able to handle large amount of data
XII R has a set of fancy tools and IDEs
XII FDA accepted using R for drug trials!
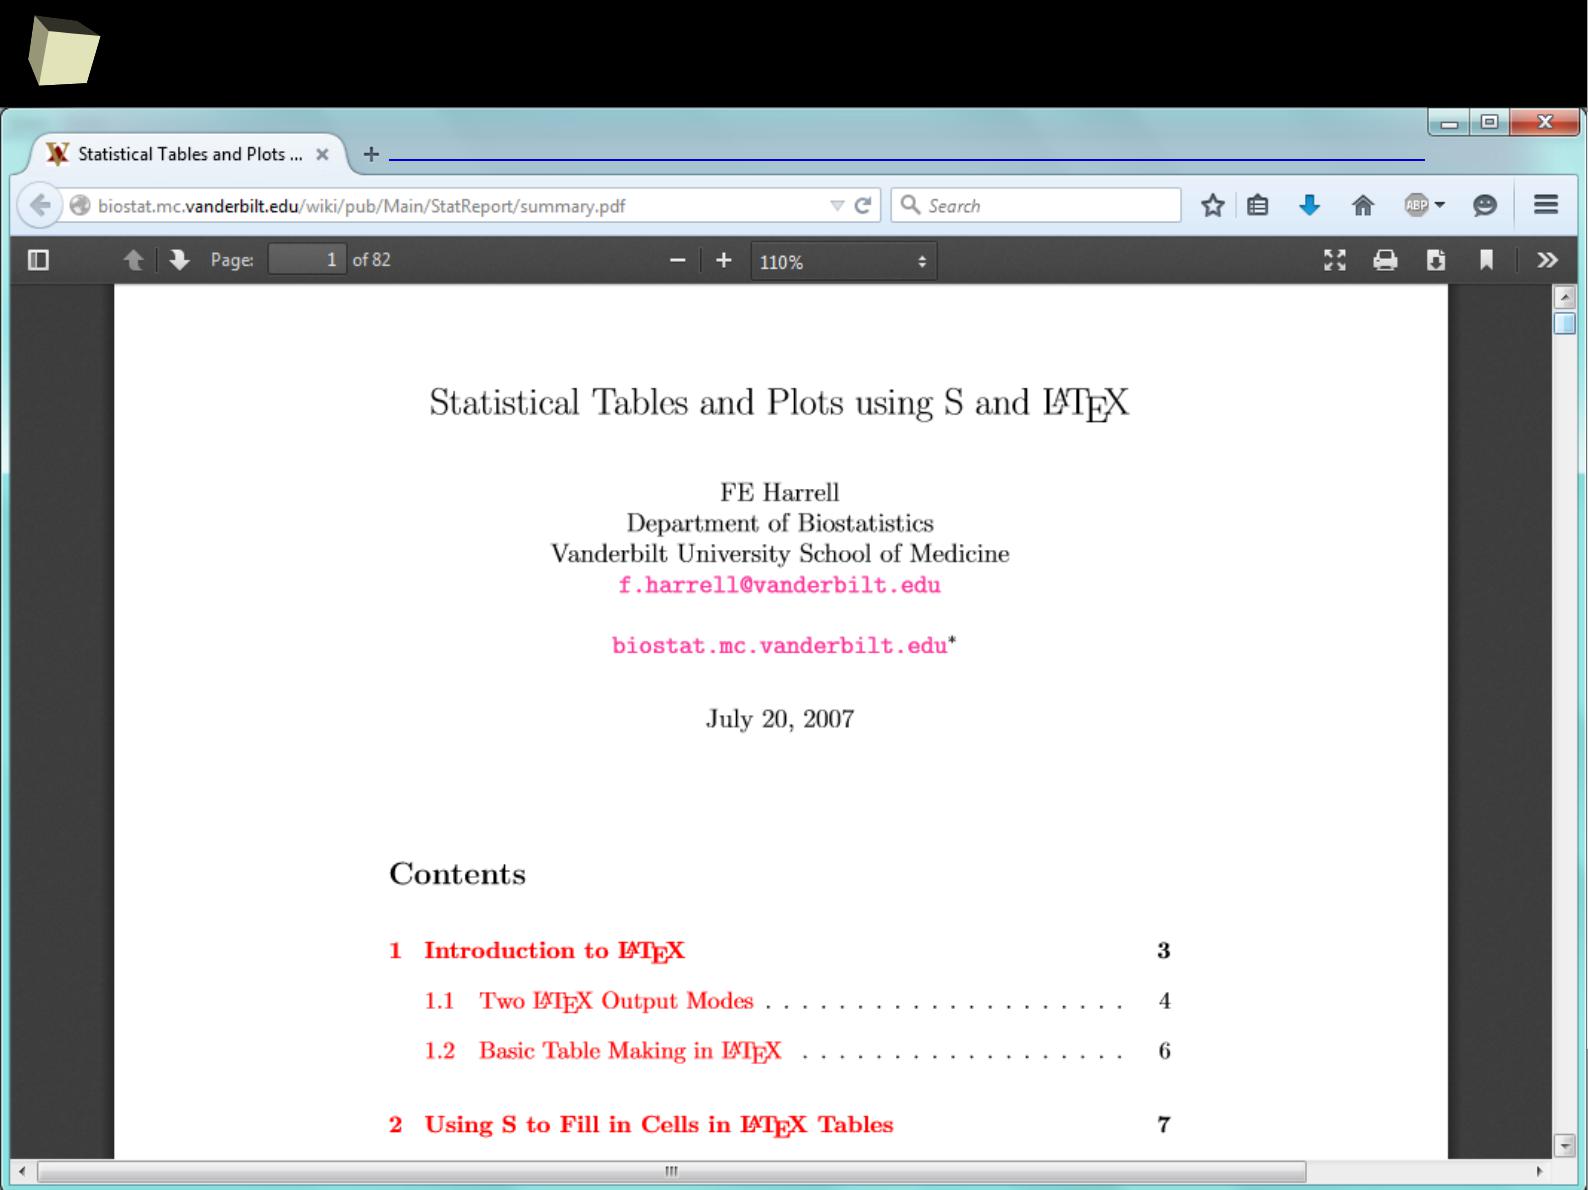
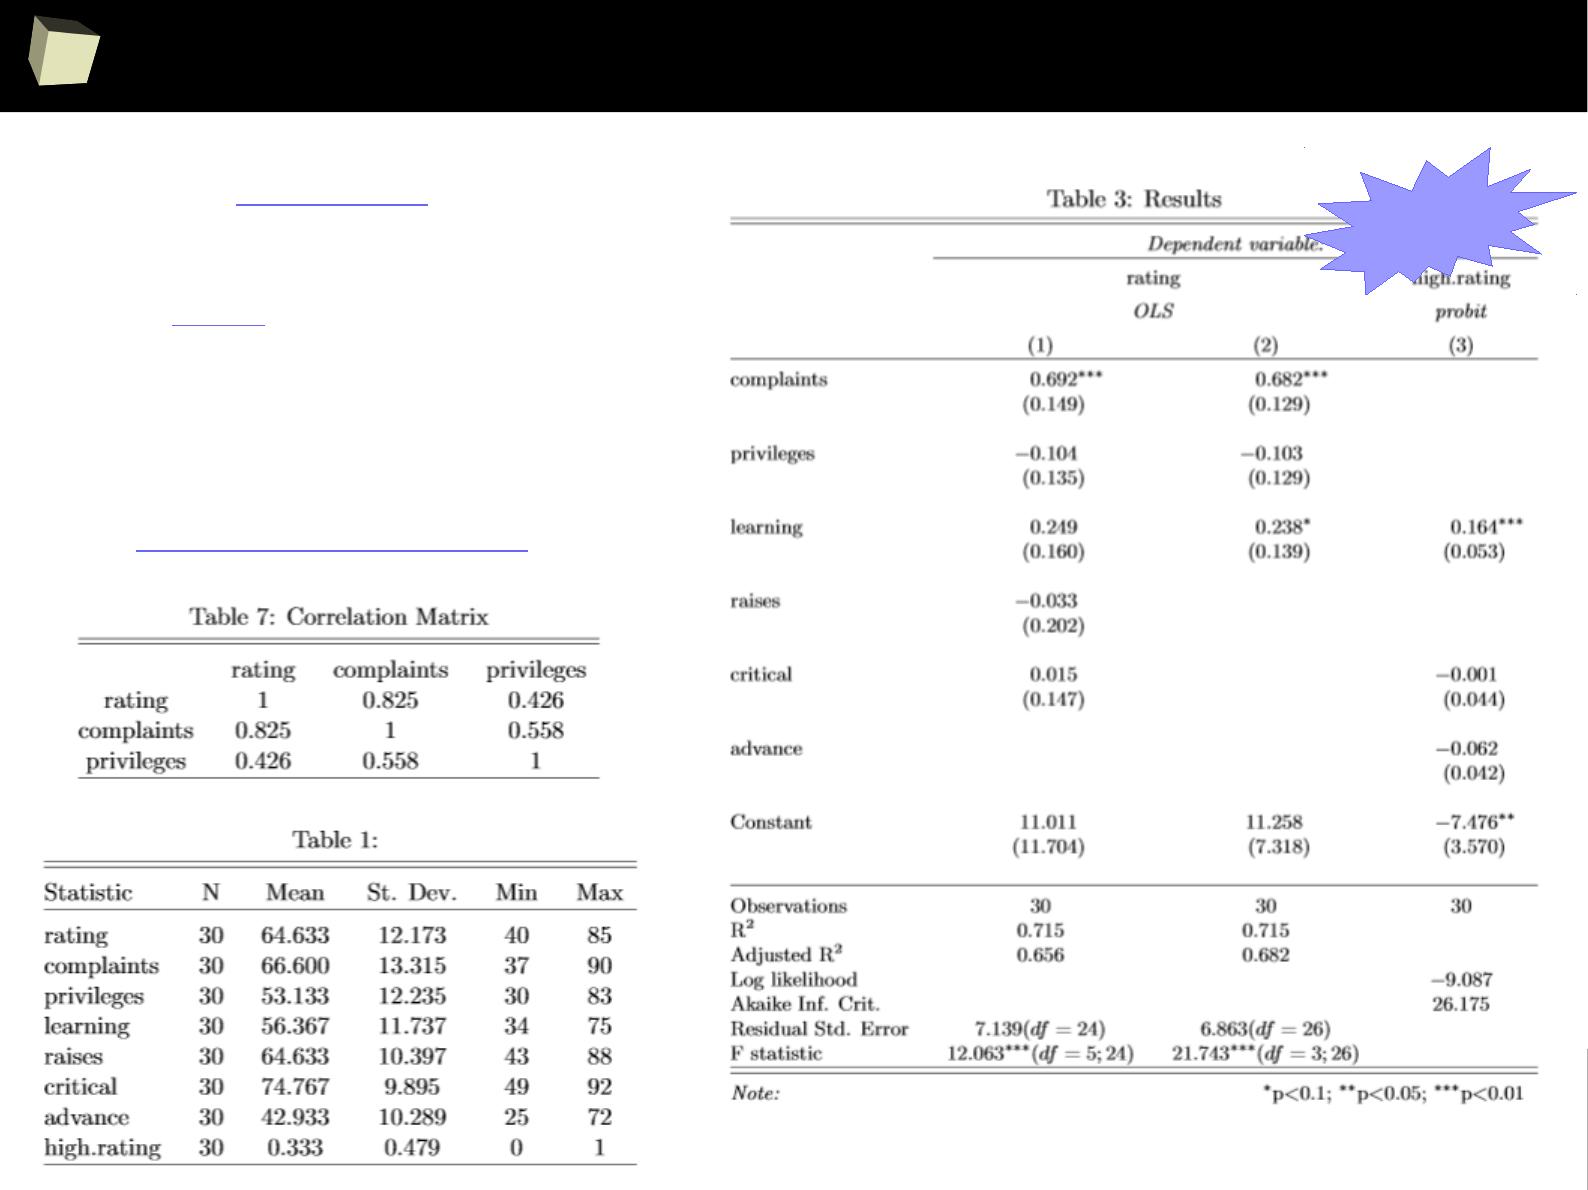
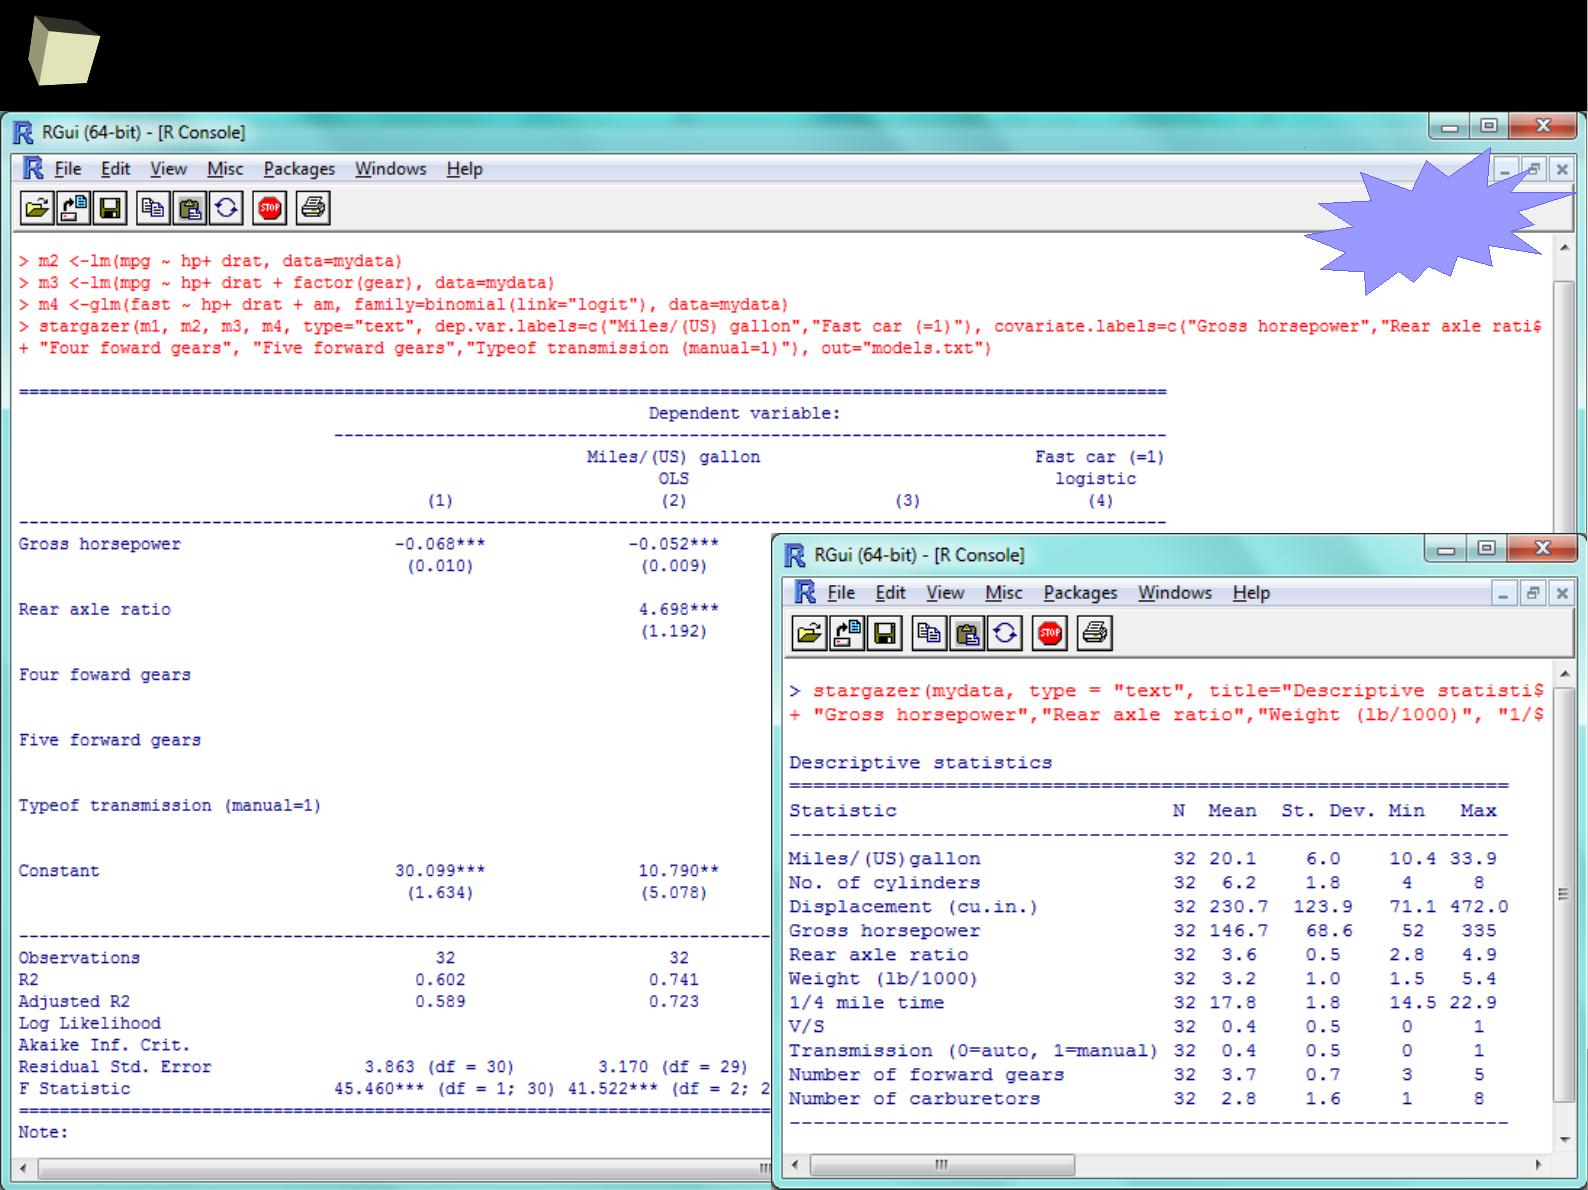
2
3
1
stargazer - ASCII
ASCII
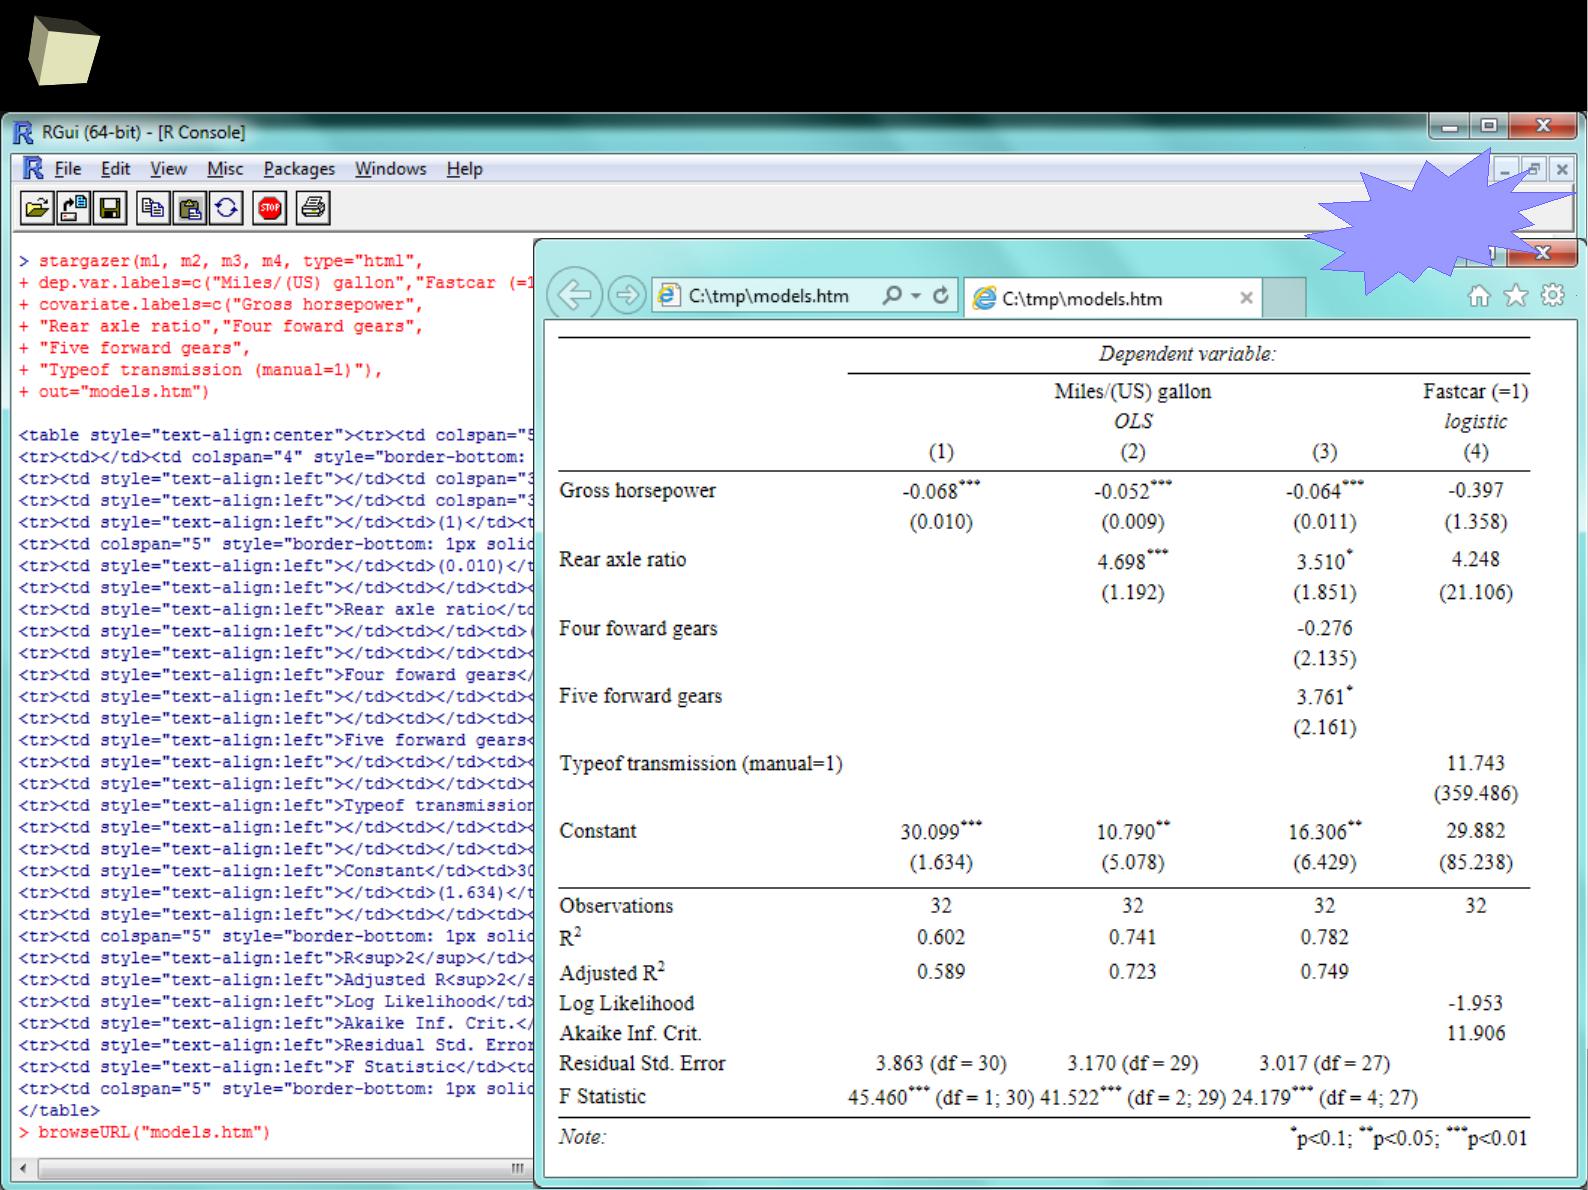
2
3
2
stargazer - HTML
HTML

2
3
3
stargazer - models
List of models supported by stargazzer:
1. aftreg (eha),
2. betareg (betareg),
3. binaryChoice (sampleSelection),
4. bj (rms),
5. brglm (brglm),
6. coeftest (lmtest),
7. coxph (survival),
8. coxreg (eha),
9. clm (ordinal),
10. clogit (survival),
11. cph (rms),
12. dynlm (dynlm),
13. ergm (ergm),
14. errorsarlm (spdev),
15. felm (lfe),
16. gam (mgcv),
17. gee (gee),
18. glm (stats),
19. Glm (rms),
20. glmer (lme4),
21. gls (nlme),
22. Gls (rms),
23. gmm (gmm),
24. heckit (sampleSelection),
25. hetglm (glmx),
26. hurdle (pscl),
27. ivreg (AER)
28. lagarlm (spdep),
29. lm (stats),
30. lmer (lme4),
31. lmrob (robustbase),
32. lrm (rms),
33. maBina (erer),
34. mclogit (mclogit),
35. mlogit (mlogit),
36. mlreg (eha),
37. multinom (nnet),
38. nlmer (lme4),
39. ols (rms),
40. phreg (eha),
41. plm (plm),
42. pmg (plm),
43. polr (MASS),
44. psm (rms),
45. rem.dyad (relevent),
46. rlm (MASS),
47. rq (quantreg),
48. Rq (rms),
49. selection (sampleSelection),
50. svyglm (survey),
51. survreg (survival),
52. tobit (AER),
53. weibreg (eha),
54. zeroin (pscl)
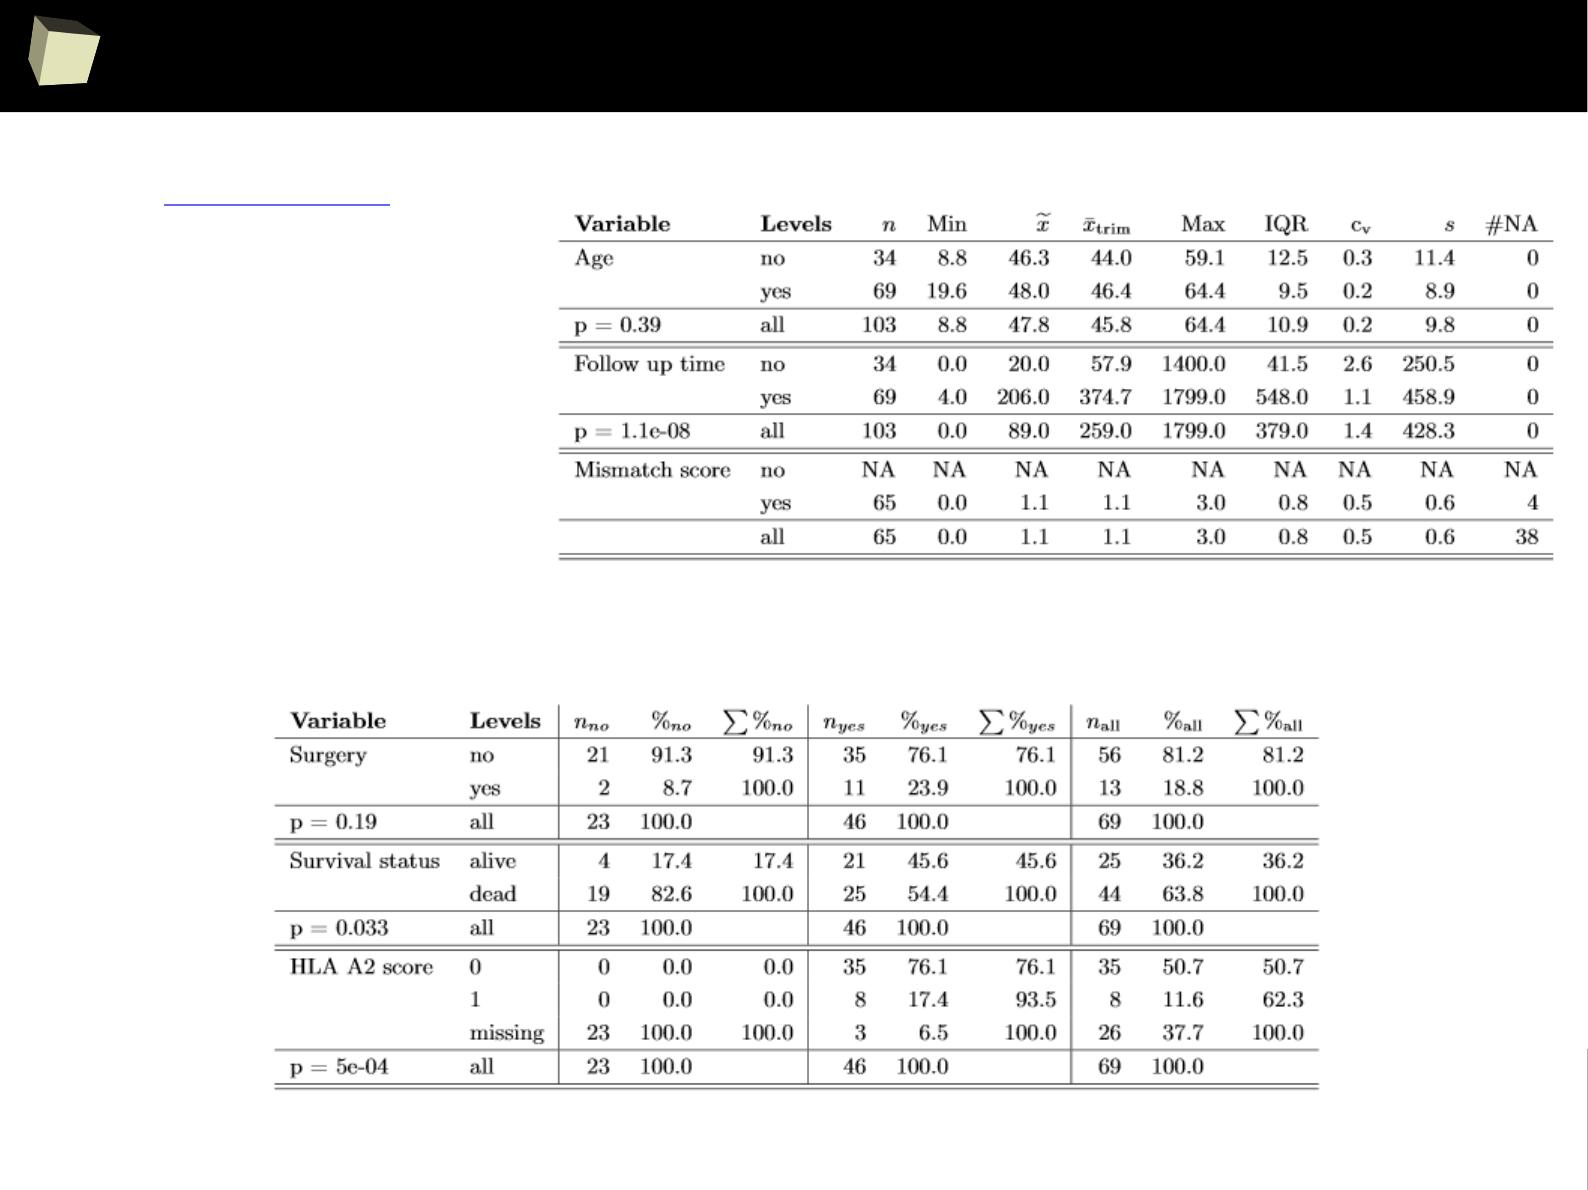
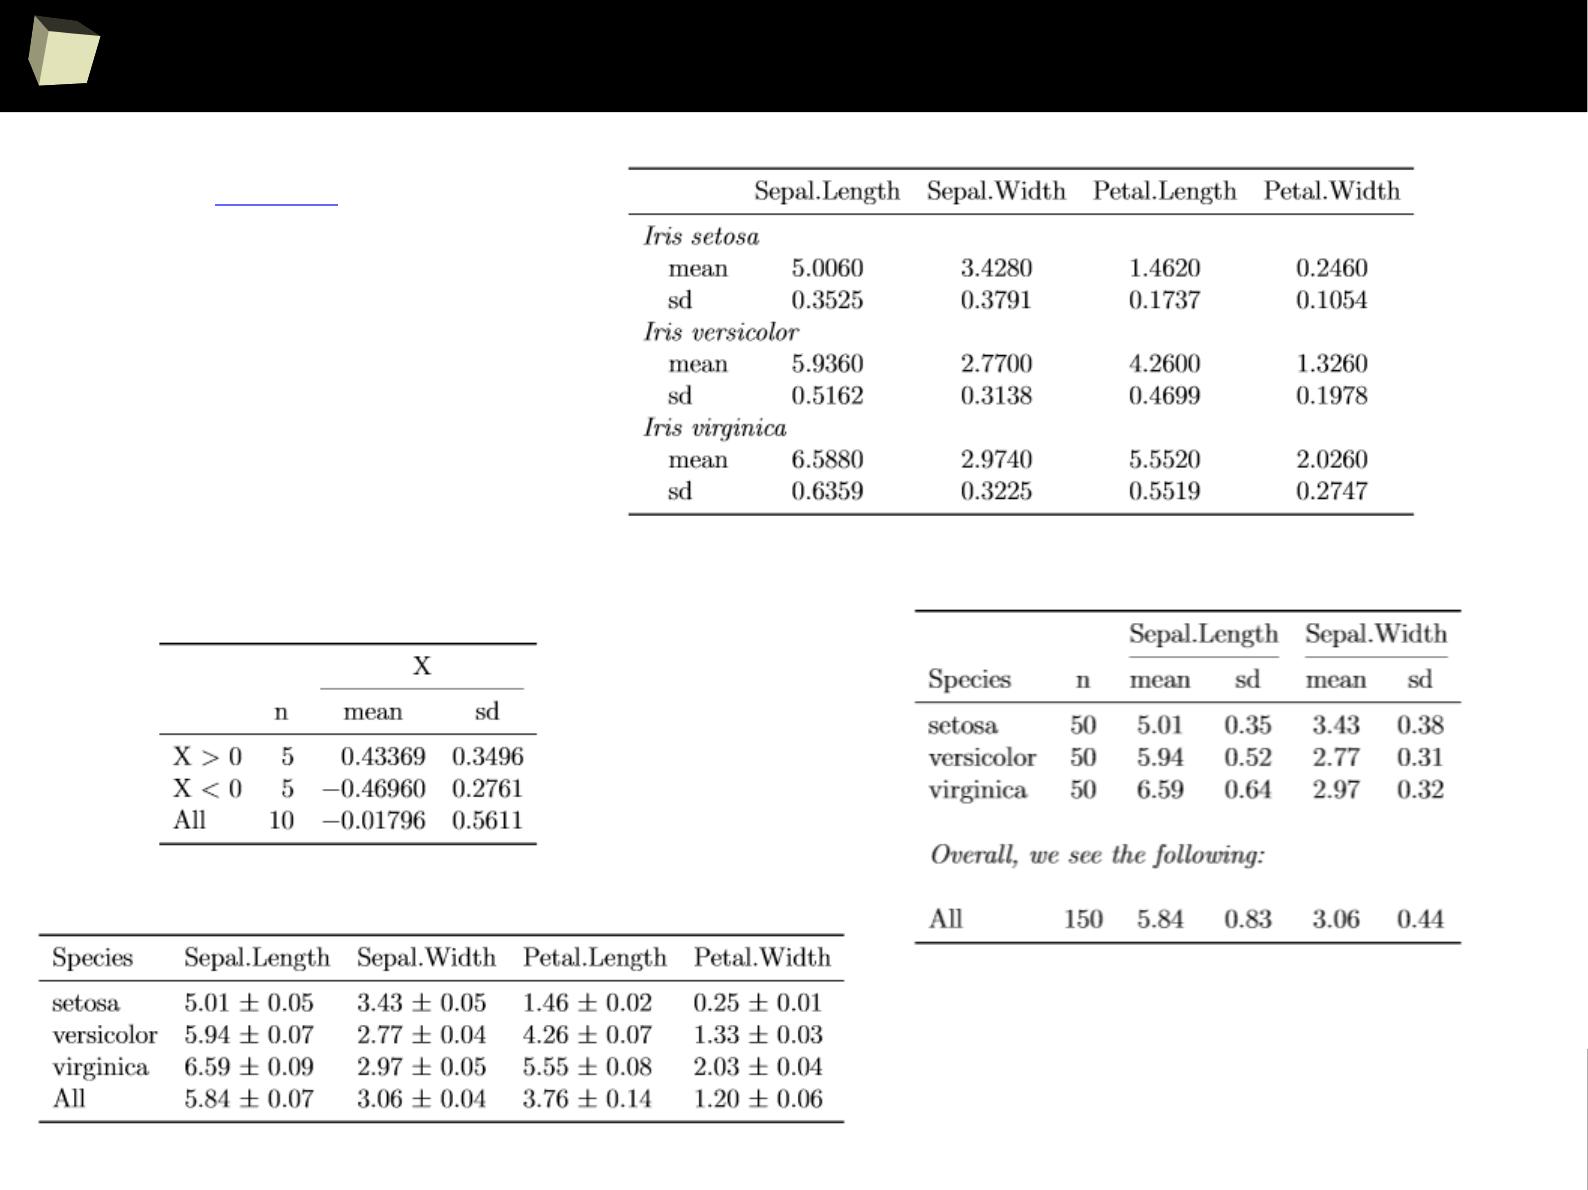
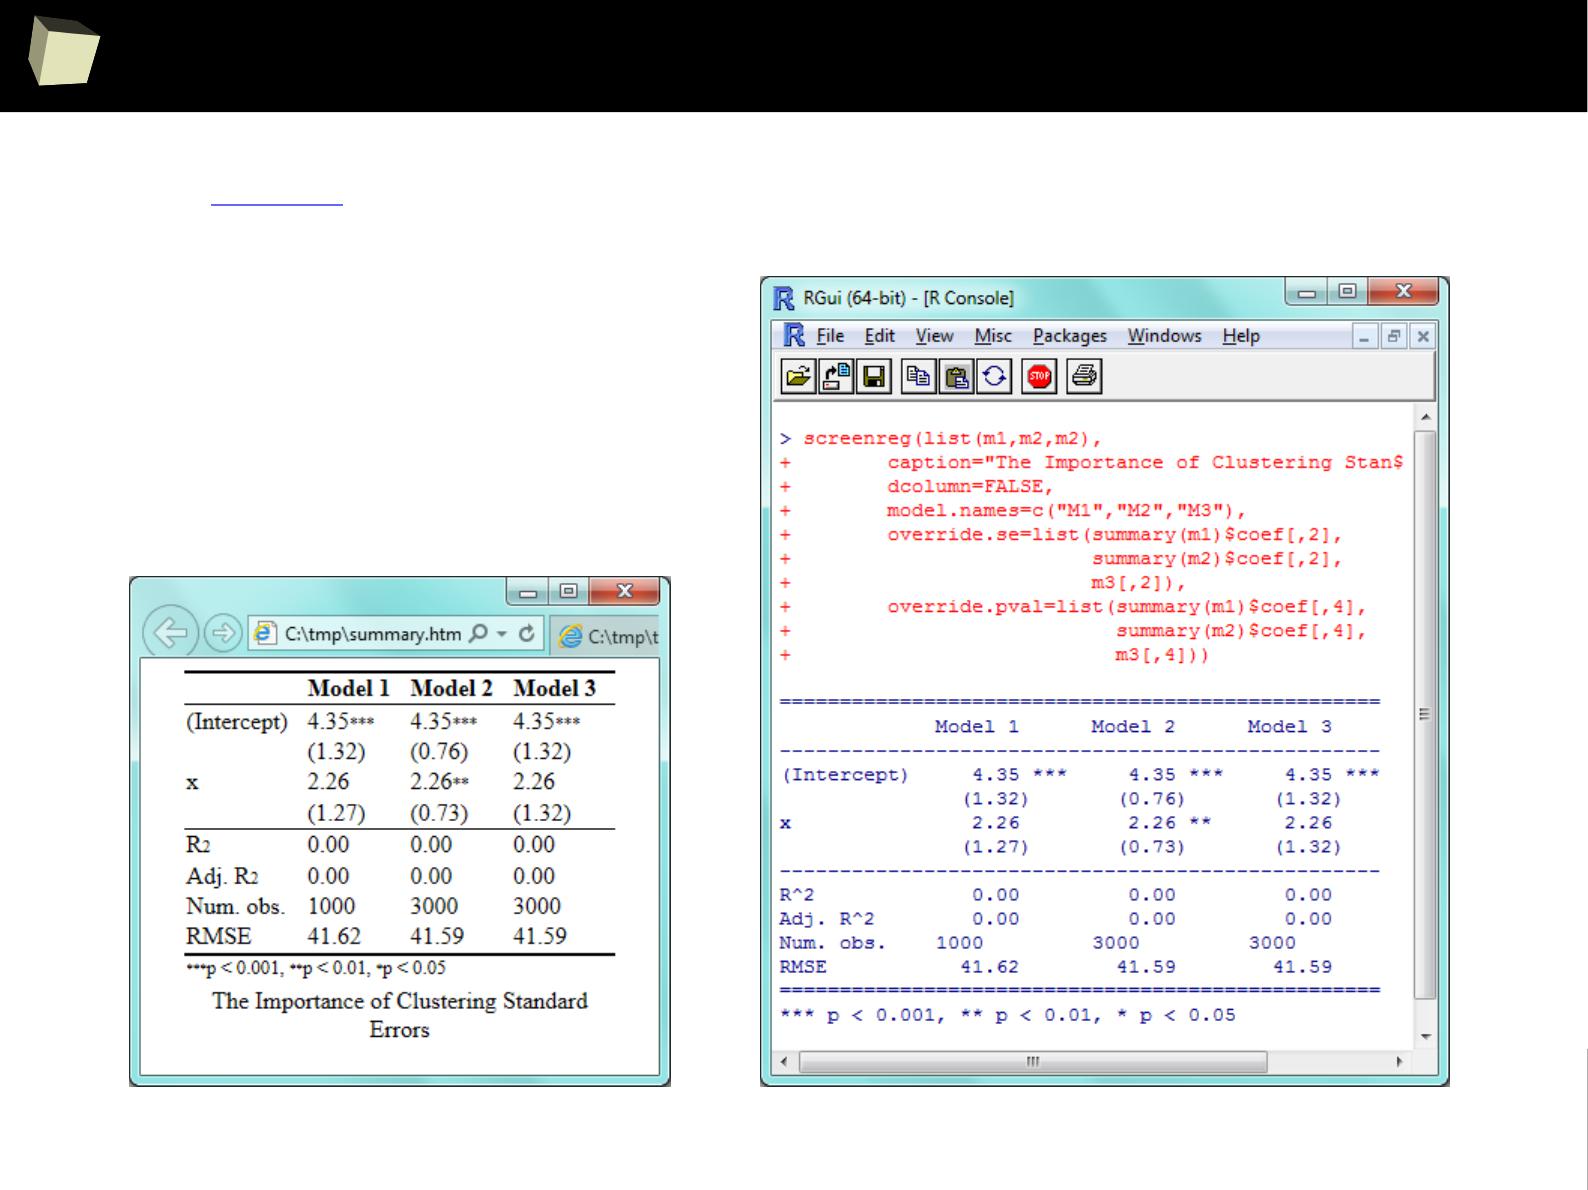
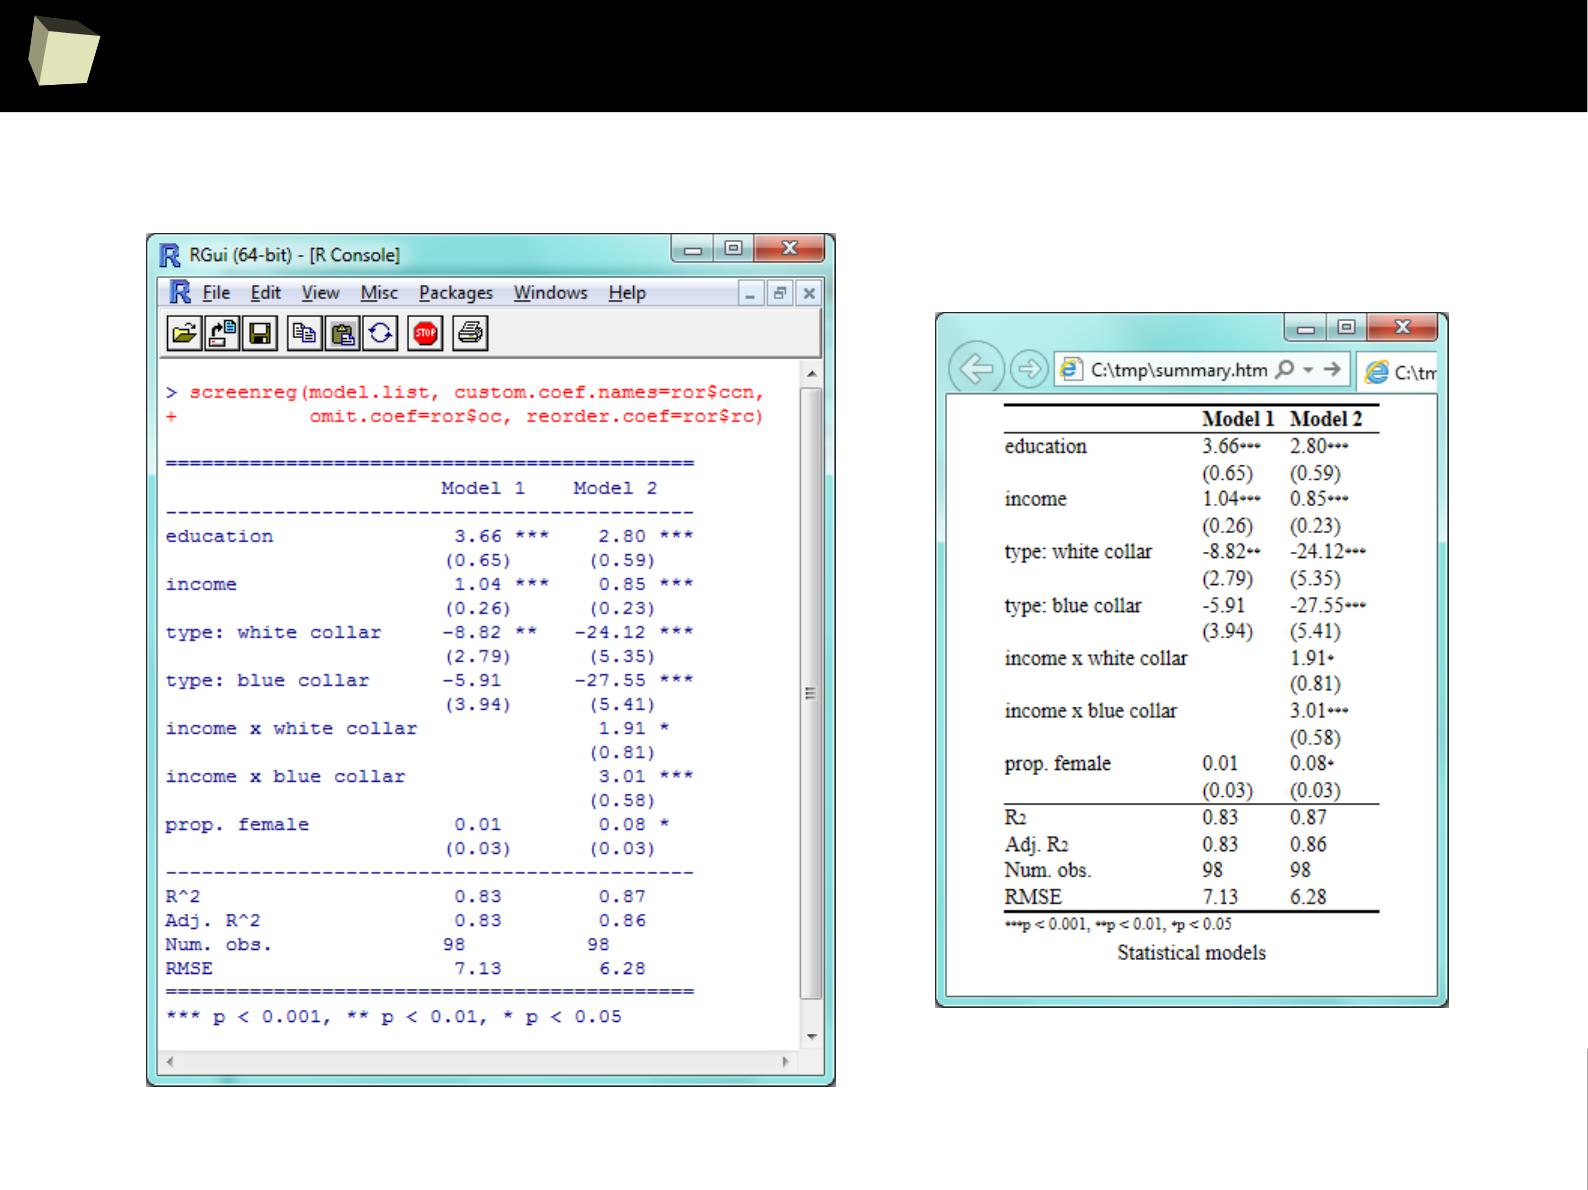
2
3
7
textreg – LaTeX, HTML, ASCII
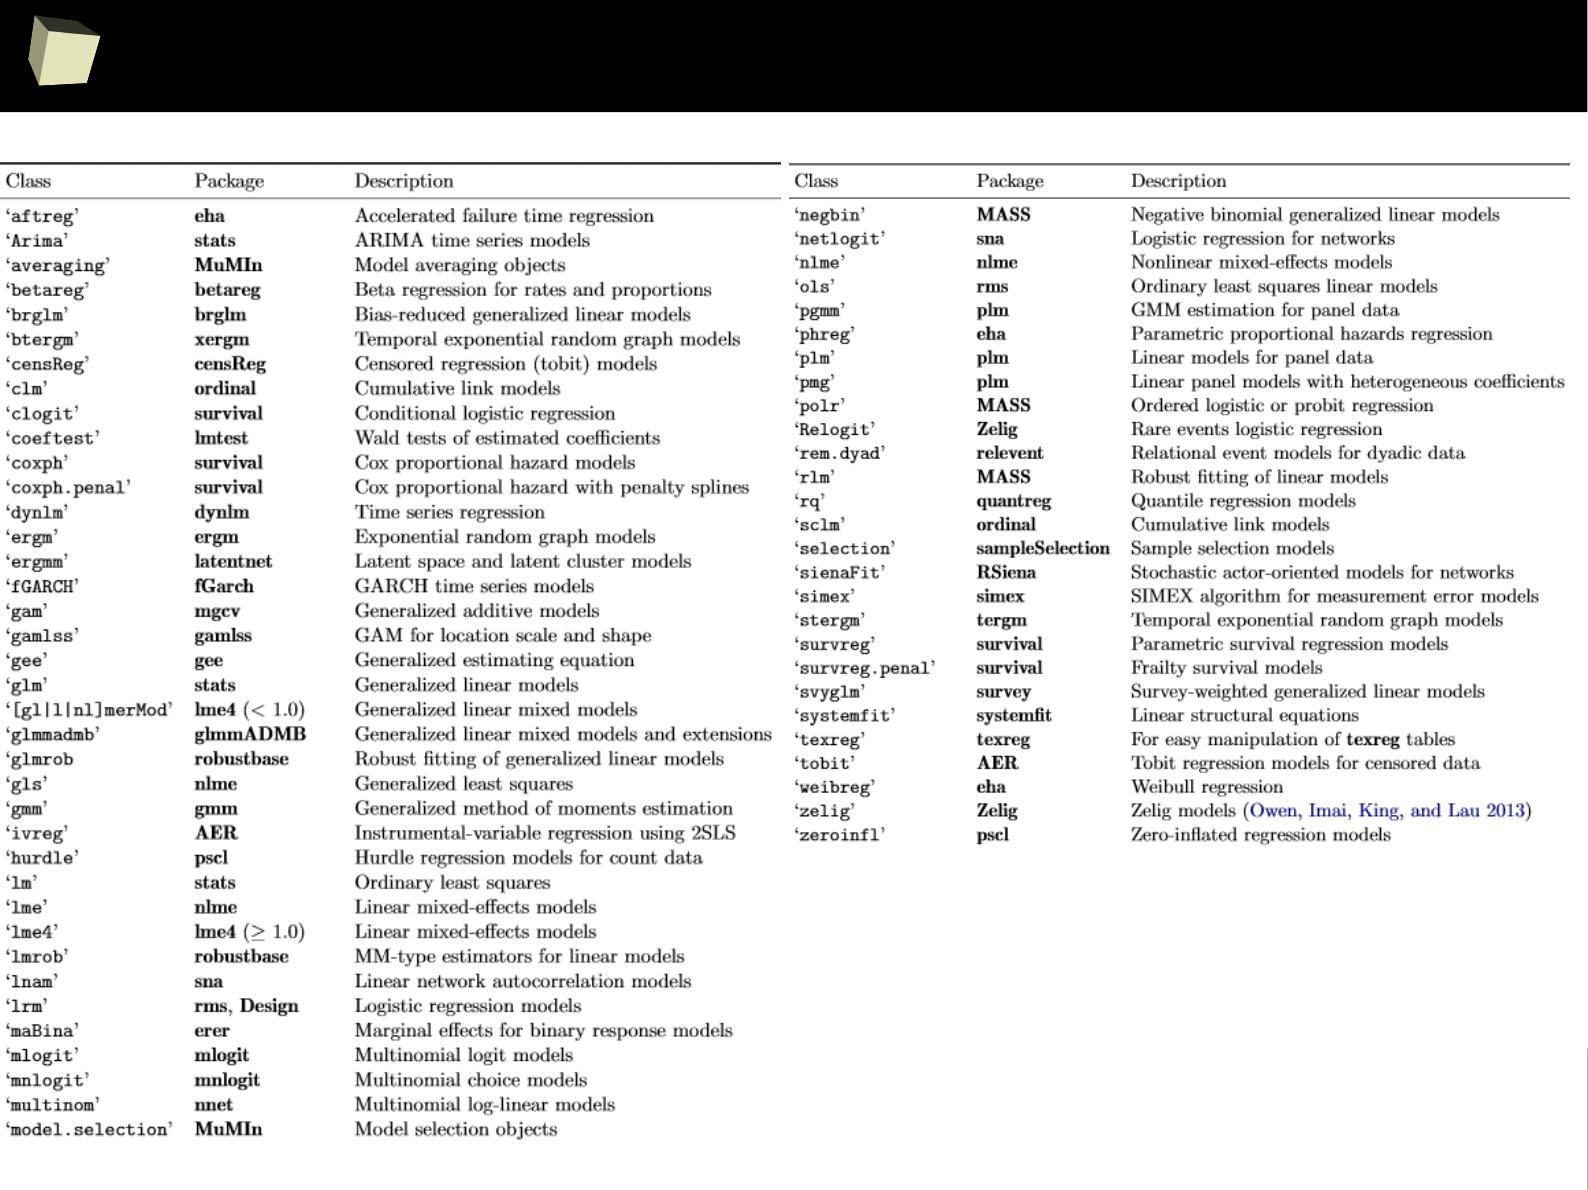
2
3
8
textreg – list of supported models
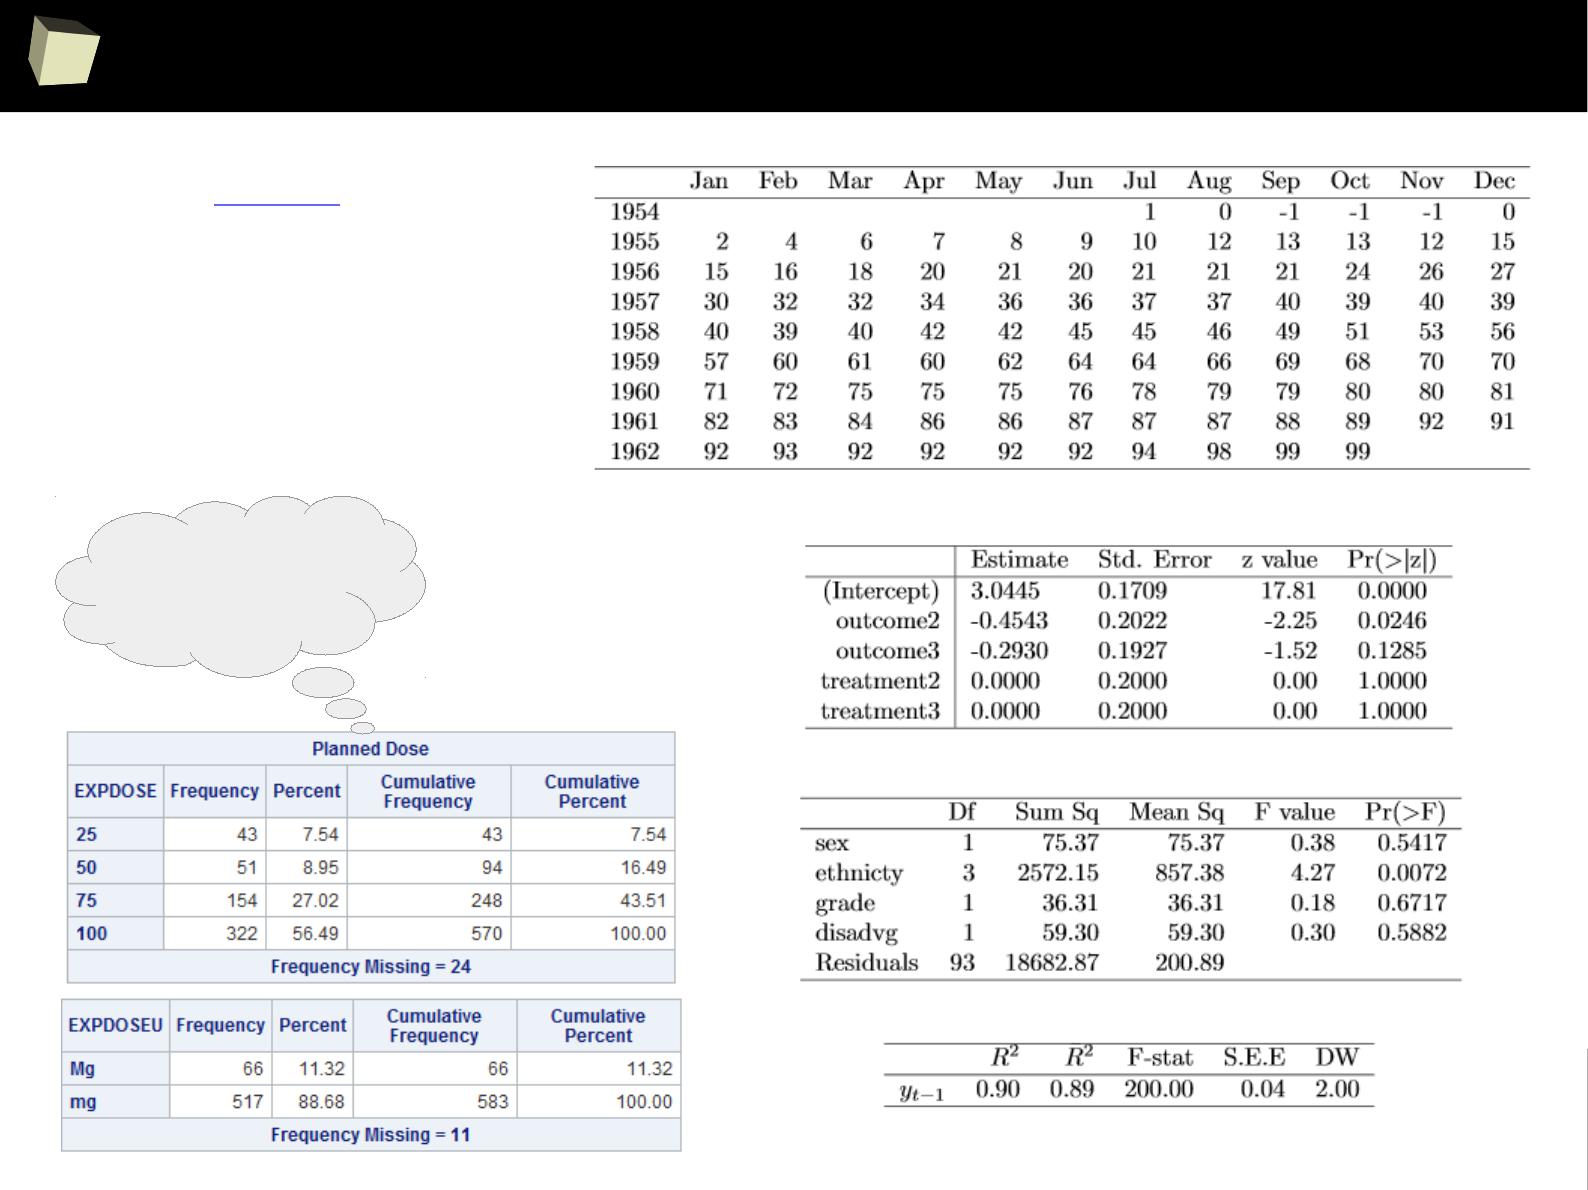
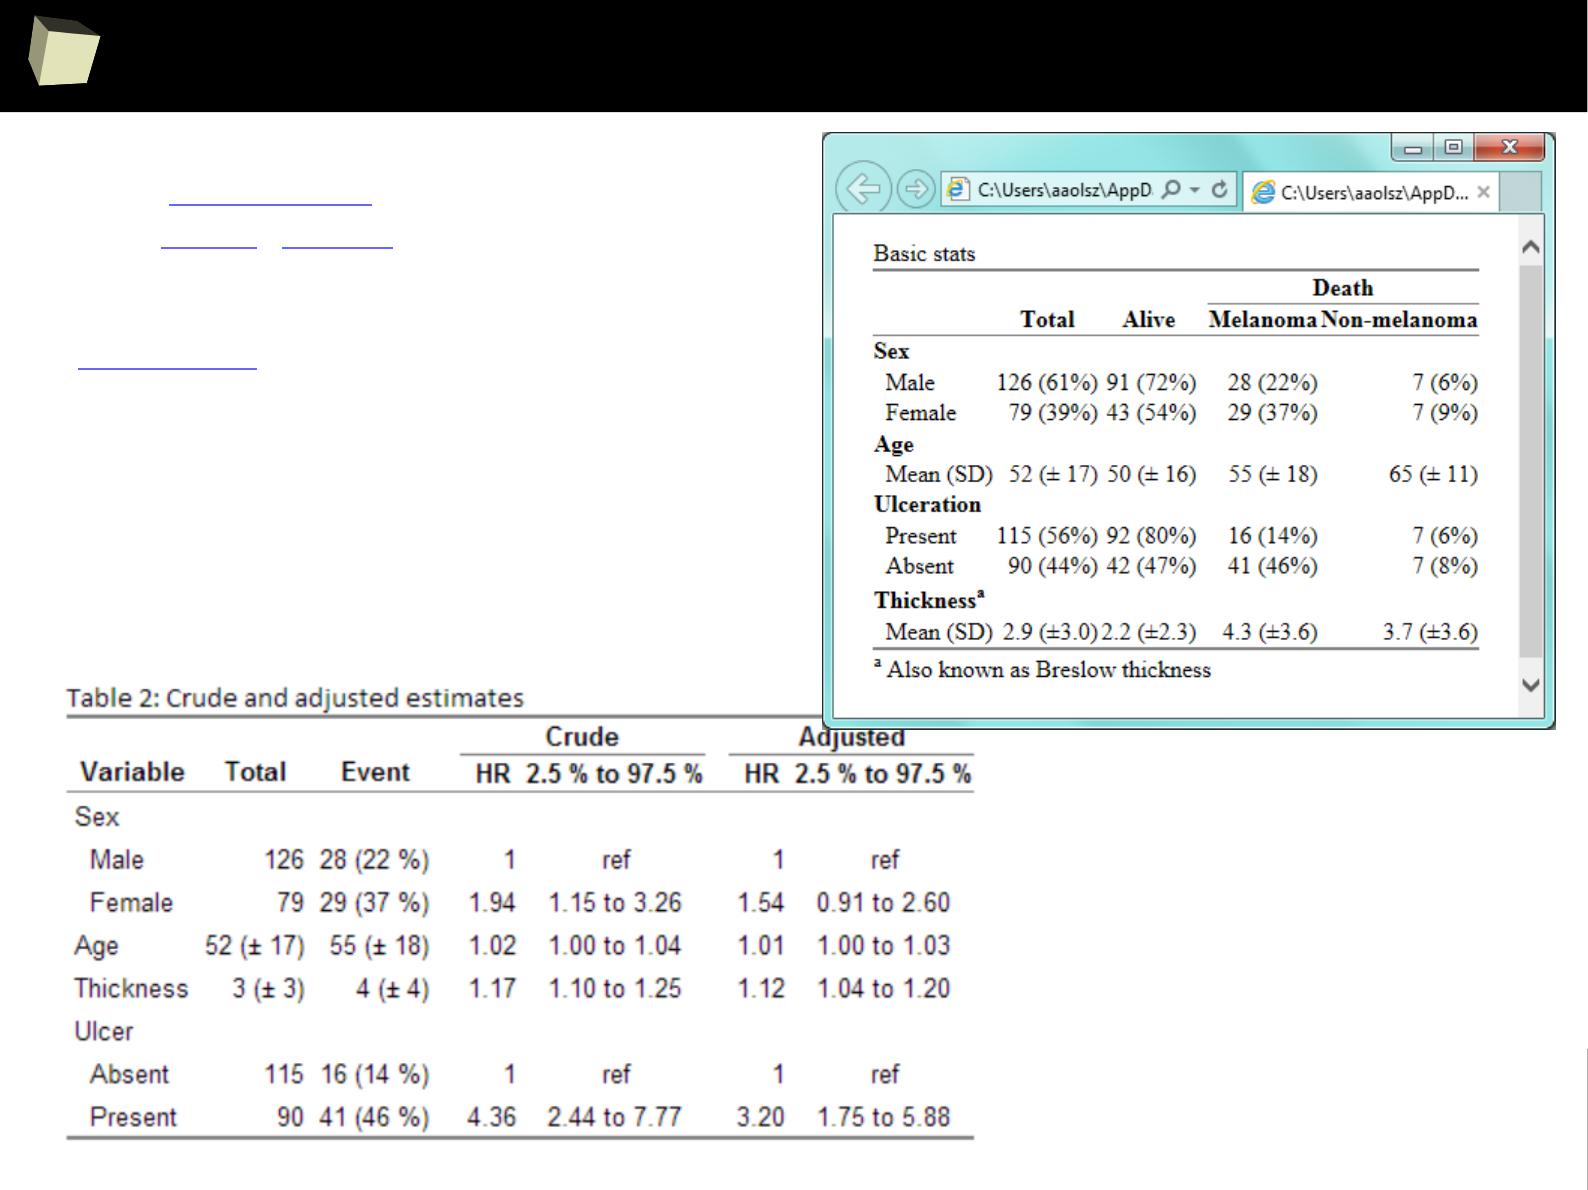
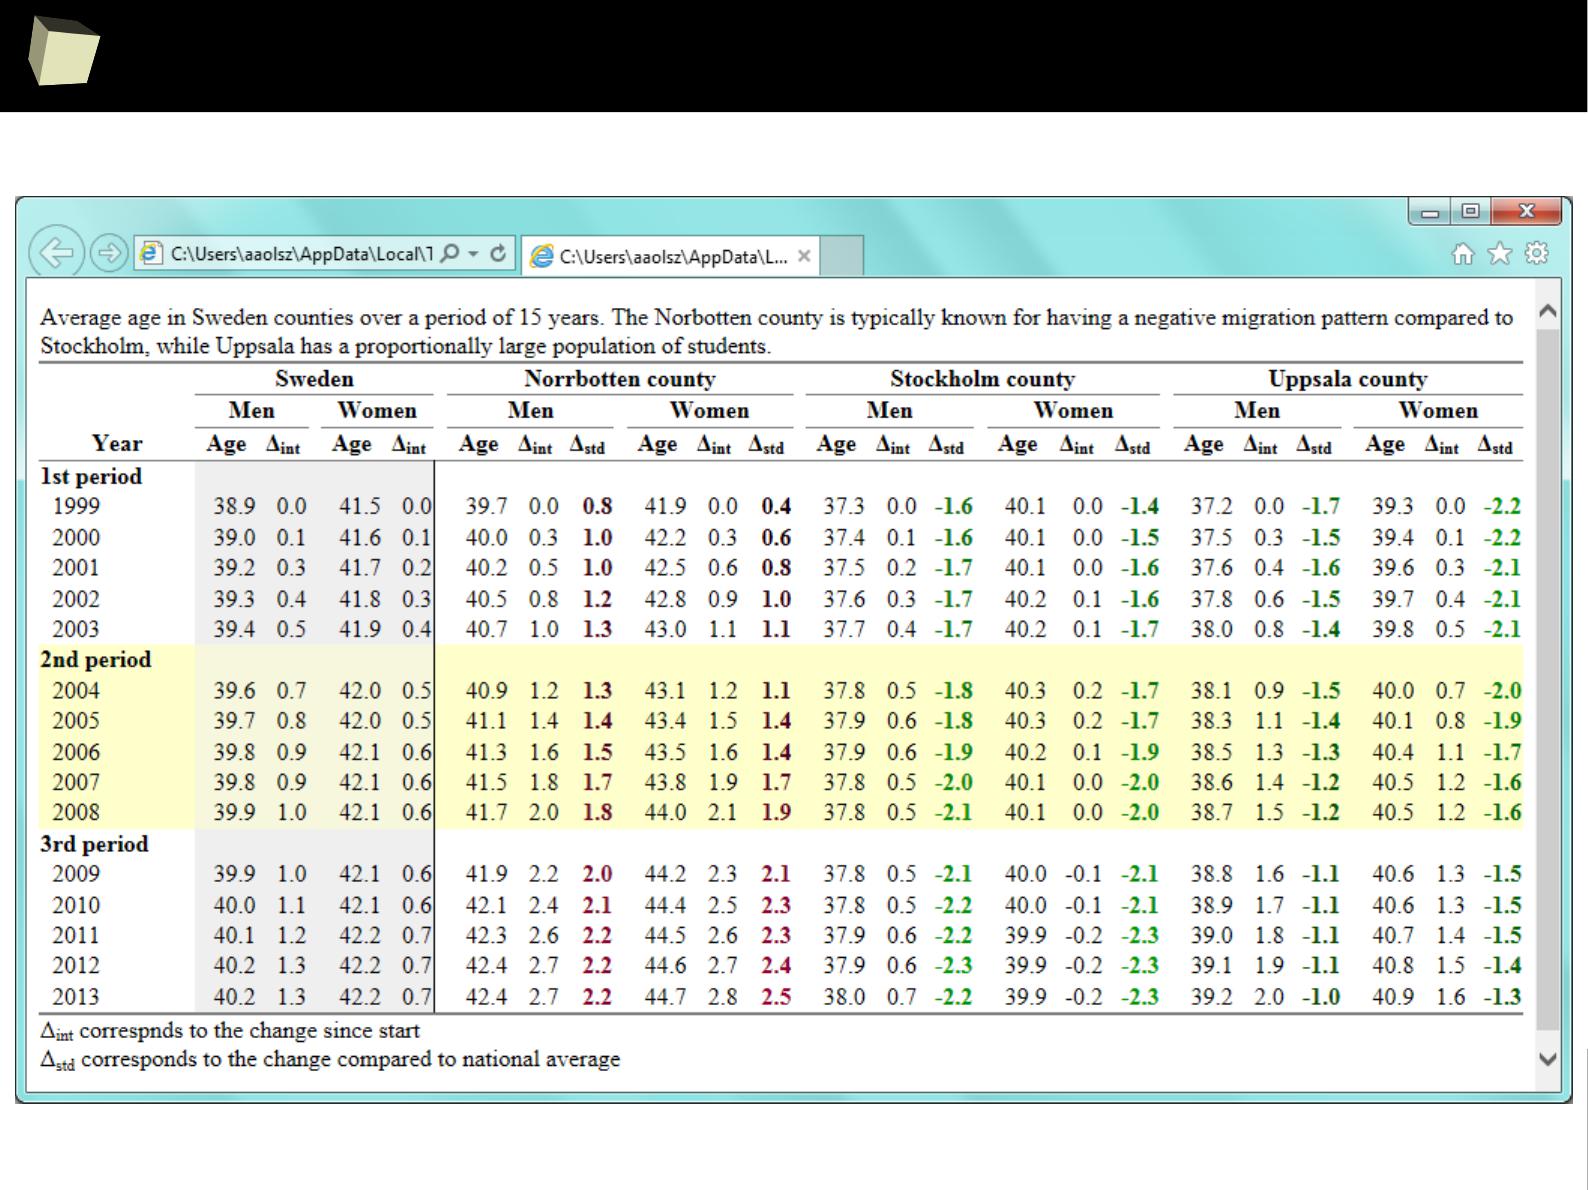
2
4
1
htmlTable
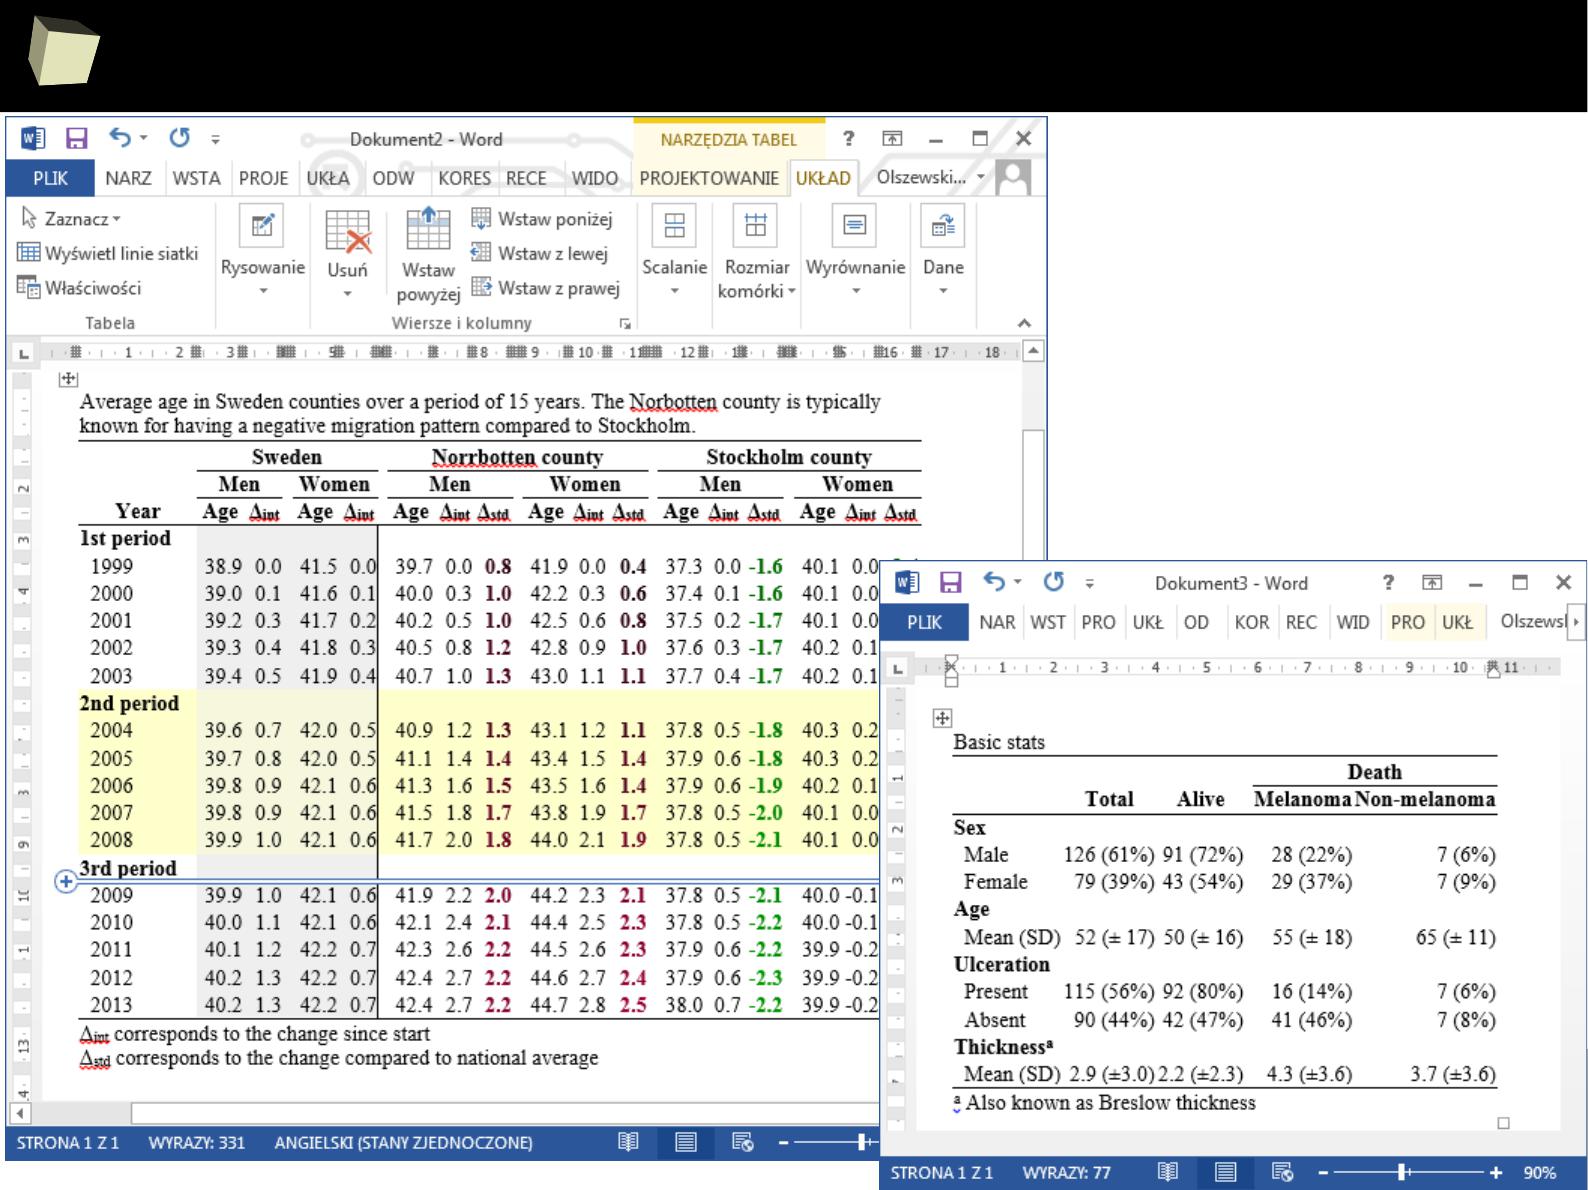
2
4
2
htmlTable in MS Word
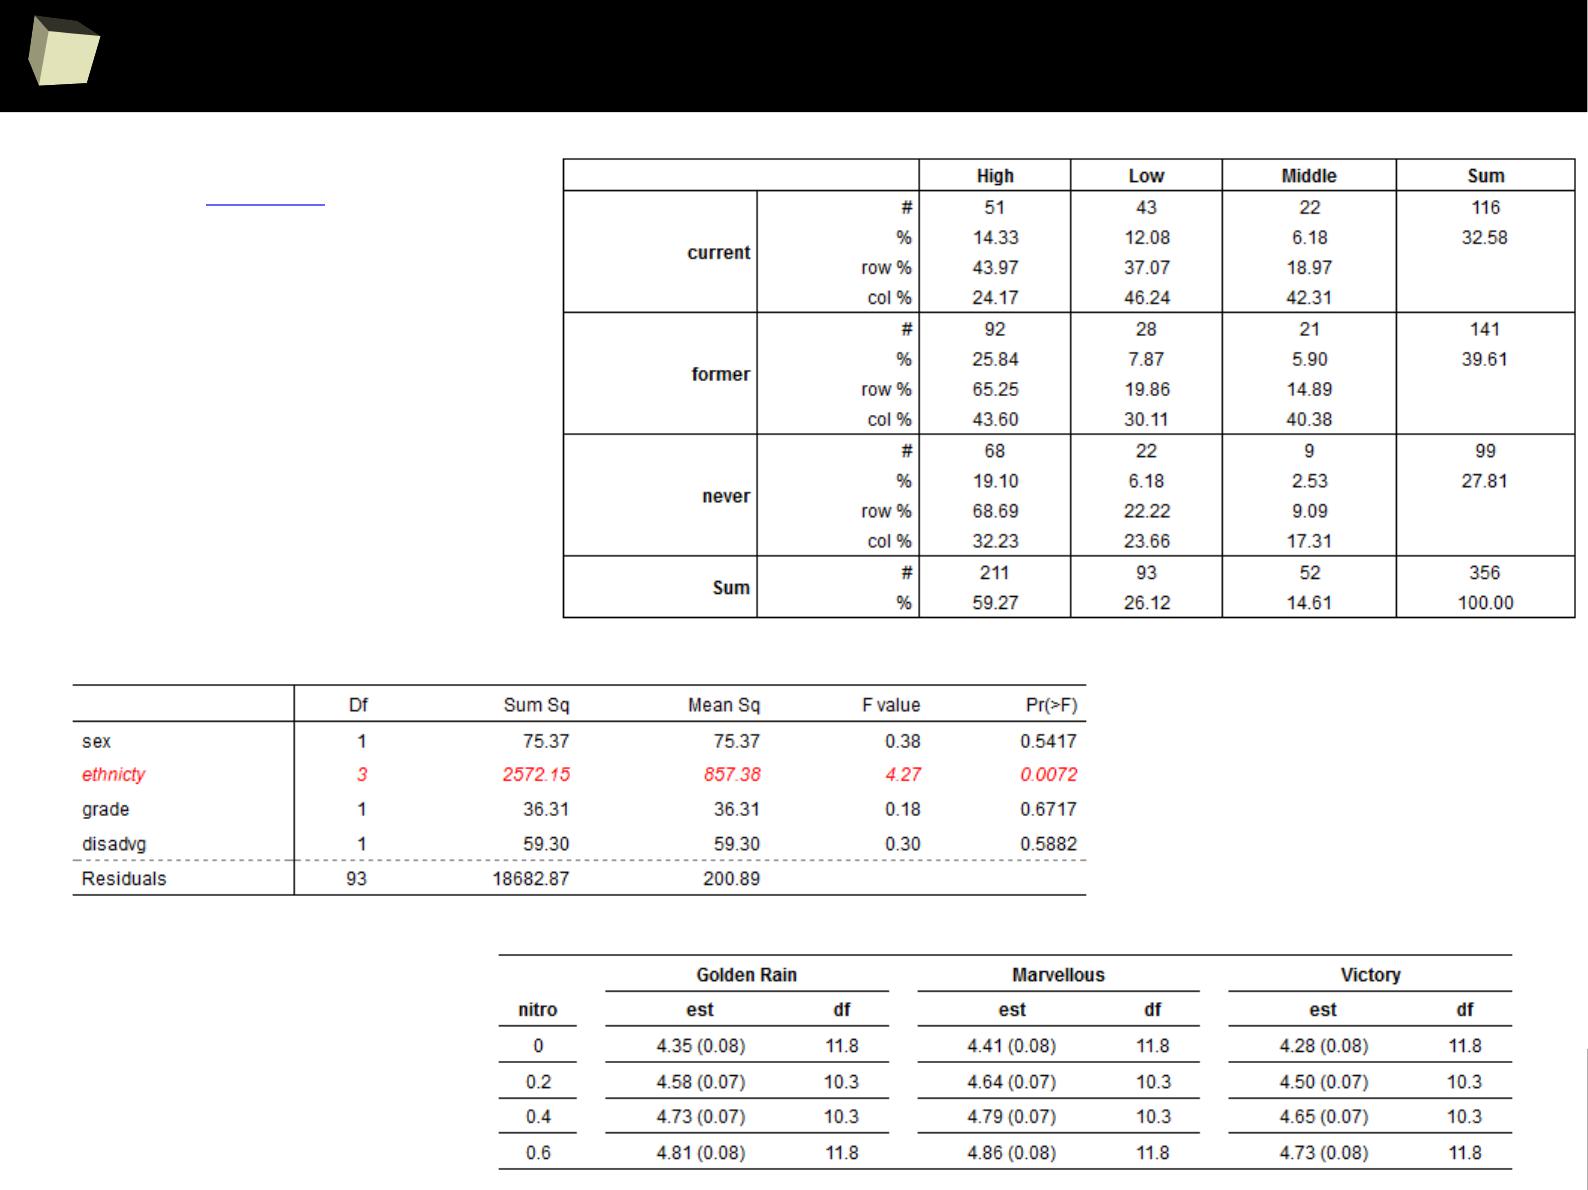

2
4
4
13 reasons why you will love GNU R
I R is (extremely) cheap. In fact - it's free :)
II R has (extremely) wide range of capabilities
III R is (widely) supported by the world of science
IV R is supported by the community
V R is (increasingly) supported by the business
VI R is able to read data in many formats
VII Interoperability is easy to achieve
VIII R is truly cross-platform
IX 2/3 :) Graphics – all have waited for this moment :)
X There are many possibilities to optimize the code
XI R is able to handle large amount of data
XII R has a set of fancy tools and IDEs
XII FDA accepted using R for drug trials!
2
4
5
a picture is woRth a thousand words
It is really hard to describe all the potential of R in creating graphics.
Internet is full of of examples and tutorials of how to create complex and
sophisticated charts in R. There are thousands of examples.
The user has at his disposal a number of libraries allowing creation of
almost every chart or graphics he needs. R is able to produce clean,
ascetic charts suitable for journals and books, and super fancy graphics,
perfect for presentations.
Imagination
is the only limit here
http://rgraphgallery.blogspot.com/

2
4
6
11
th
commandment
If anything, there should be a Law:
Thou Shalt Not Even Think Of Producing A Graph
That Looks Like Anything From A Spreadsheet
Ted Harding
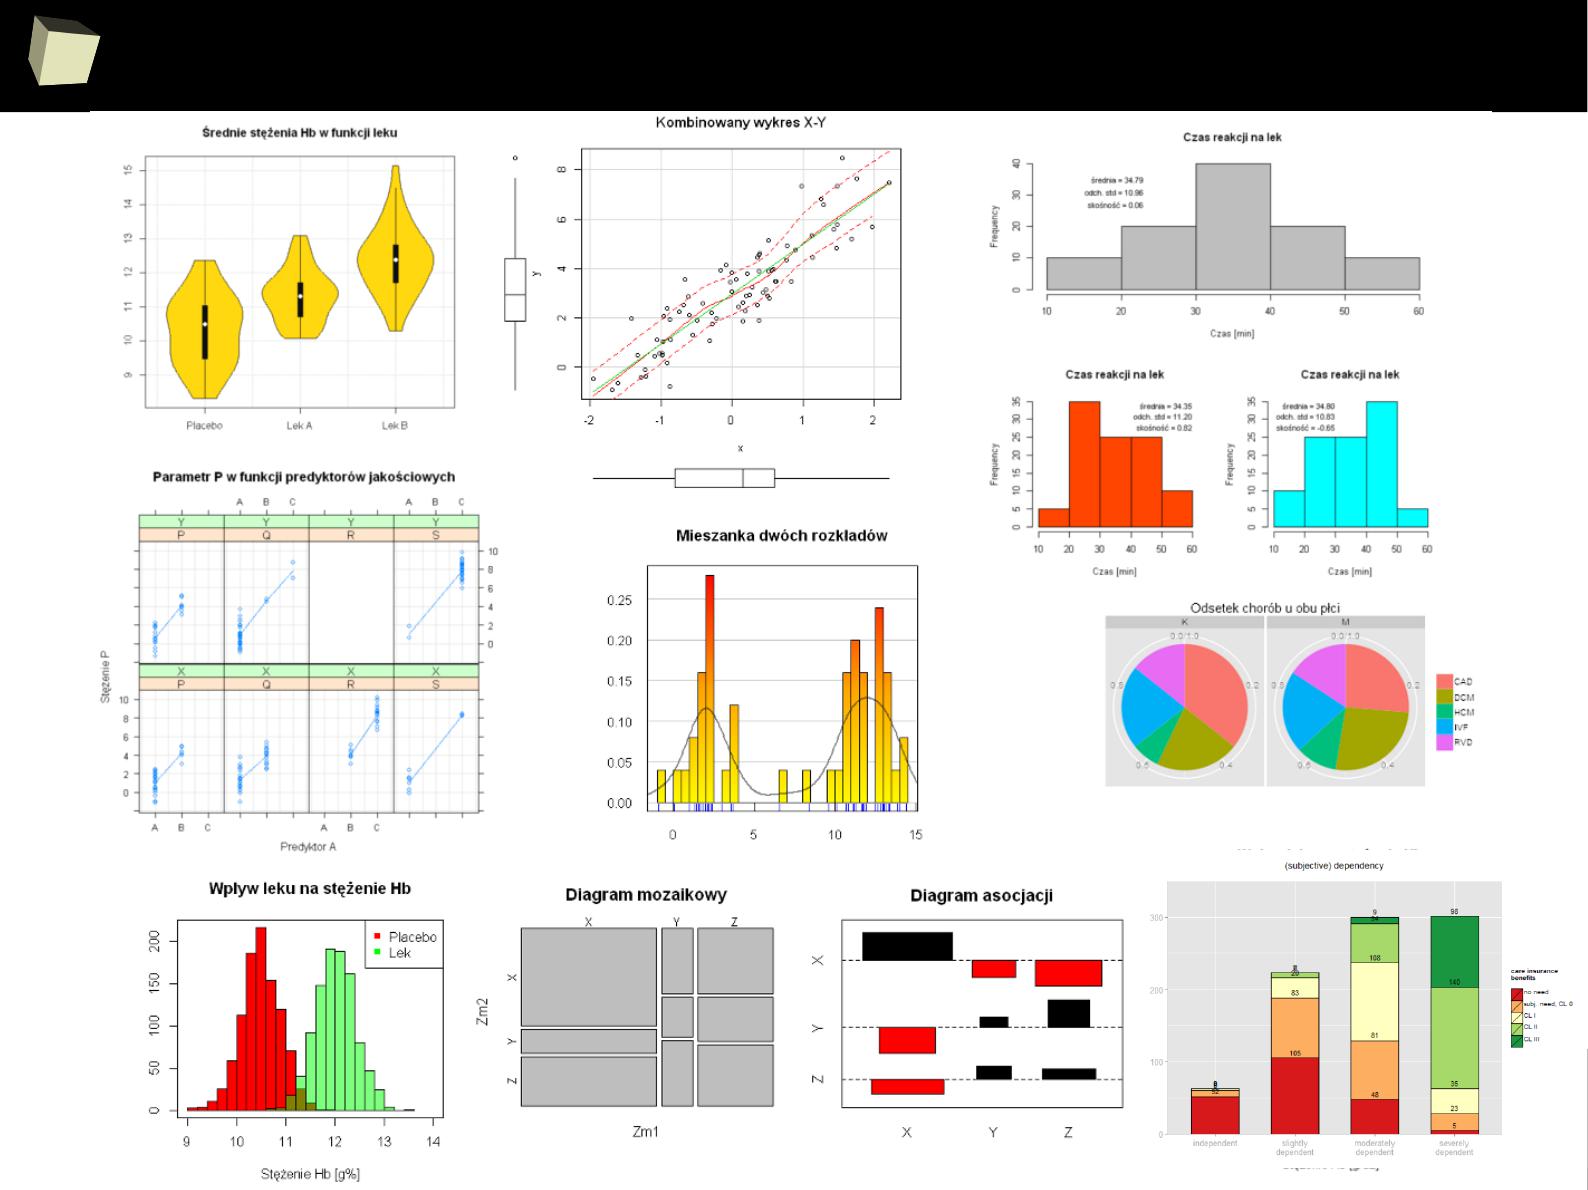
2
4
7
R has great charting capabilities
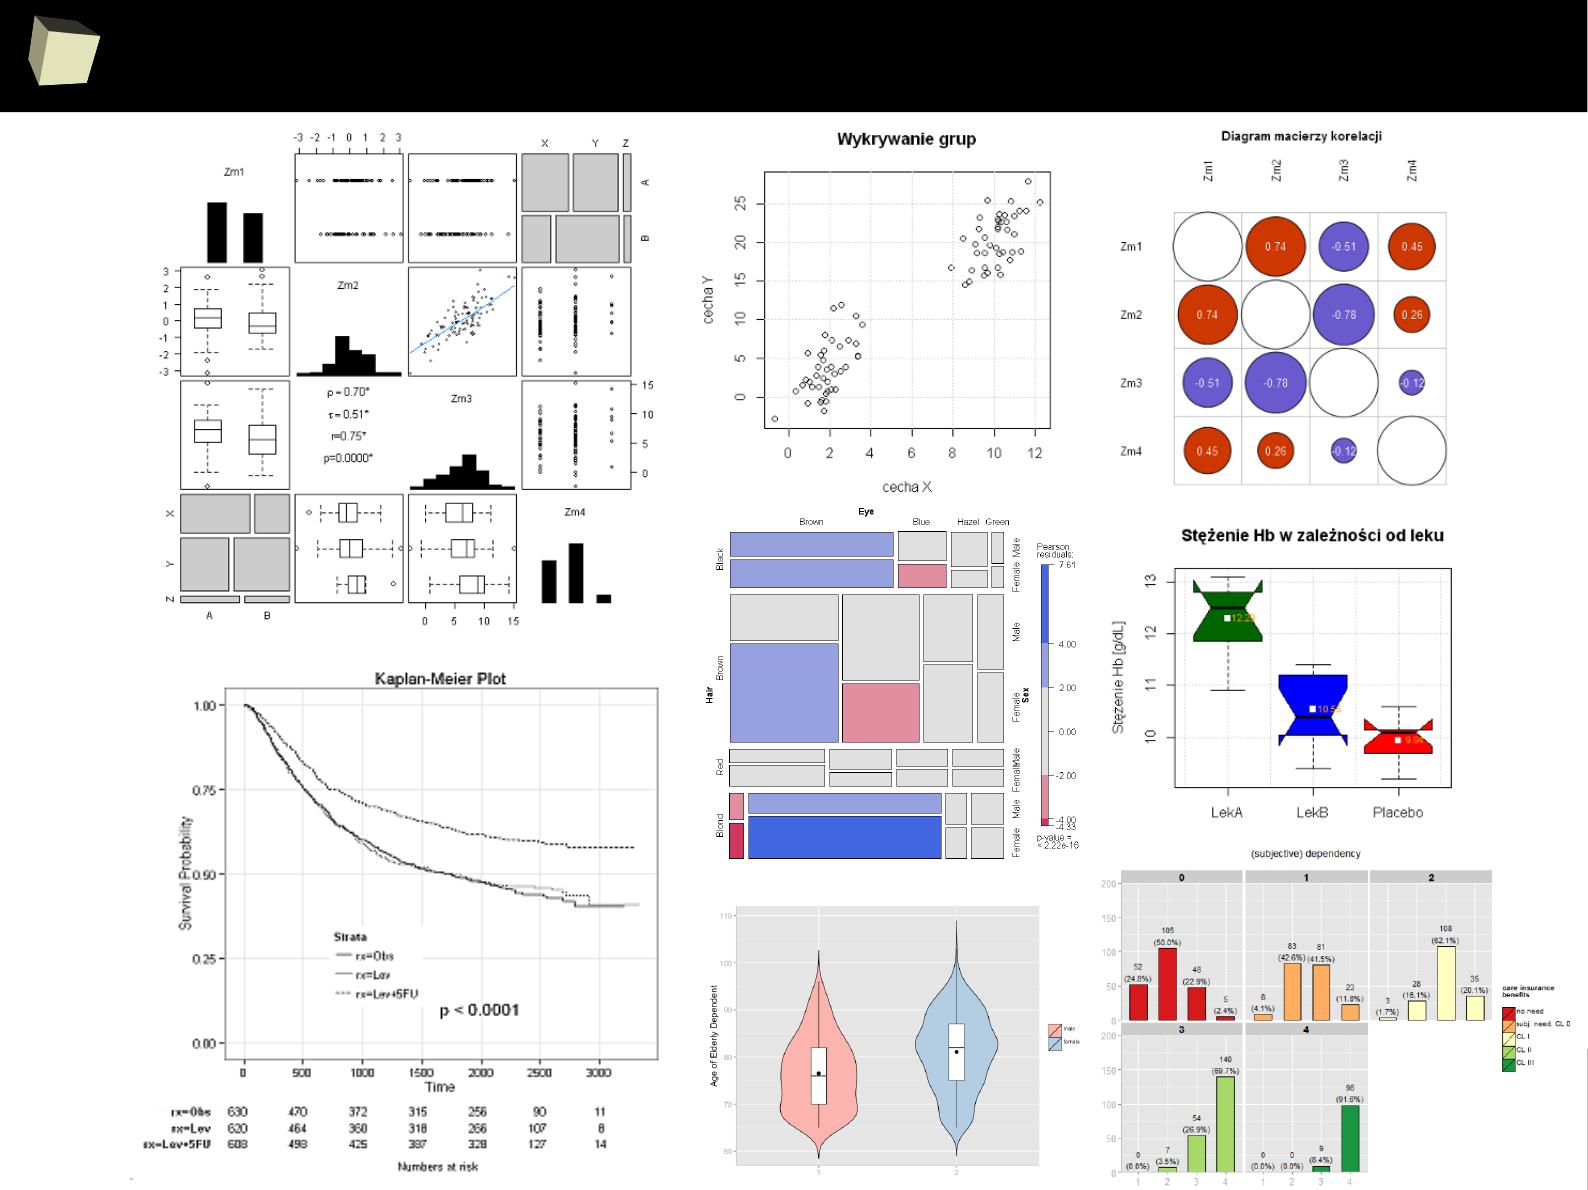
2
4
8
...of any kind
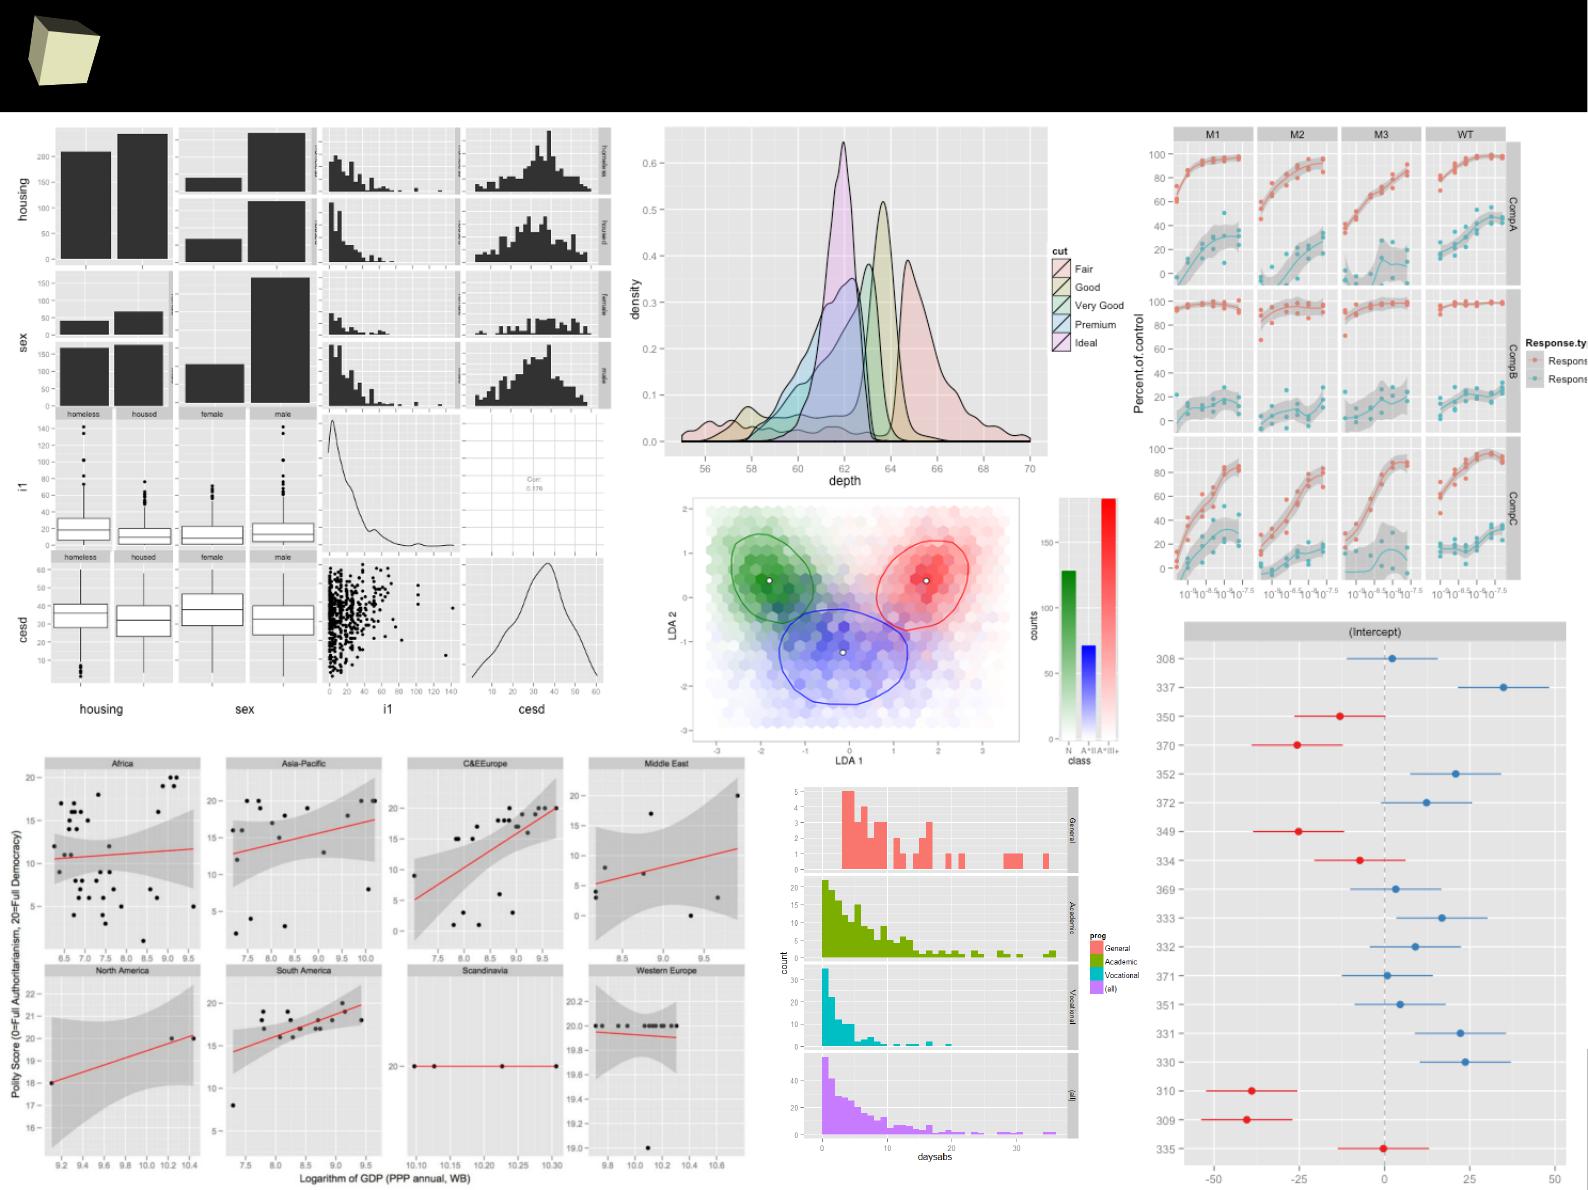
2
4
9
...and yes, these charts can be very elegant :)
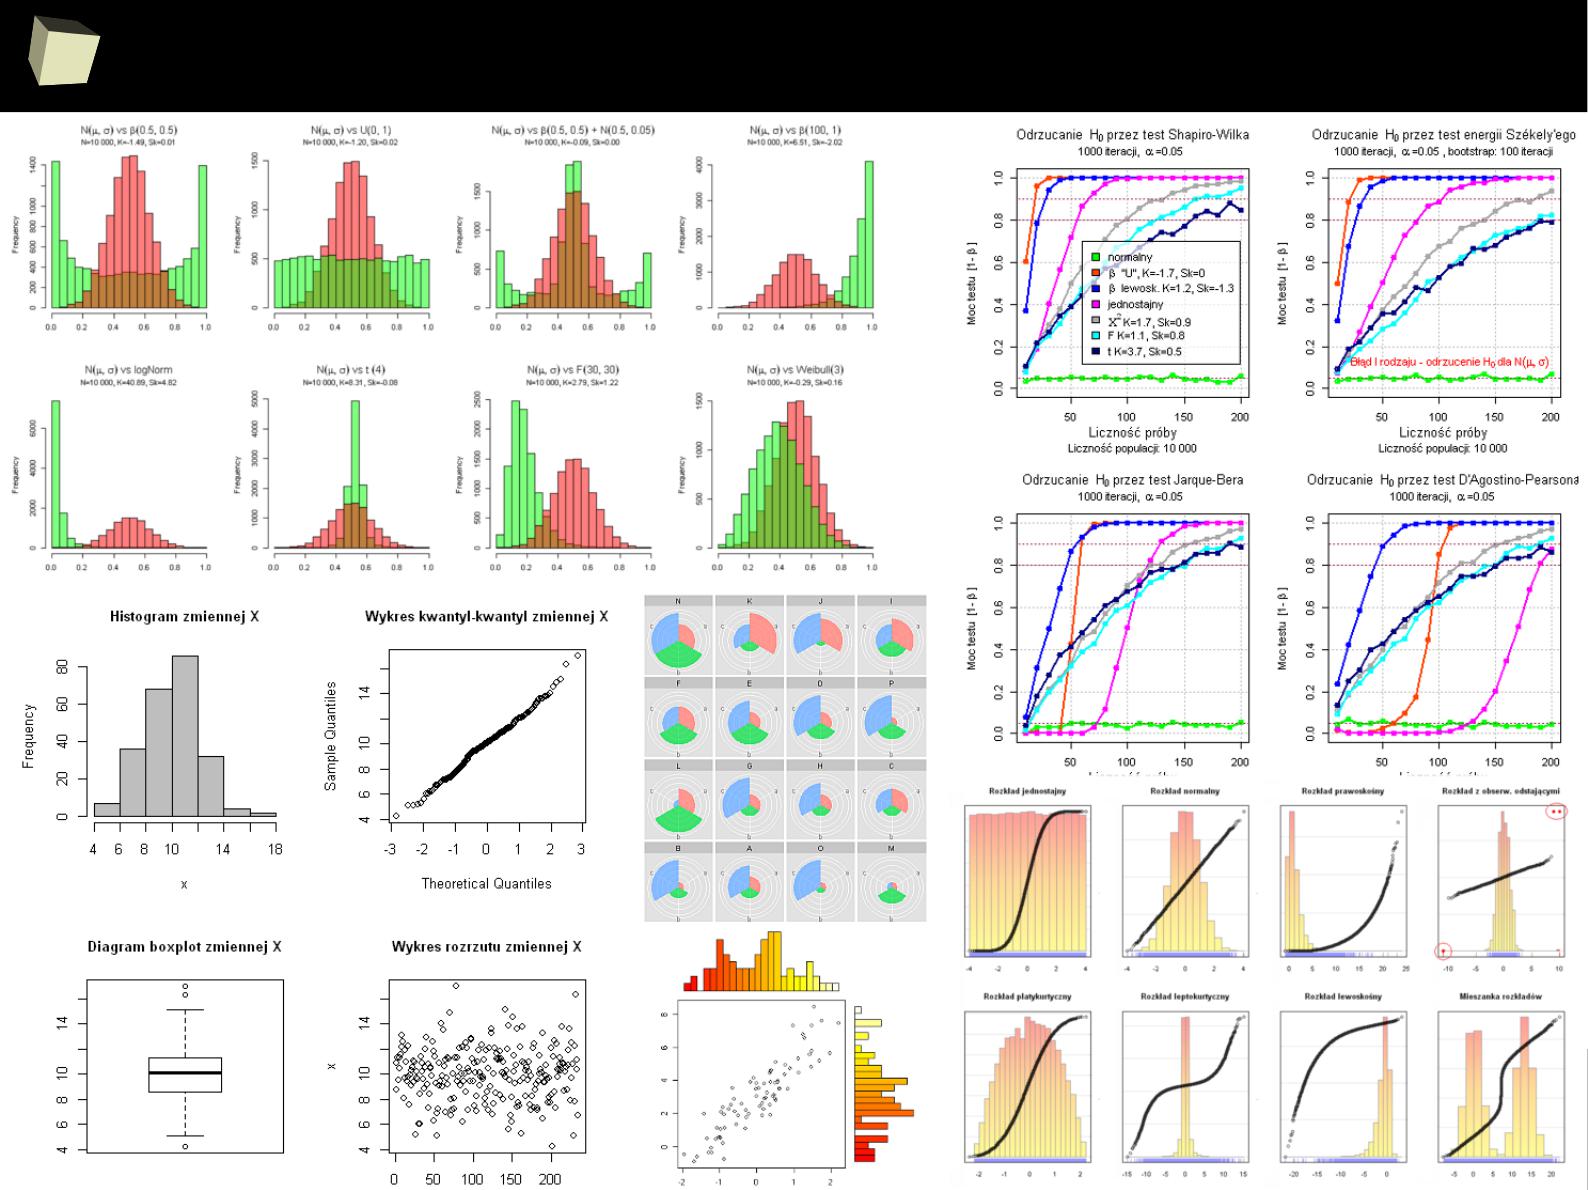
2
5
0
...and varied...
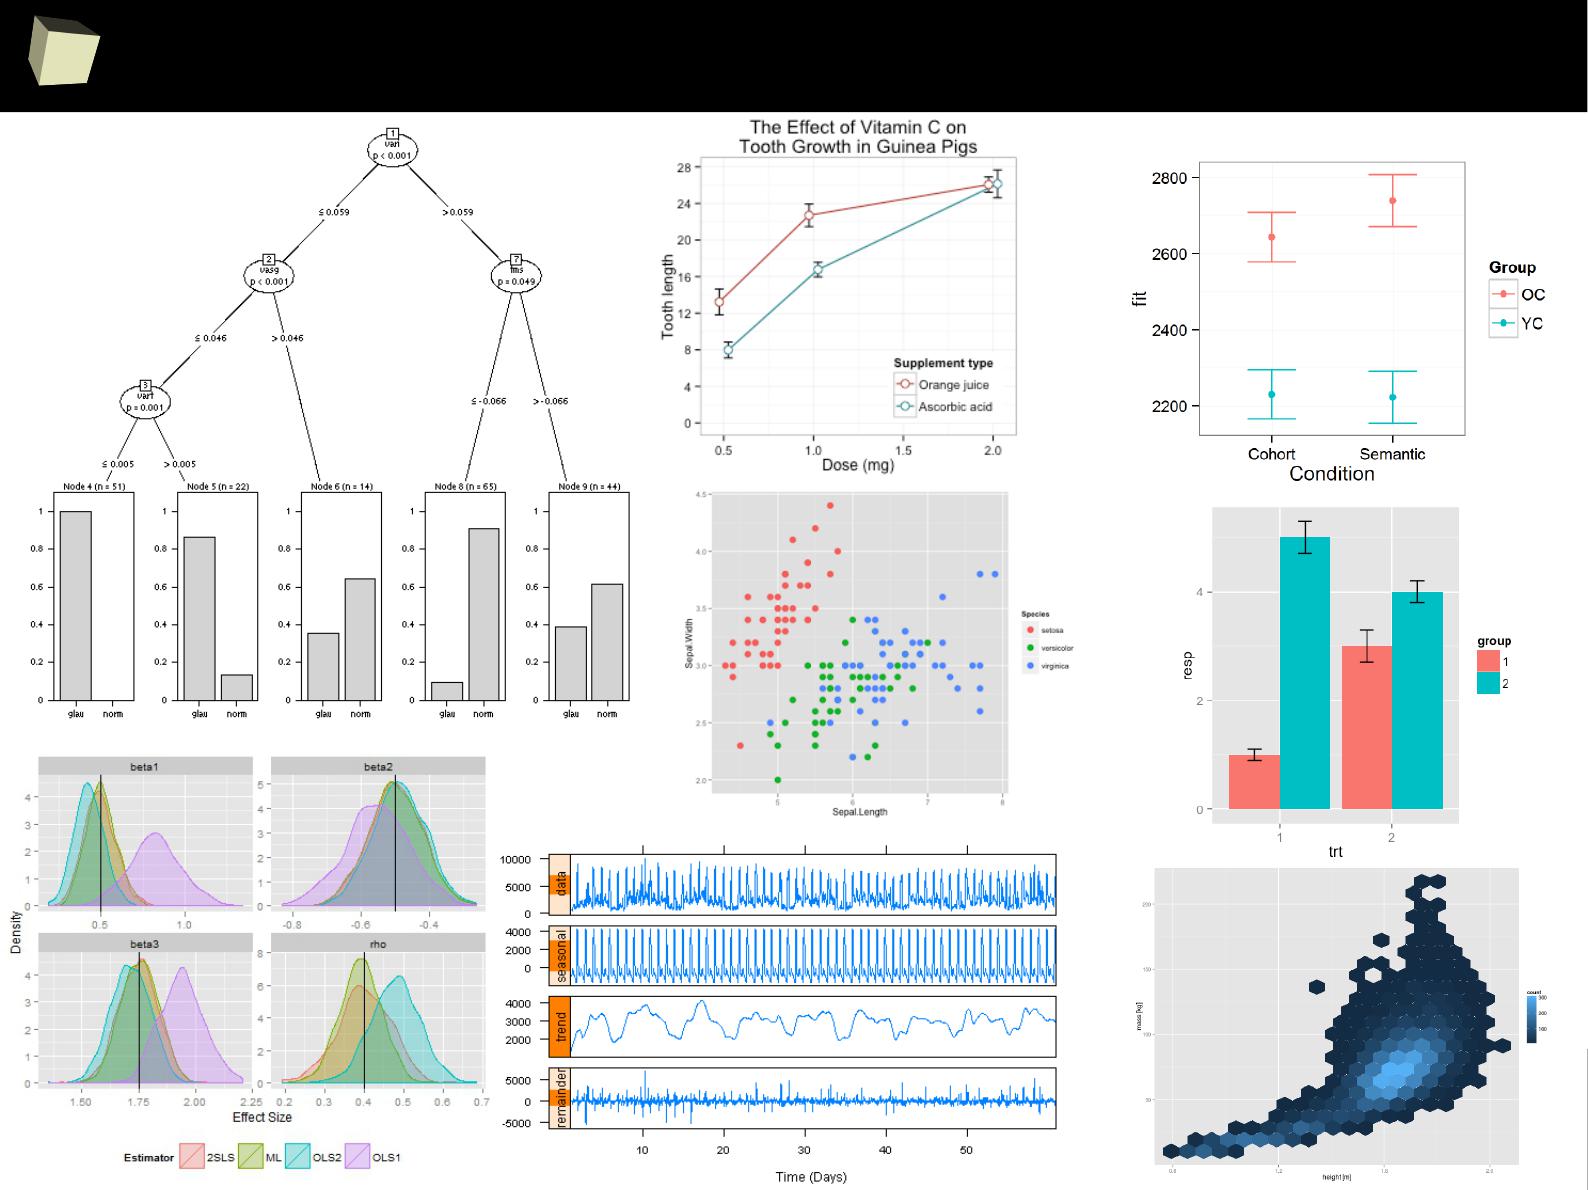
2
5
1
...and varied...
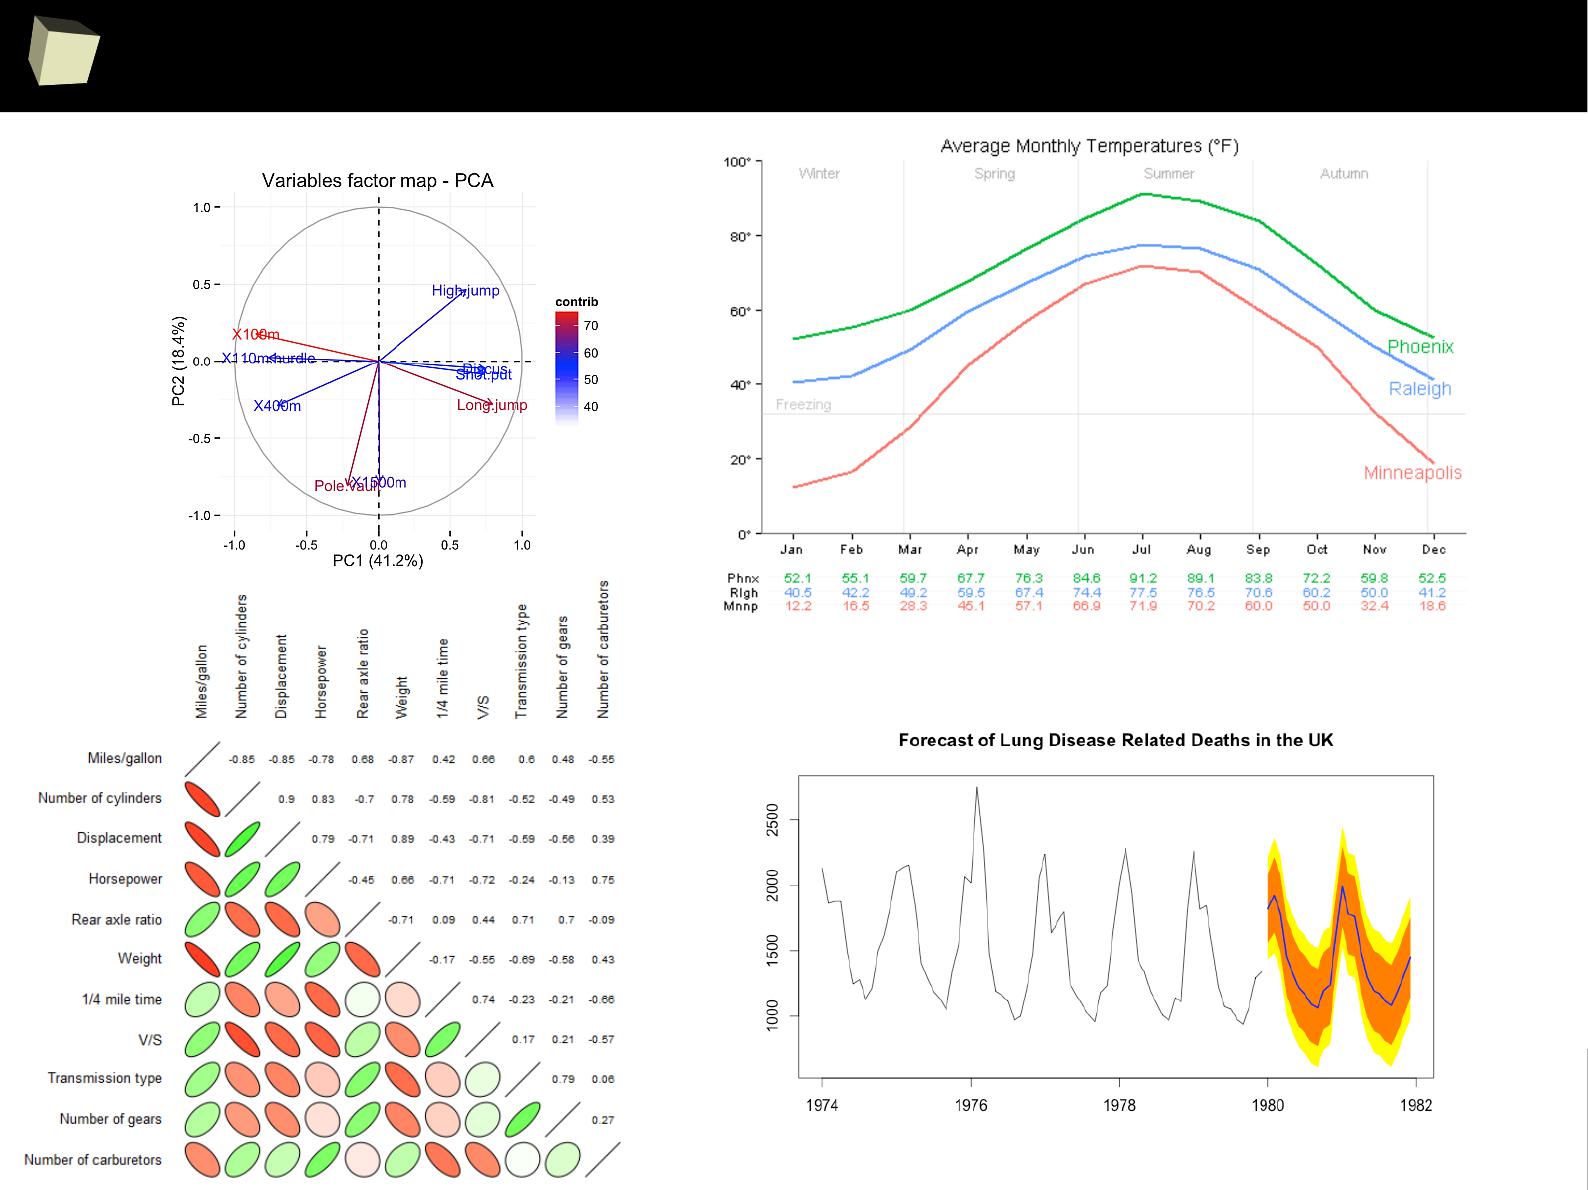
2
5
2
...and varied...
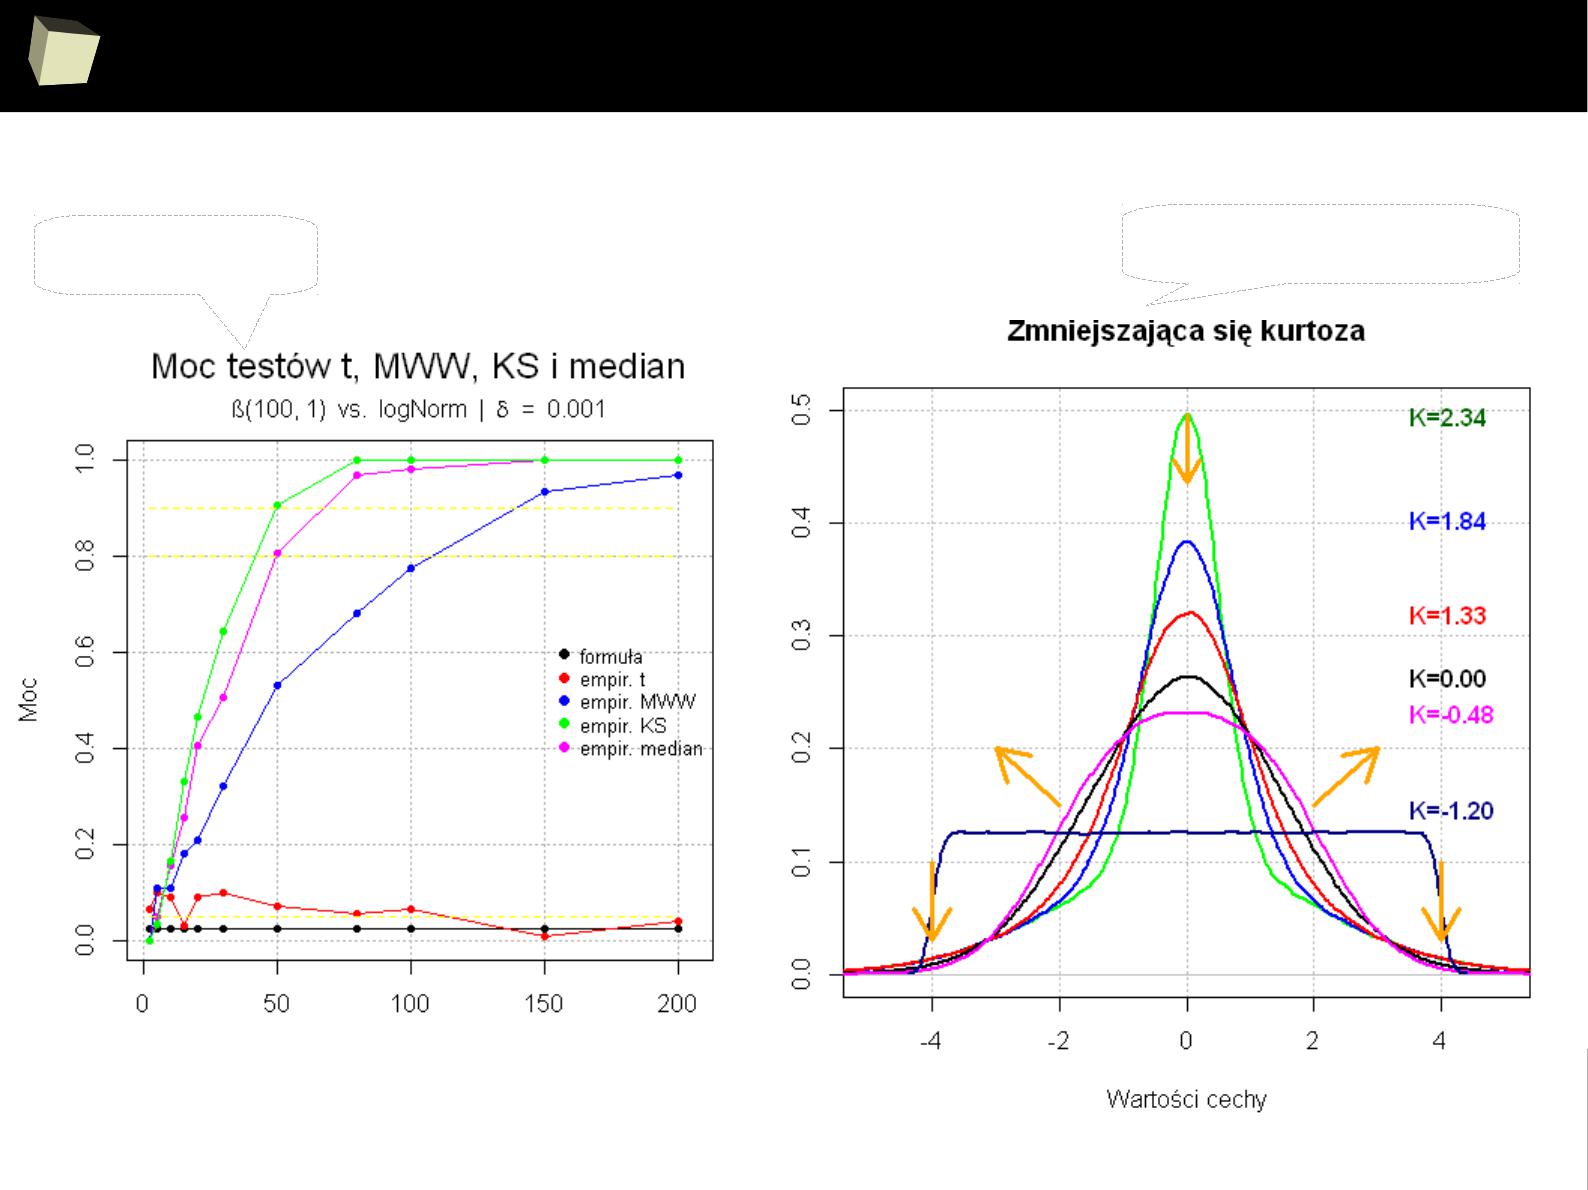
2
5
3
...animated...
Power of tests
Decreasing kurtosis
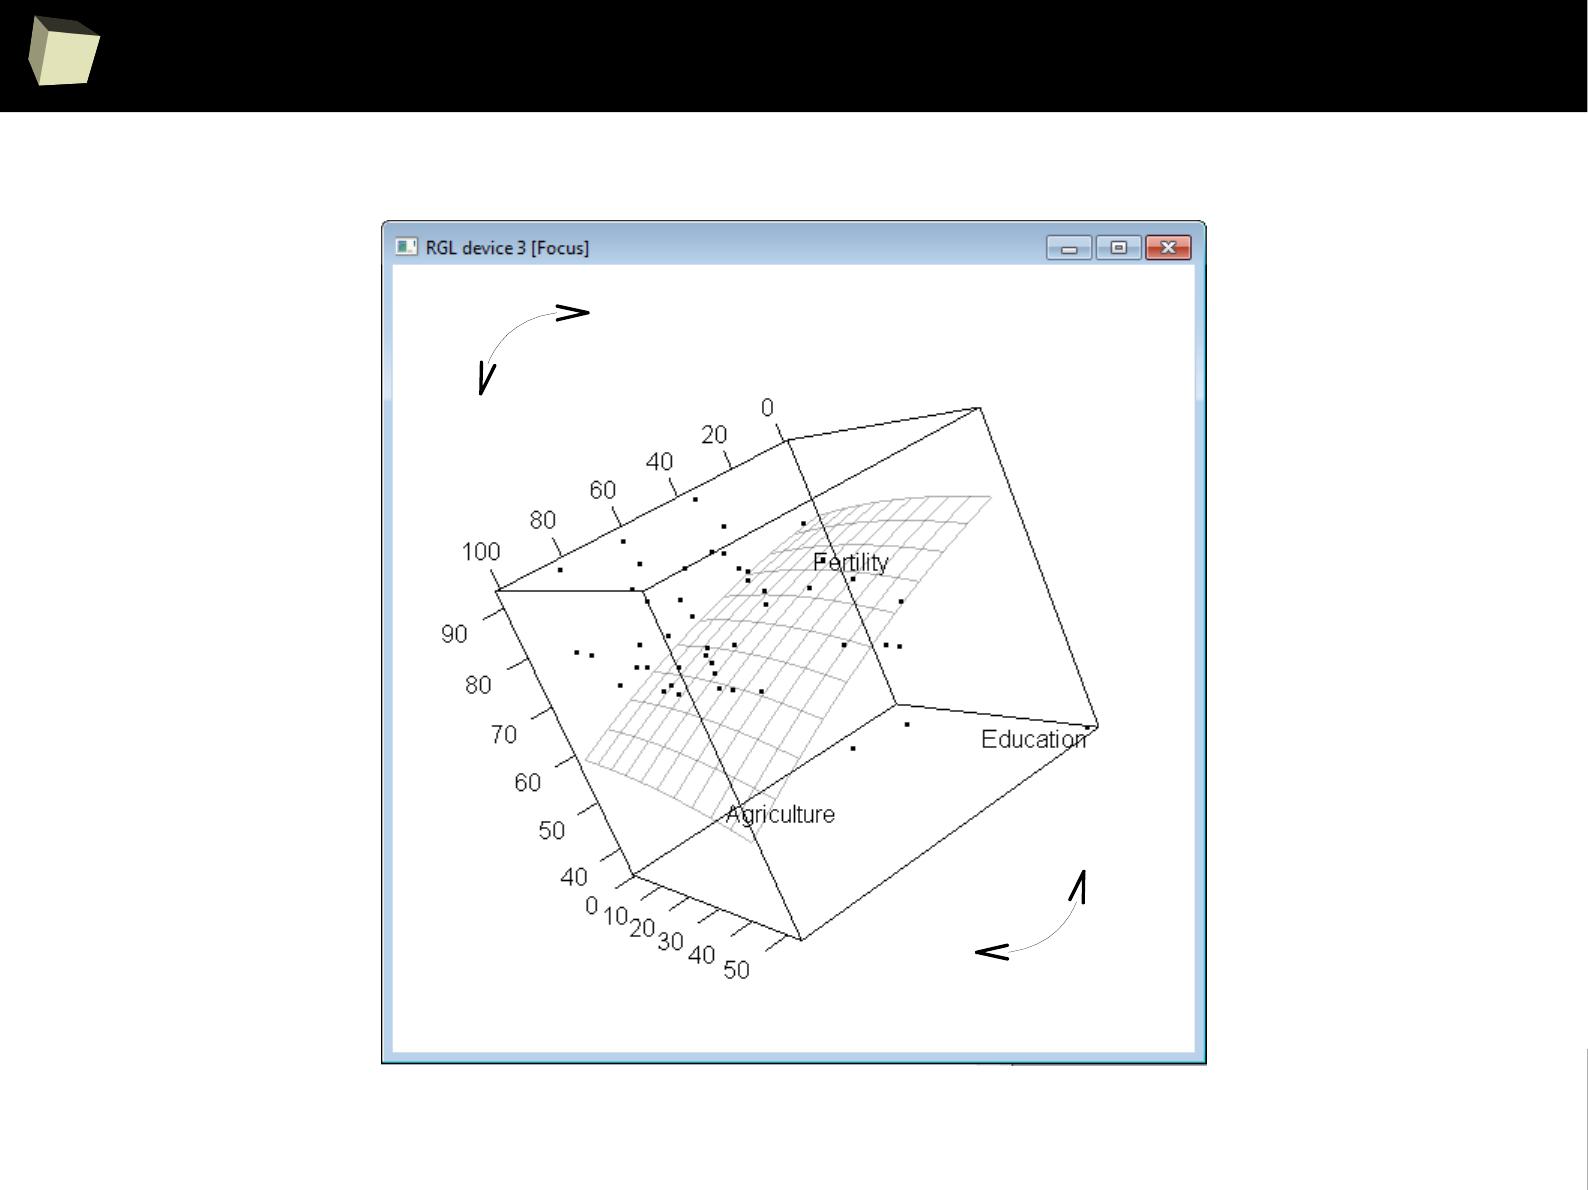
2
5
4
...and 3D, interactive and animated (rgl)
...rotating...
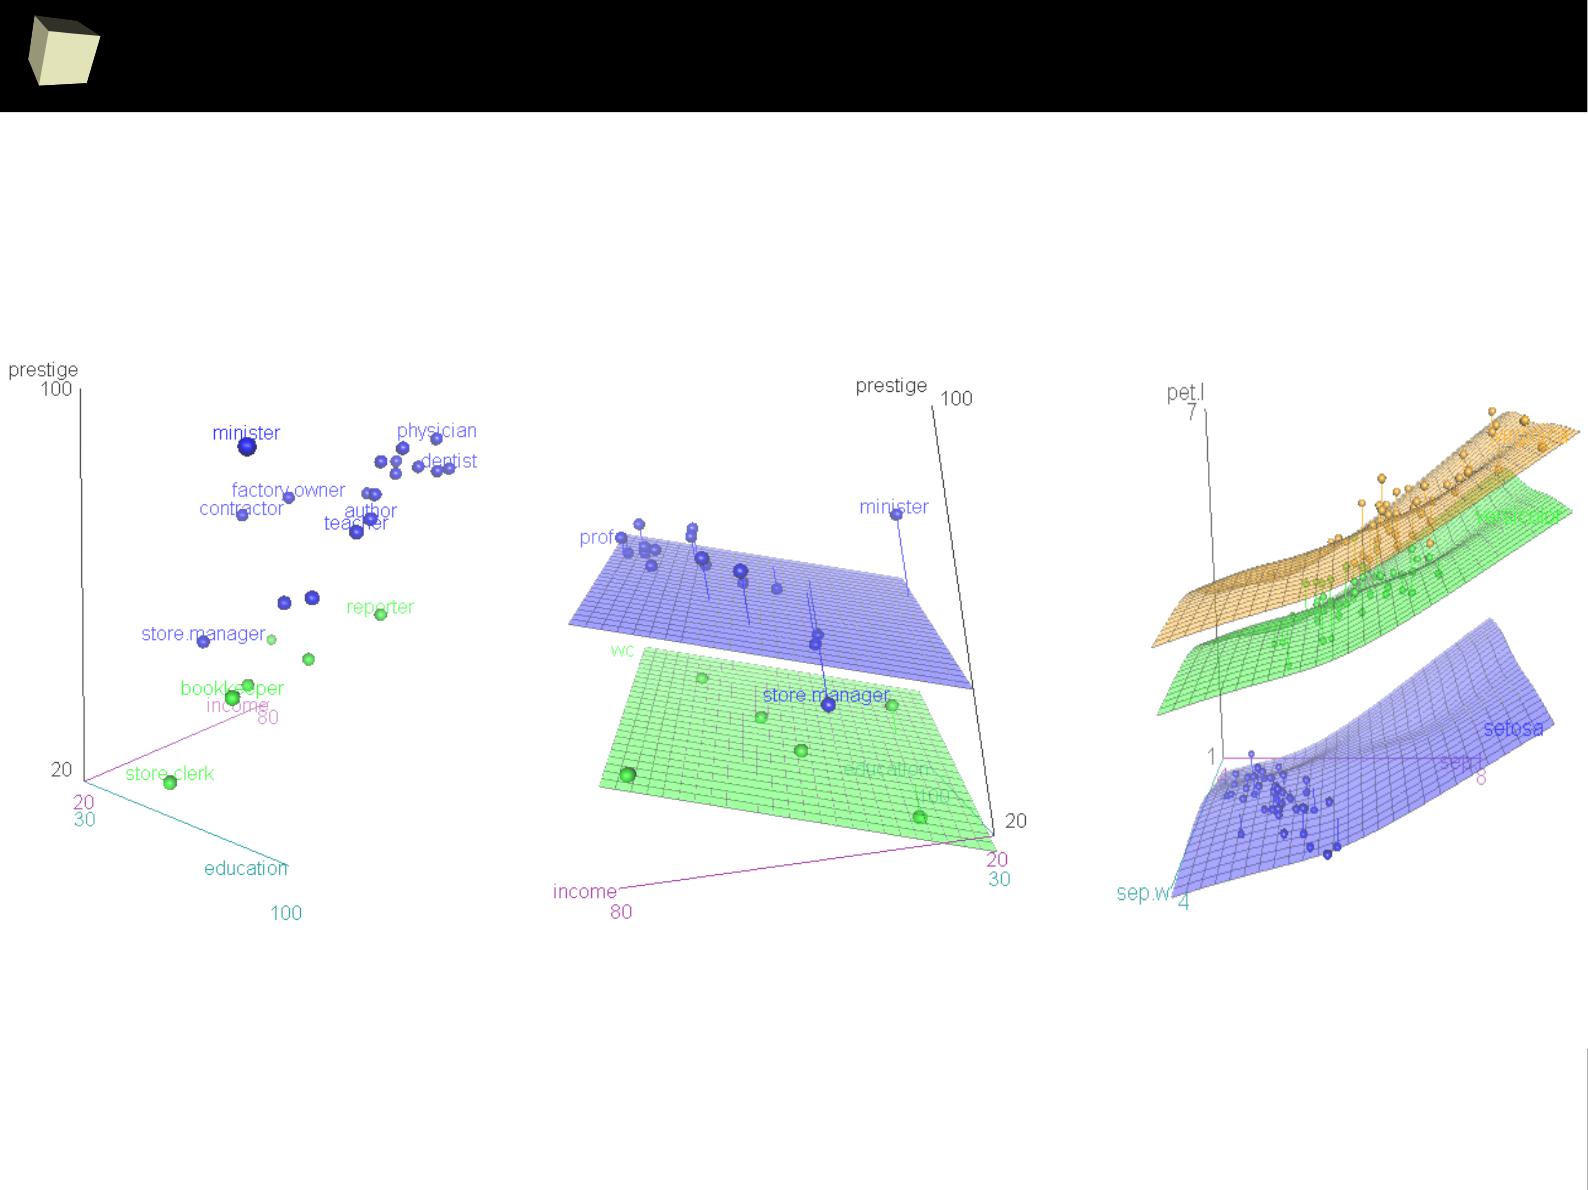
2
5
5
...and 3D, interactive and animated (rgl)
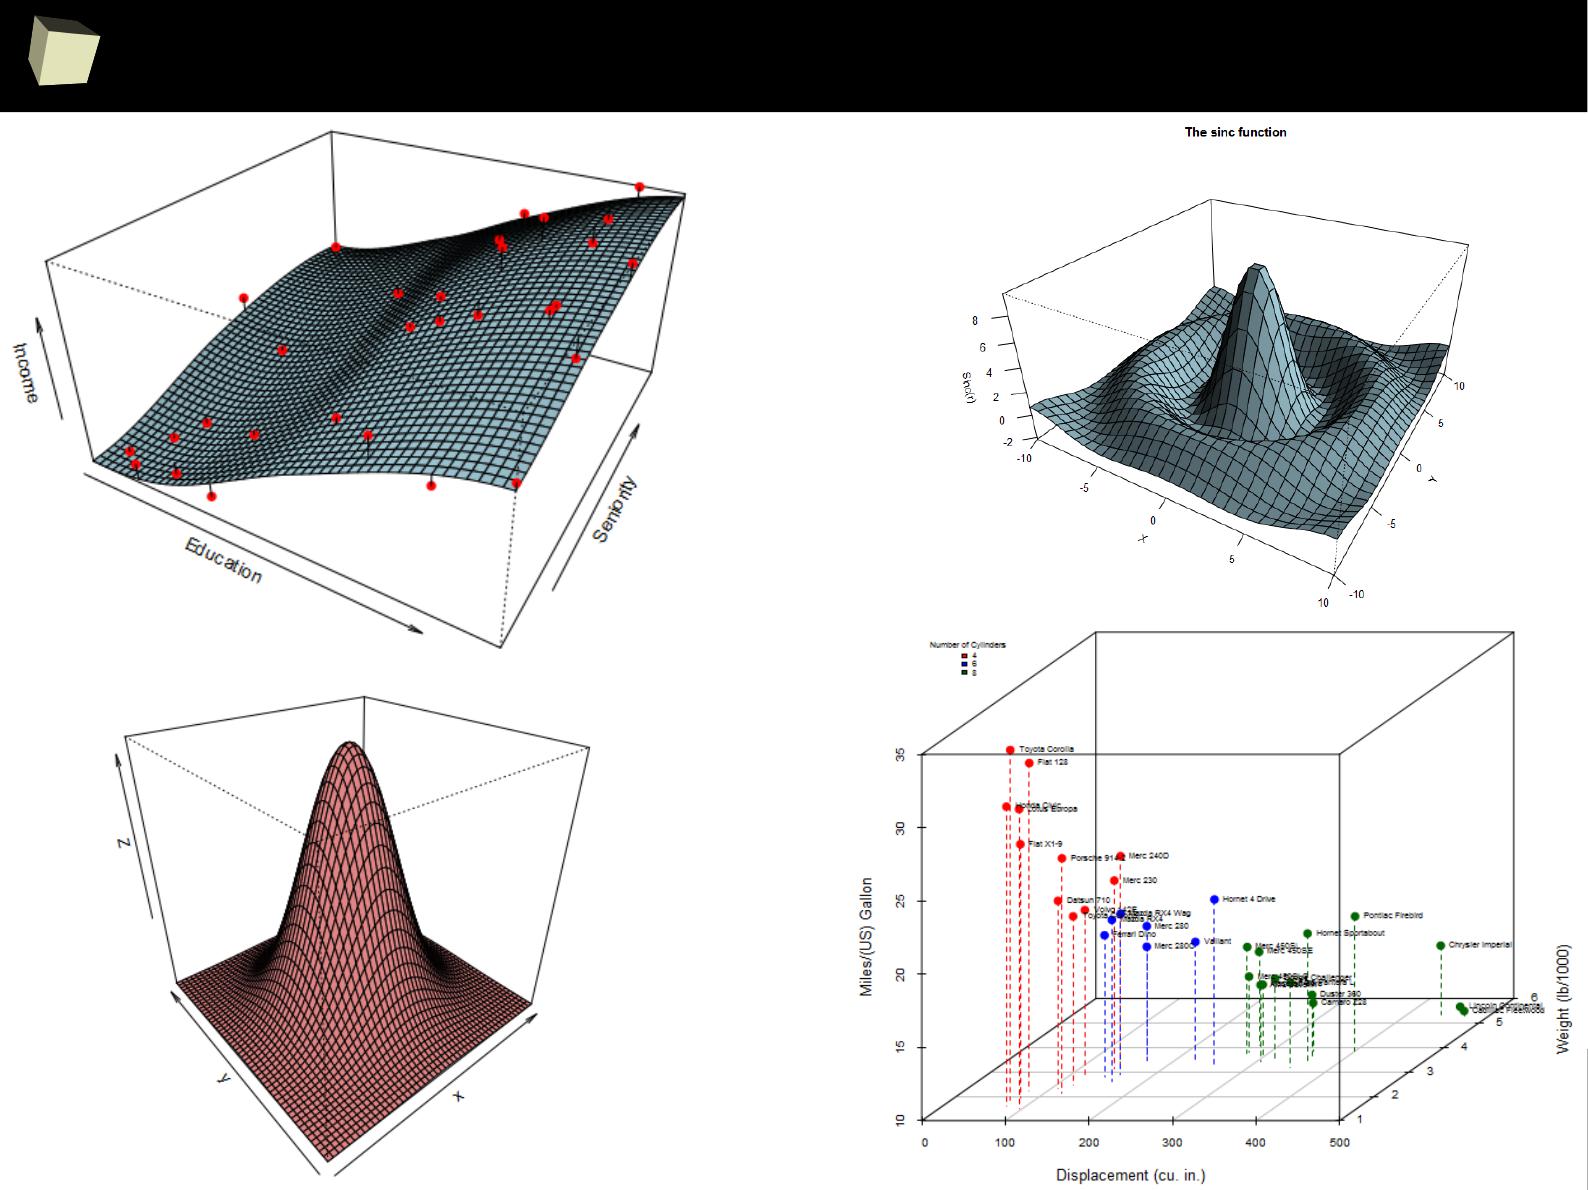
2
5
6
...and 3D interactive (scatterplot3d)
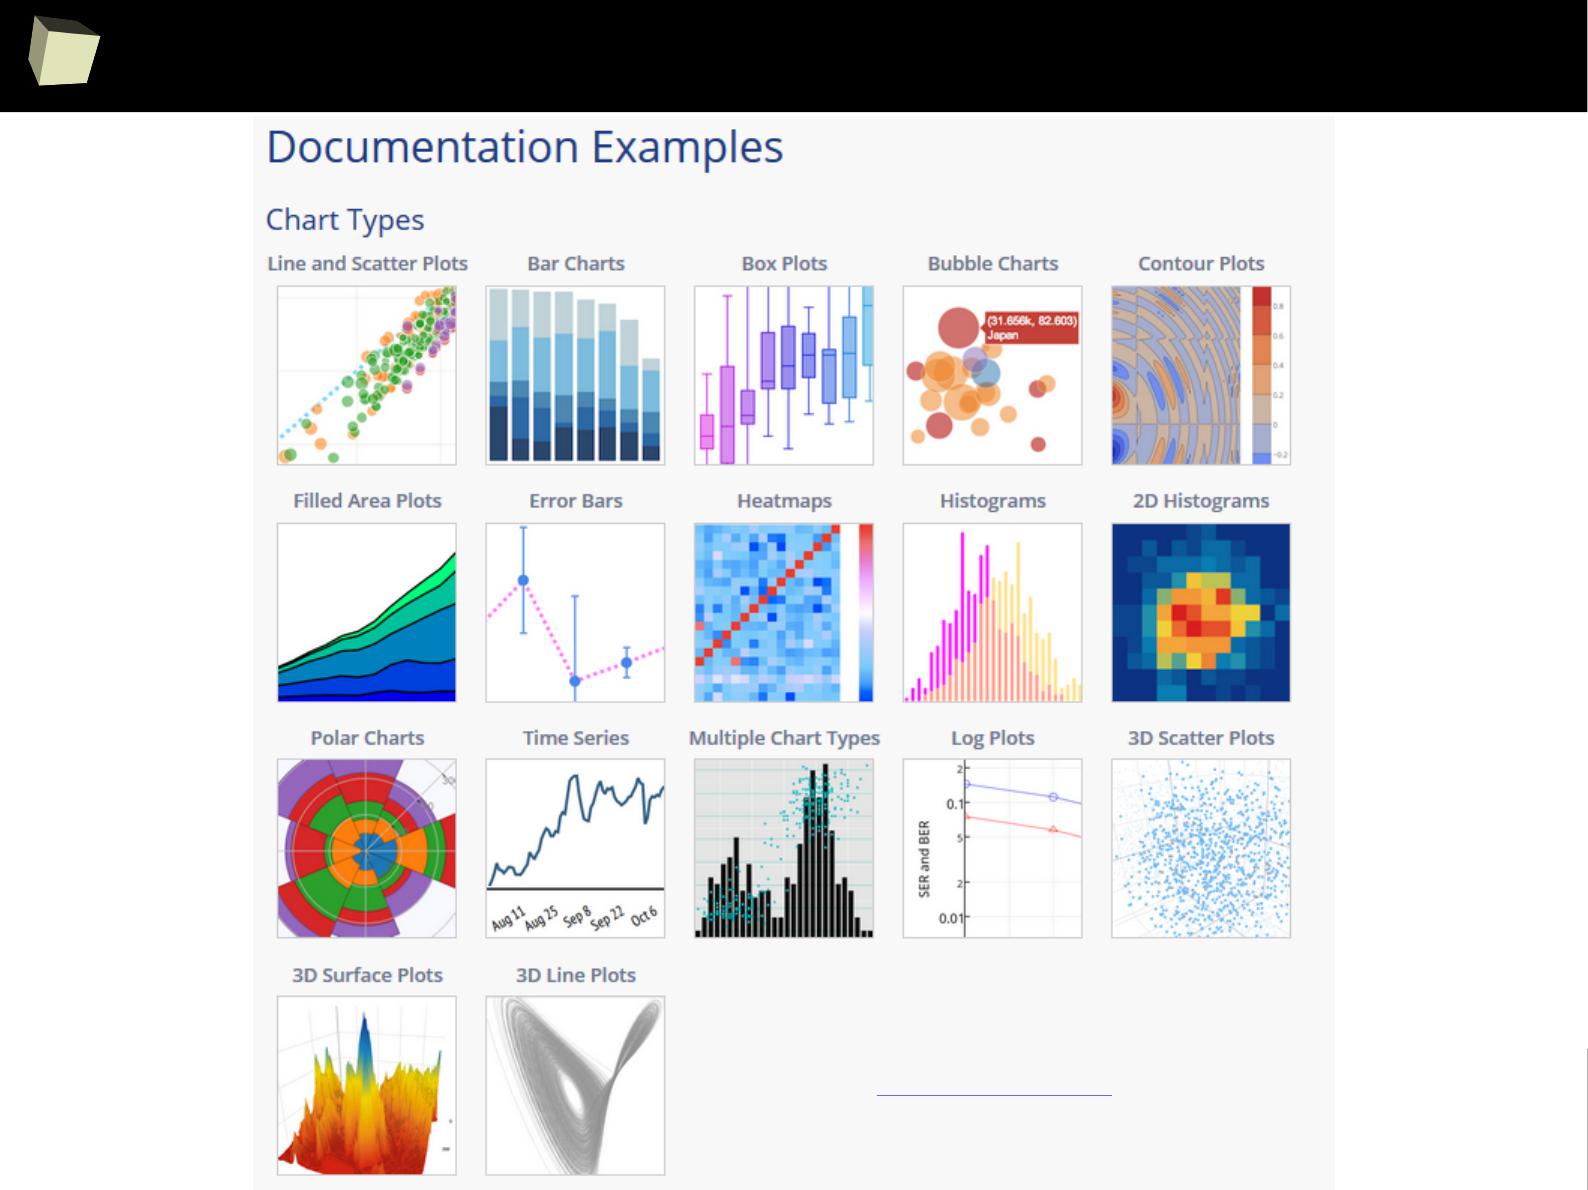
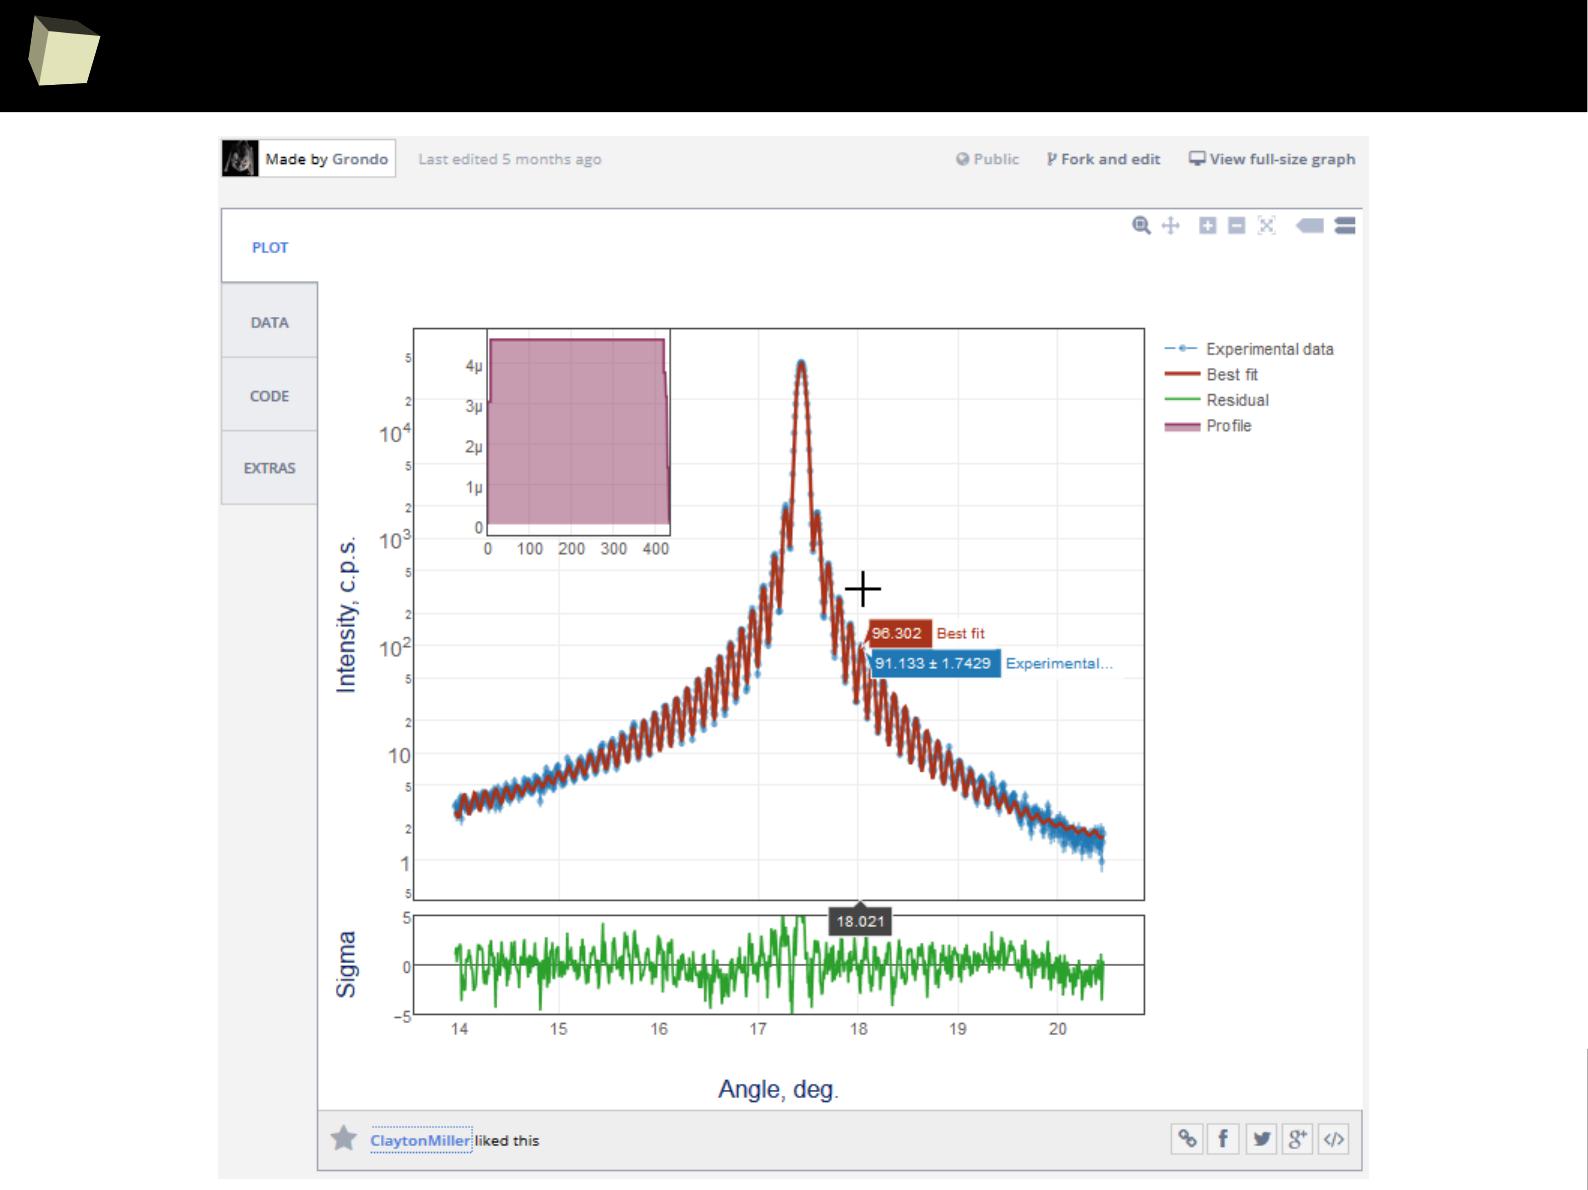
2
5
8
...and interactive (JScript)
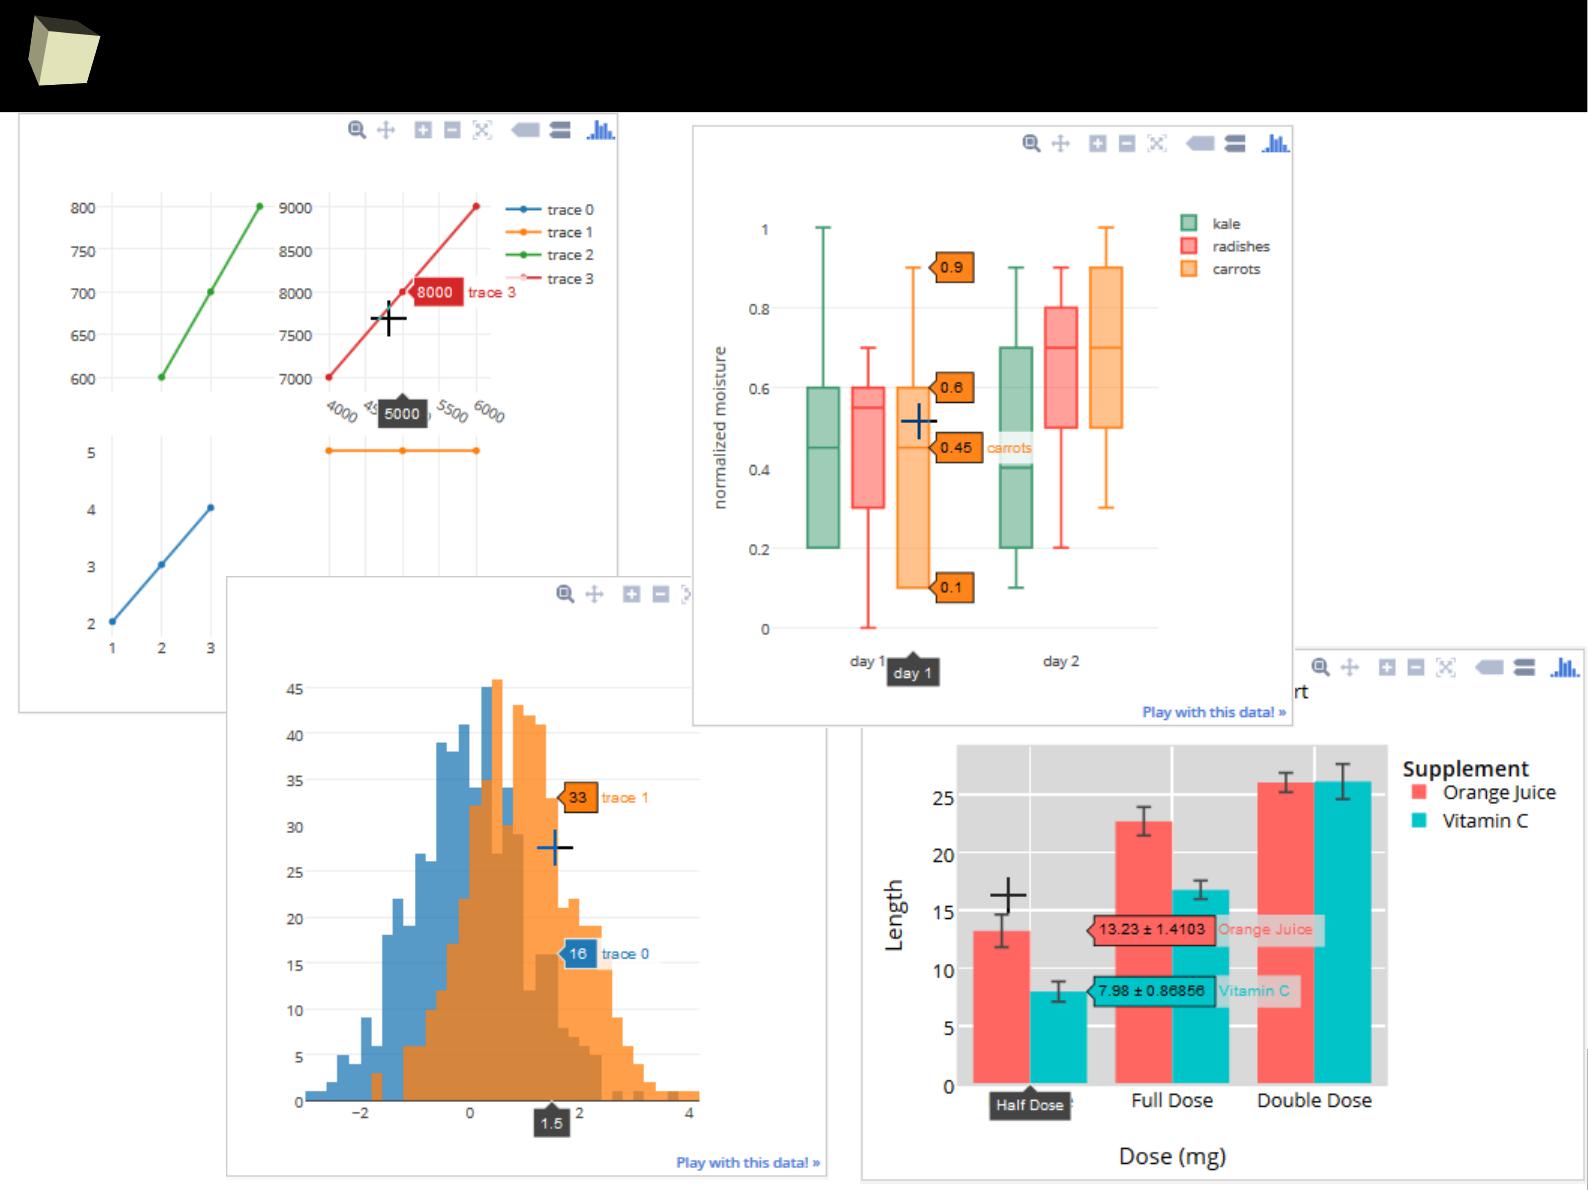
2
5
9
...and interactive (JScript)
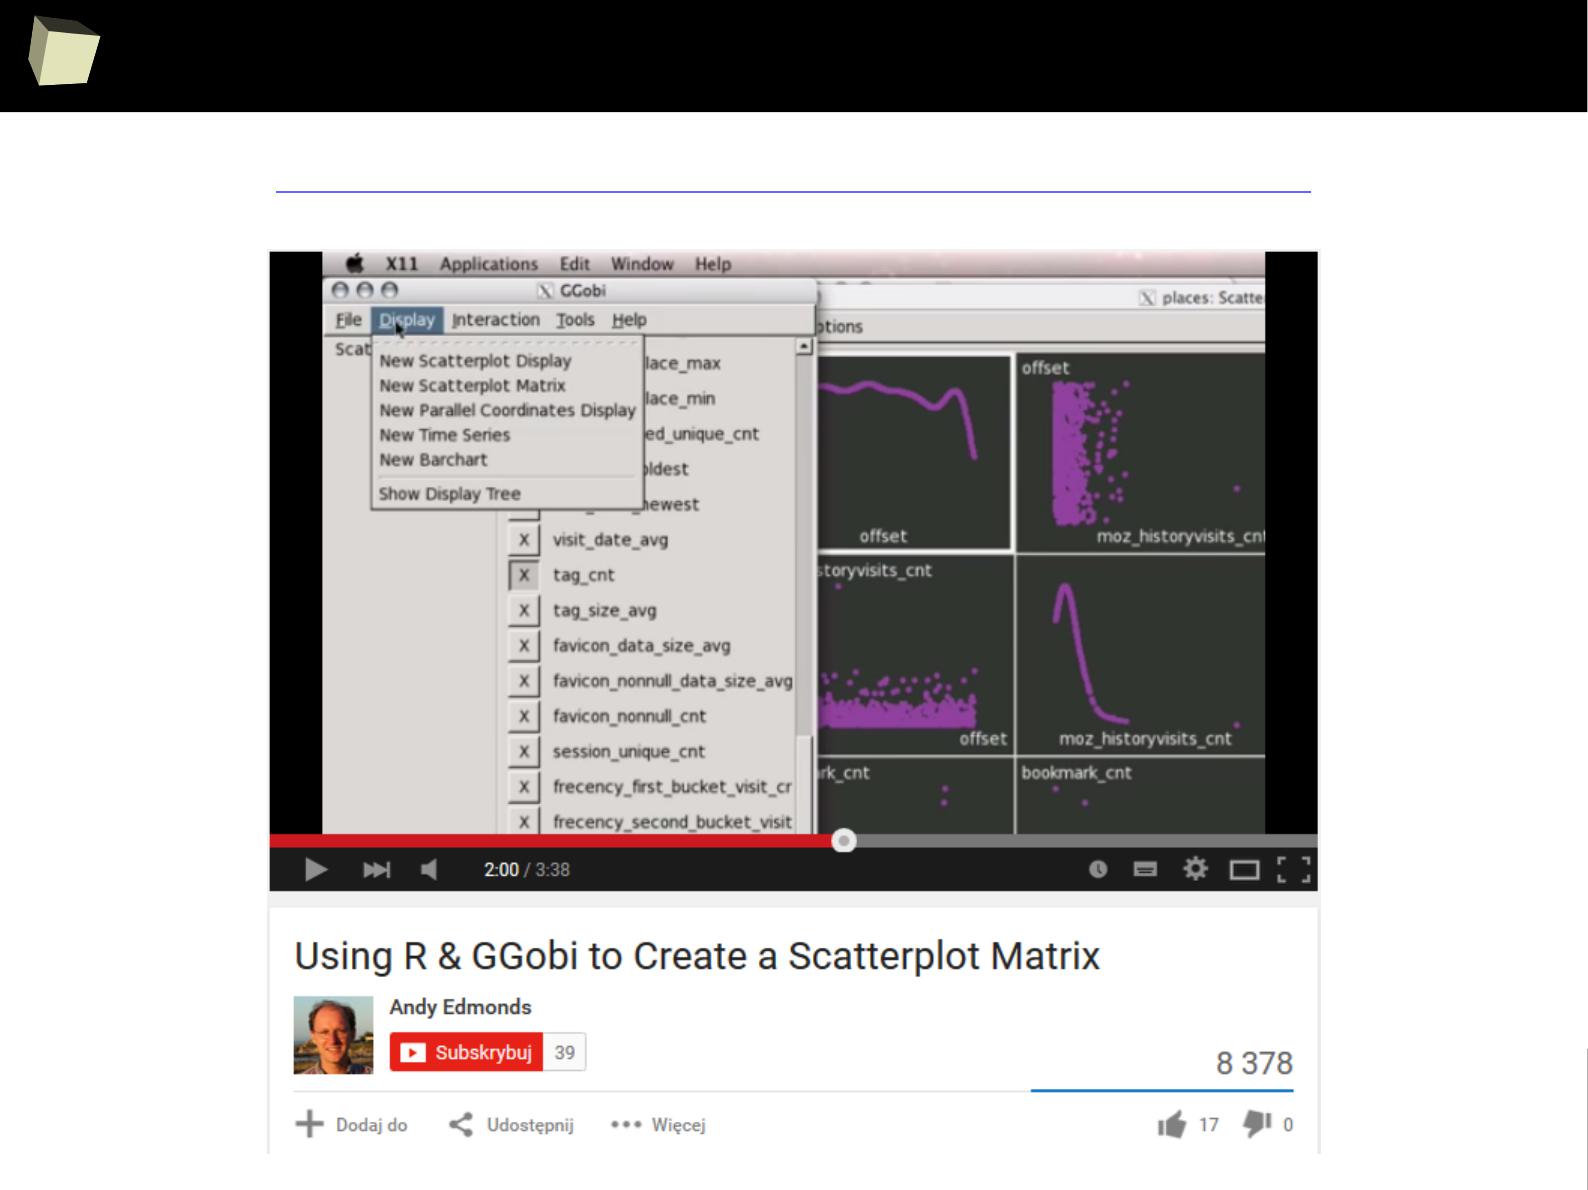
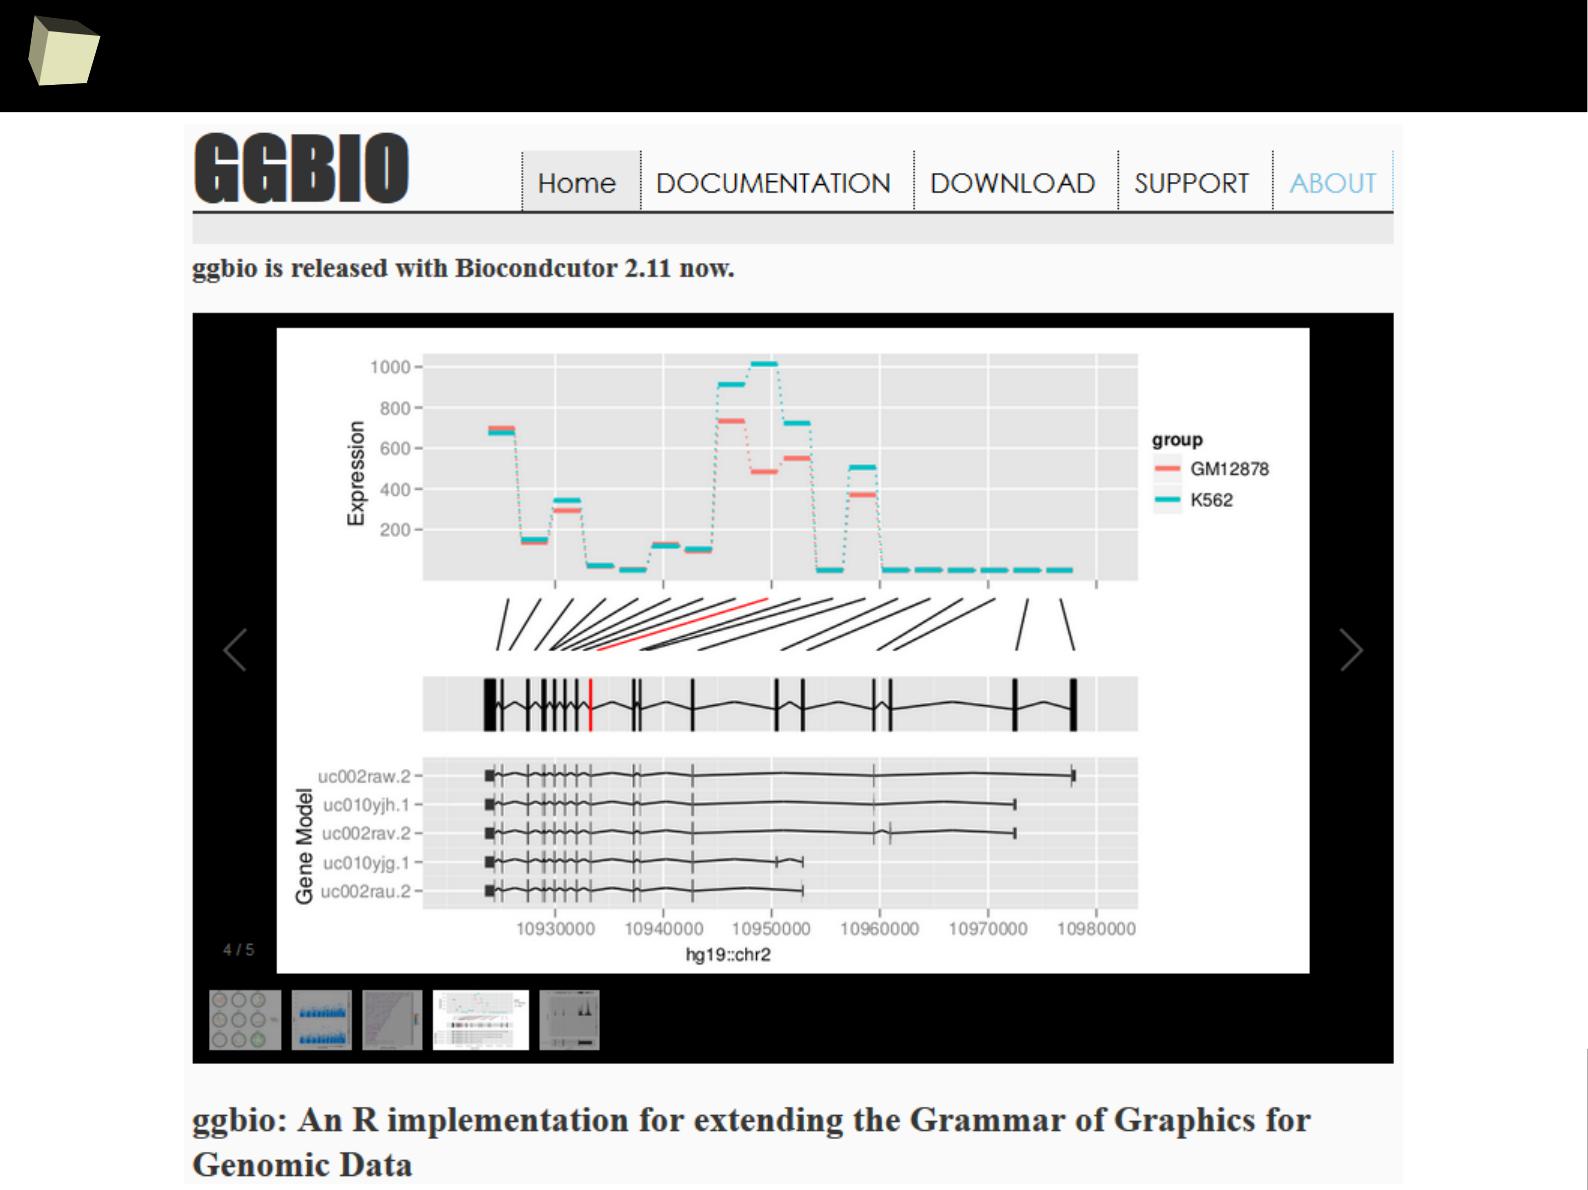
2
6
1
GGBio for geneticists
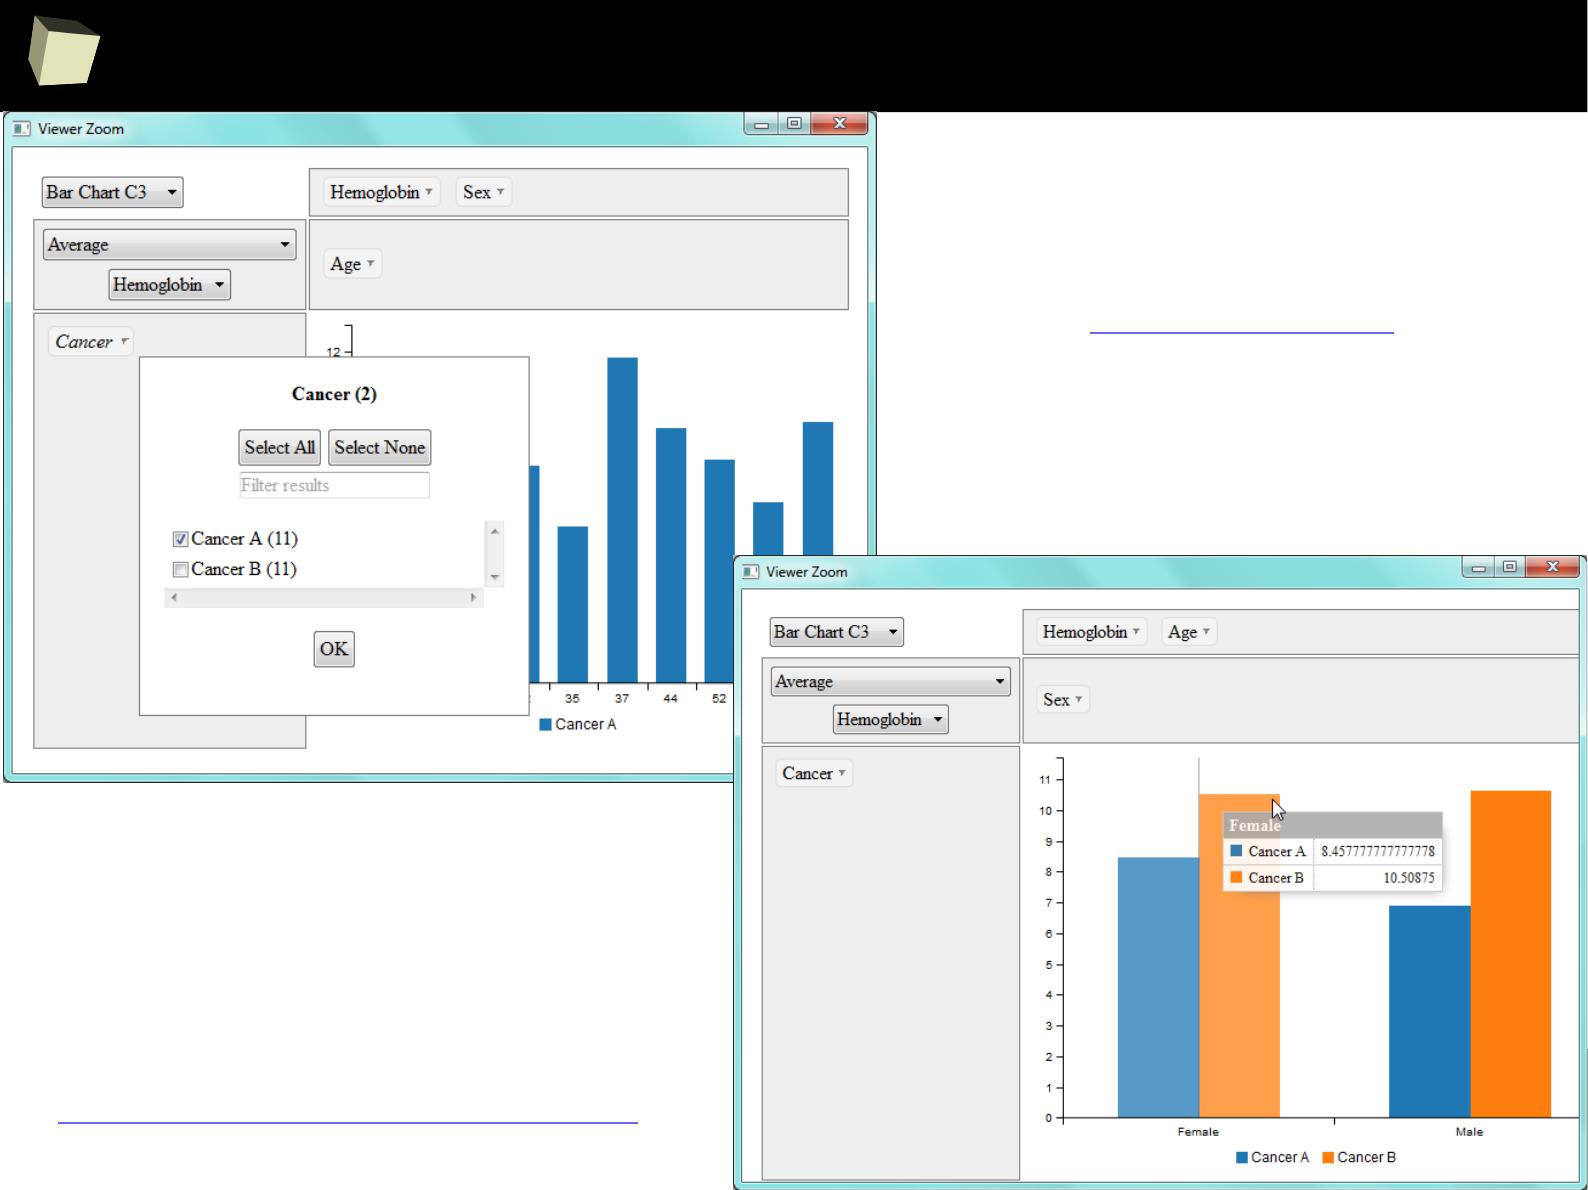
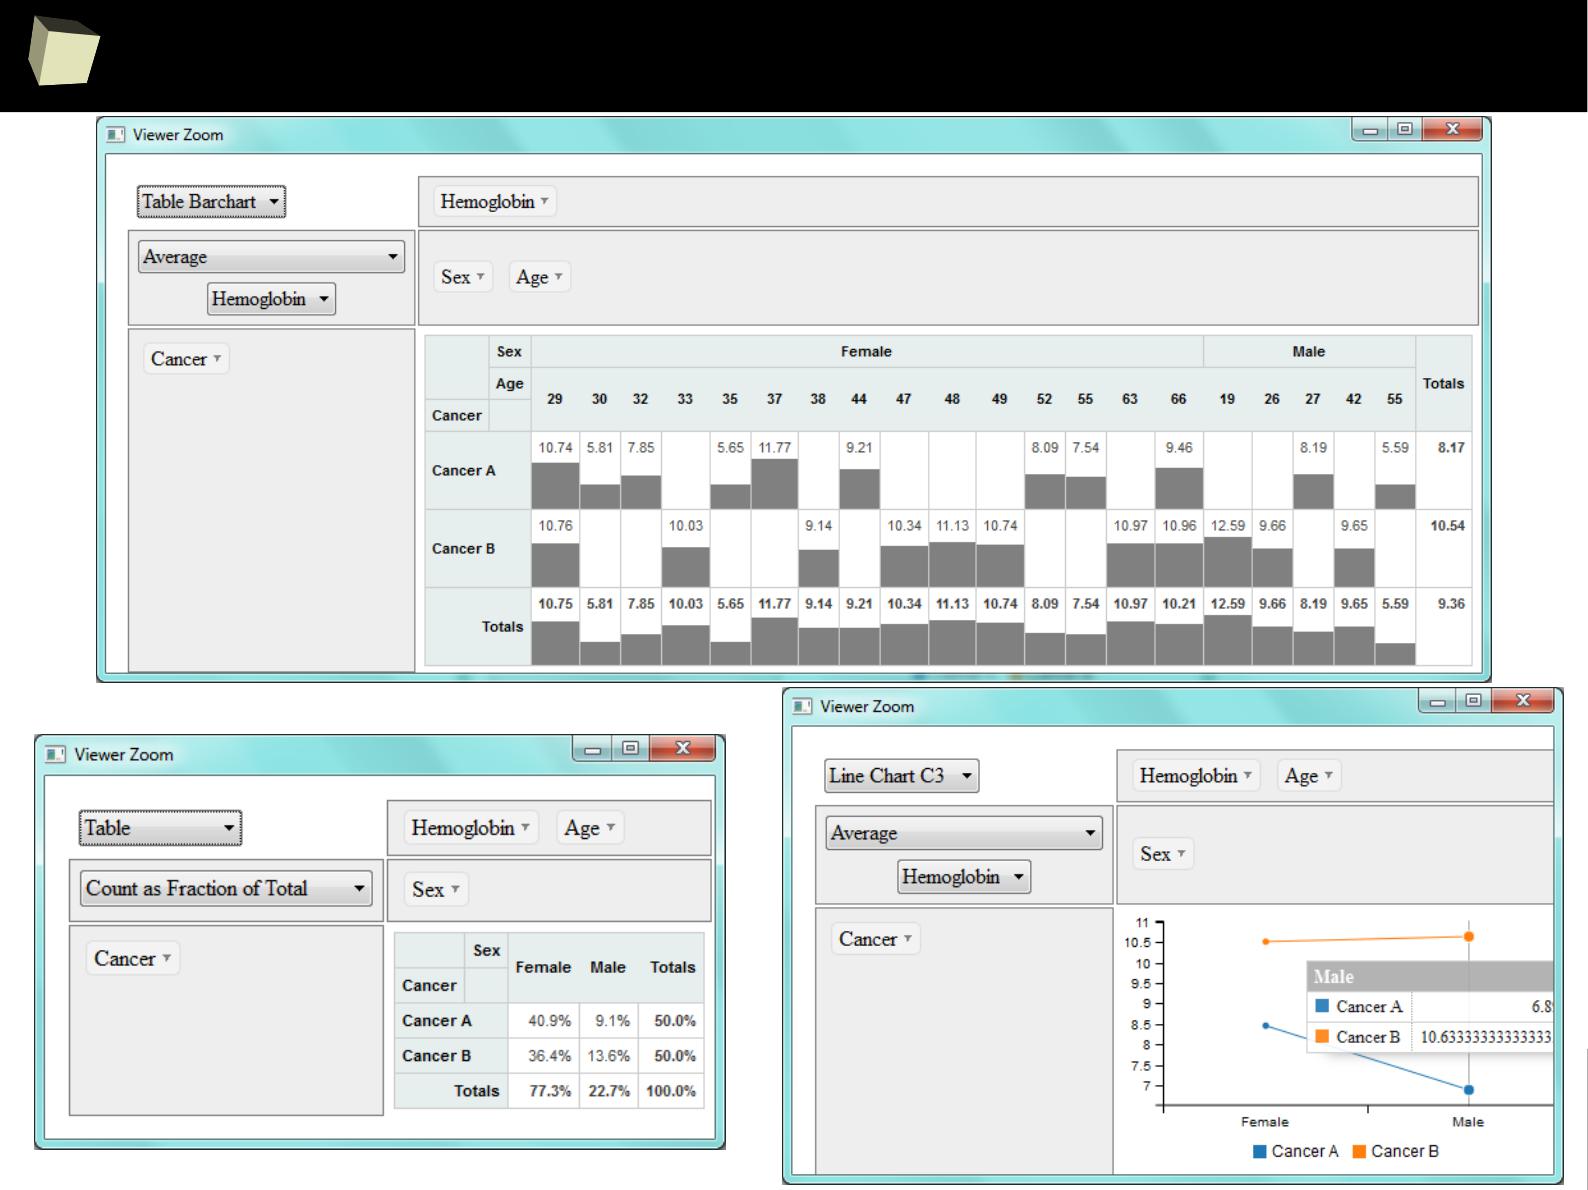
2
6
3
rpivotTable
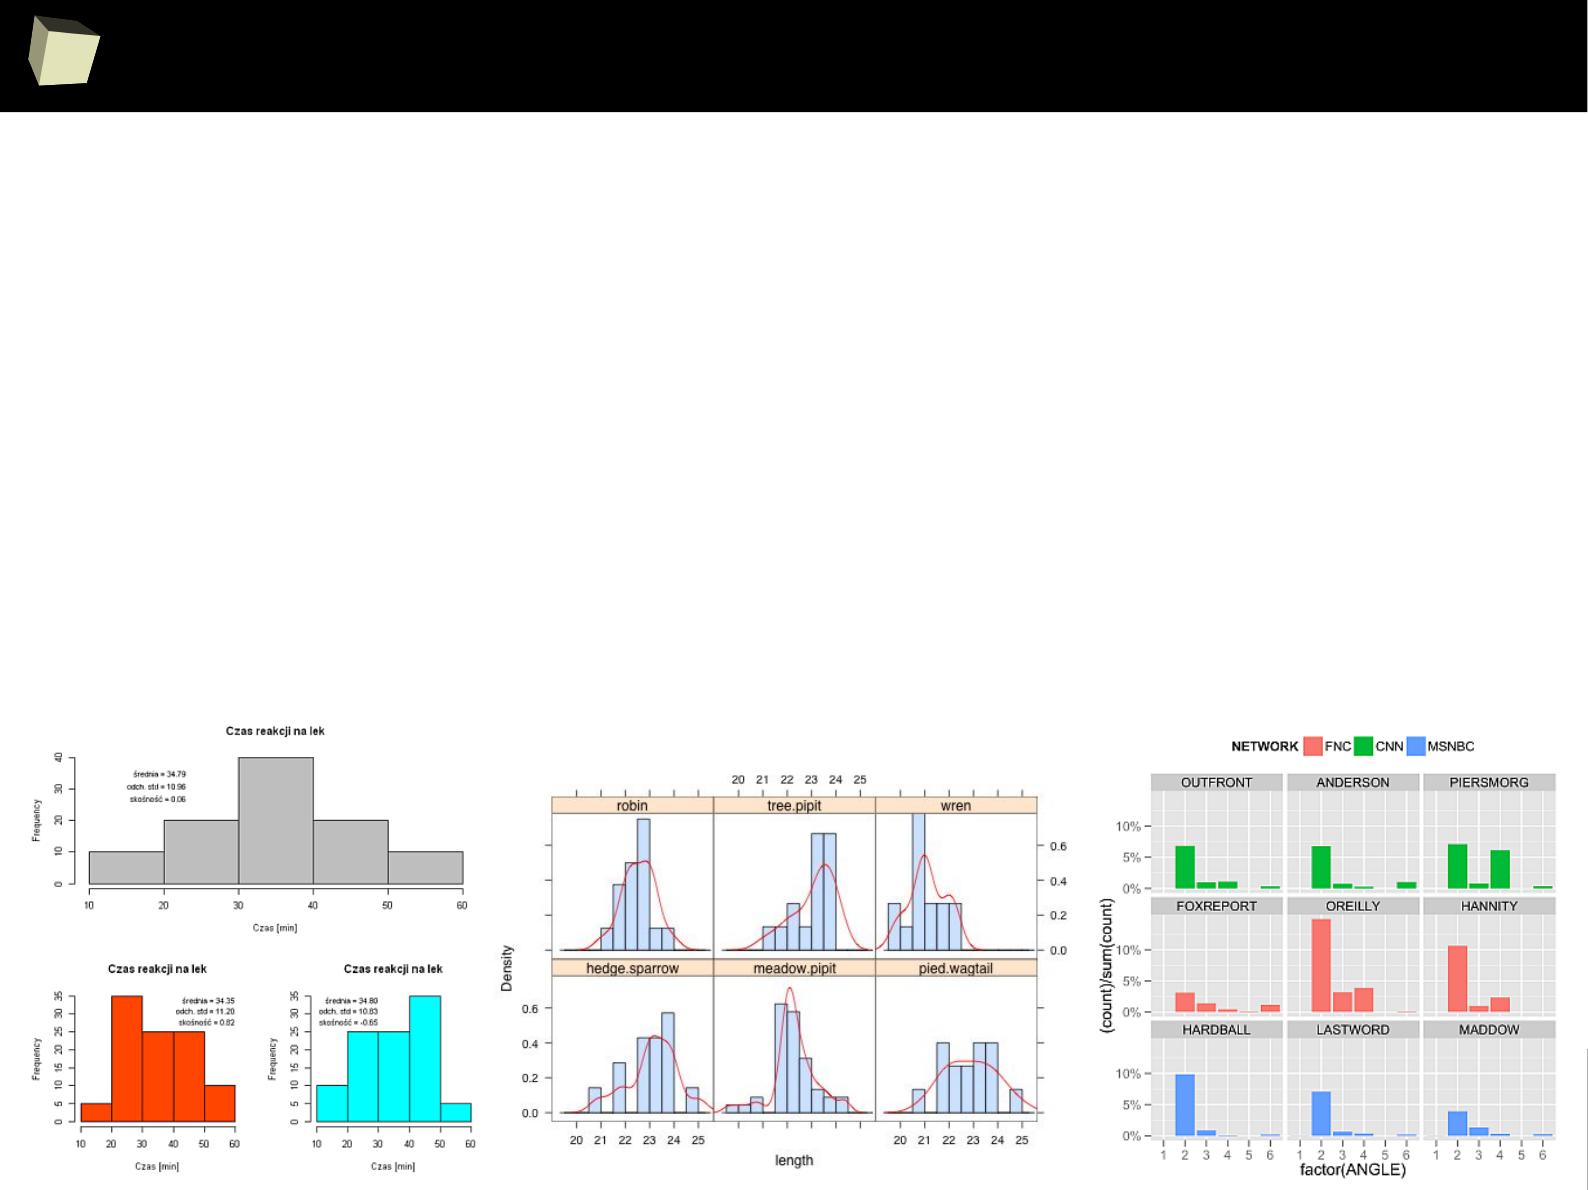
2
6
4
Charting subsystems
Base, default library
by Ross Ihaka
University of Auckland
●
low-level – graph. primitives
●
easy to learn*
●
most powerful – no limits
●
well readable, ascetic
●
may involve a lot of coding to
get fancy results
●
supports multiple plots
●
interactive locator of points
●
no anti-aliasing but it can draw
on Cairo devices
ggplot2
by Hadley Wickham
Rice University
●
high-level and well organized
●
implementation of Grammar of
Graphics
●
powerful, higly customizable
●
well readable, polished output
●
anti-aliased by design
●
closed set of diagrams but
easily expandable
●
supports multiple plots (grid)
●
incompatible with others
Trellis
by Deepayan Sarka
University of Wisconsin
●
designed for viewing multivariable
datasets (grid of conditioned plots)
●
well readable
●
closed set of available diagrams:
Barplot, Dotplot, Box and
Whiskers, Histogram, Density, QQ,
Scatterplot
●
incompatible with other systems
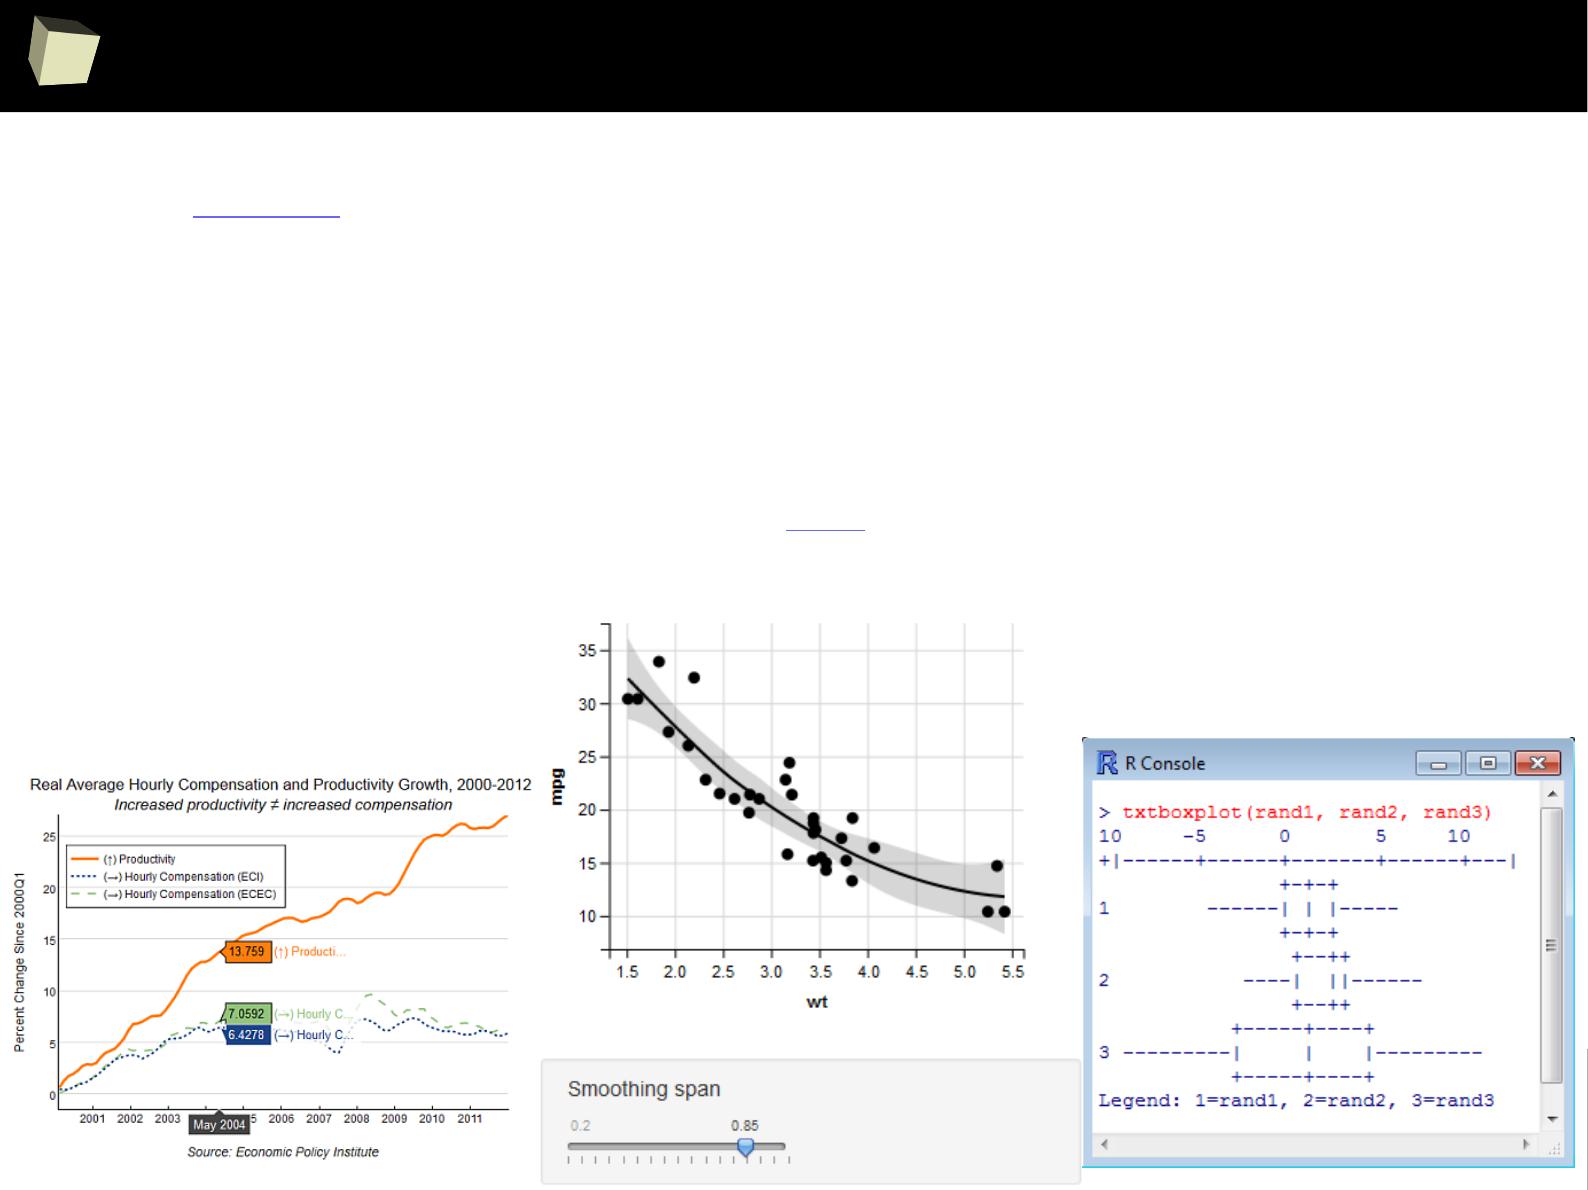
2
6
5
Charting subsystems
plotly
Teamwork
●
based on ggplot2
●
interactive (JScript)
●
WWW enabled (HTML/JSON/JS)
●
breathtaking output –must see!
●
well readable, clean
●
rich library of examples
●
incompatible with other
systems
txtplot
by Bjoern Bornkamp
●
produces graphs in pure ASCII
●
rudimentary output
●
closed set of plots (boxplot,
lineplot, barplot, density, ACF)
●
really useful when resources
are limited (mobile devices,
simple LCD displays, etc.) or
output must be textual
●
incompatible with others
ggvis
by RStudio team
●
another implementation of
Grammar of graphics, similar in
spirit to ggplot2
●
interactive (JScript)
●
WWW enabled (HTML, JS)
●
well readable
●
designed for Shiny
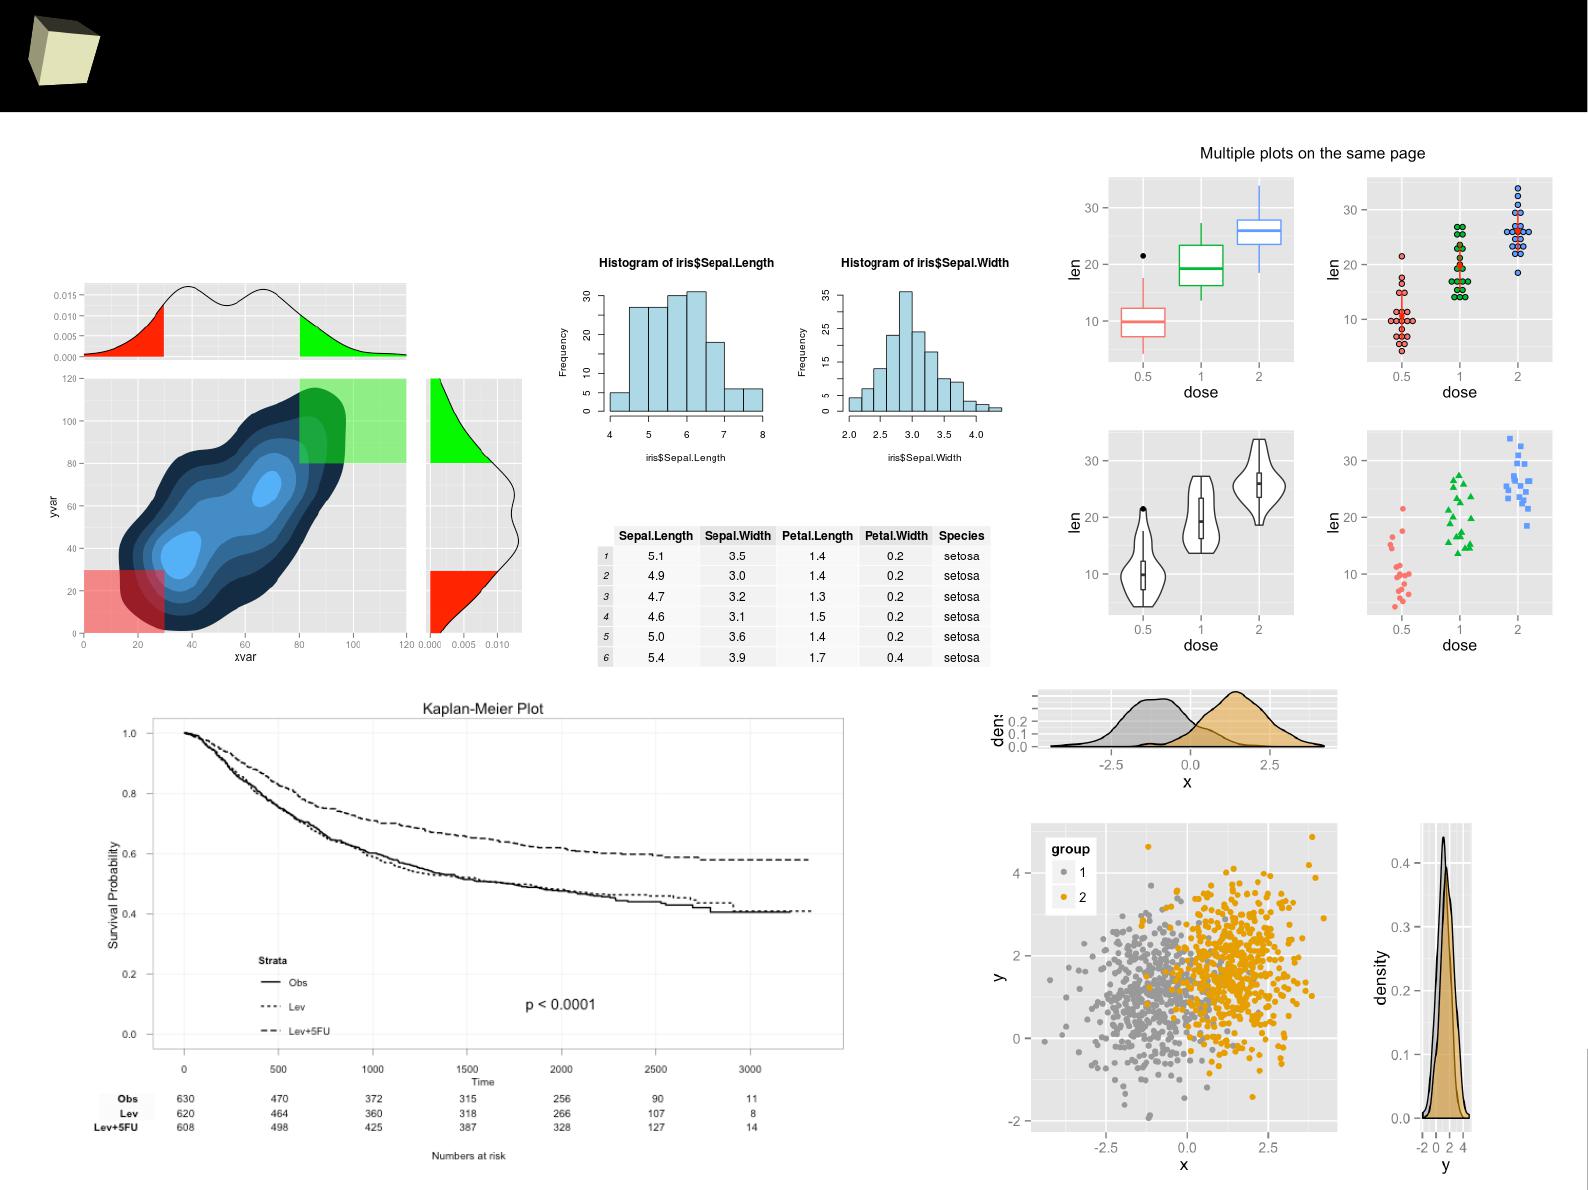
2
6
6
Additional helpers for ggplot2: gridExtra
Helps to arrange multiple ggplot2 objects on the
same page
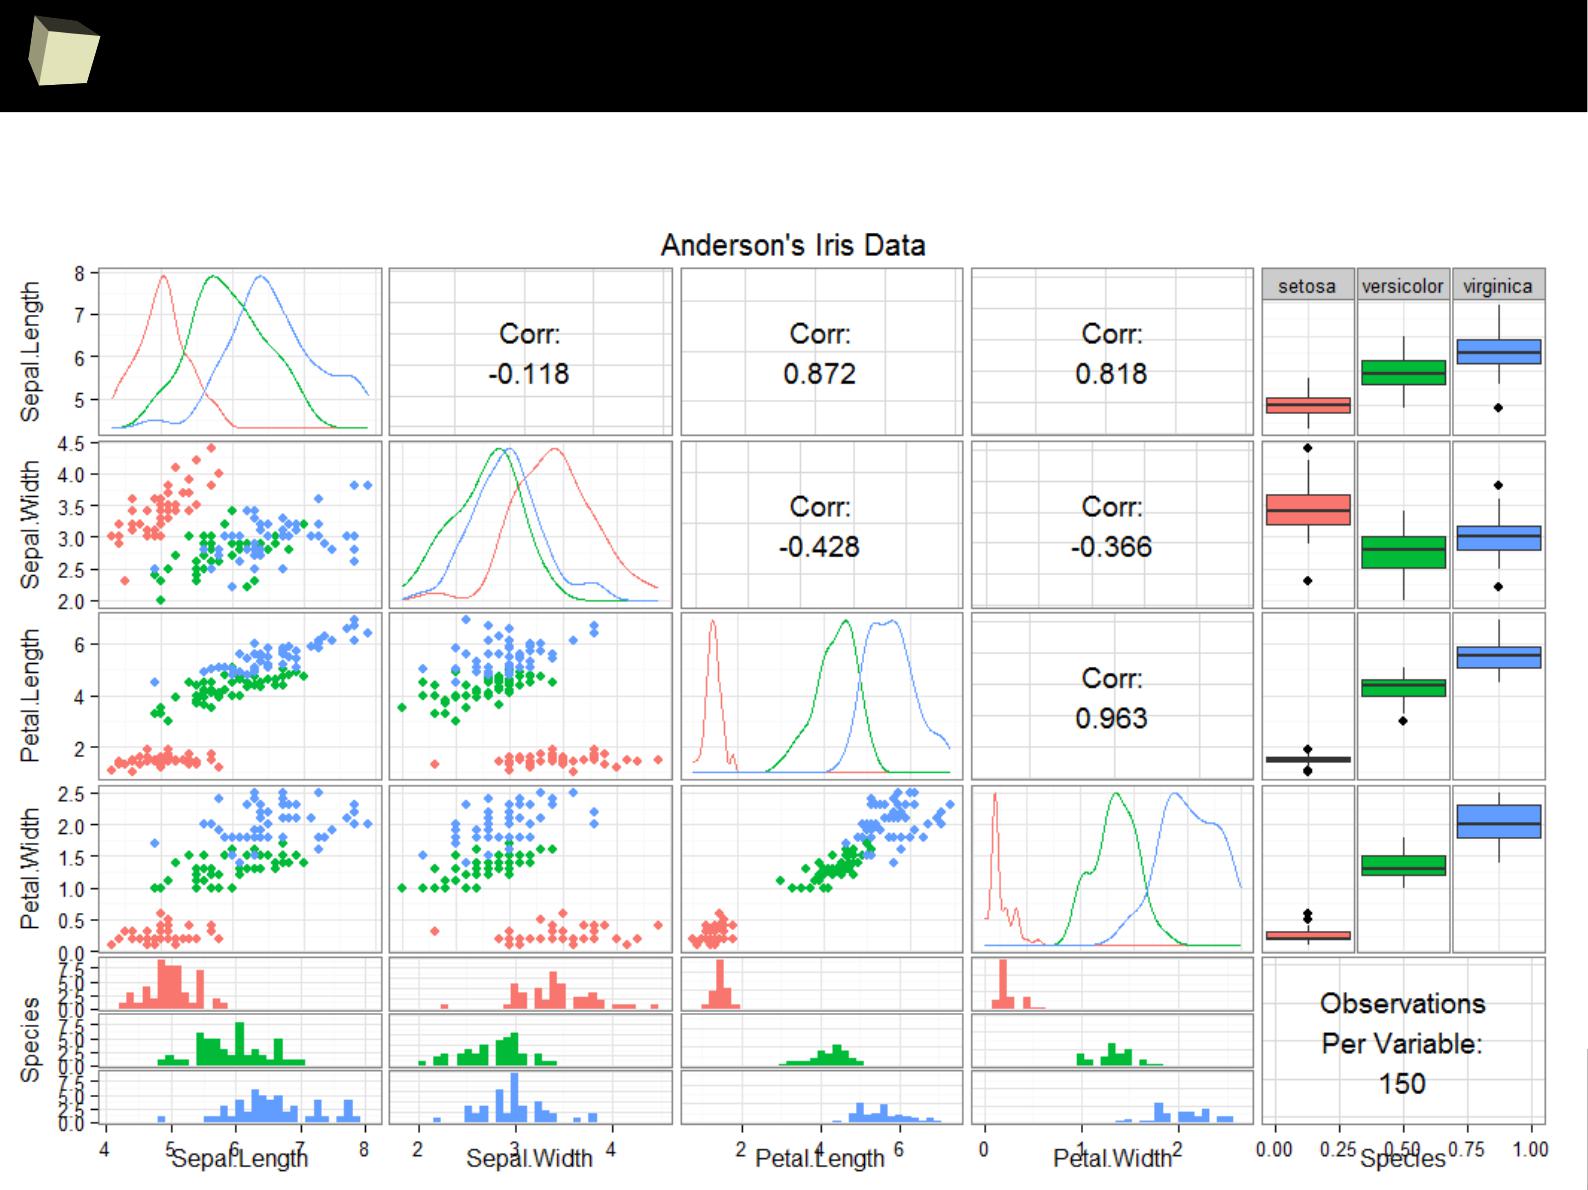
2
6
7
Additional helpers for ggplot2: GGally
Creates a matrix of ggplot2 graphs for data exploration purposes.
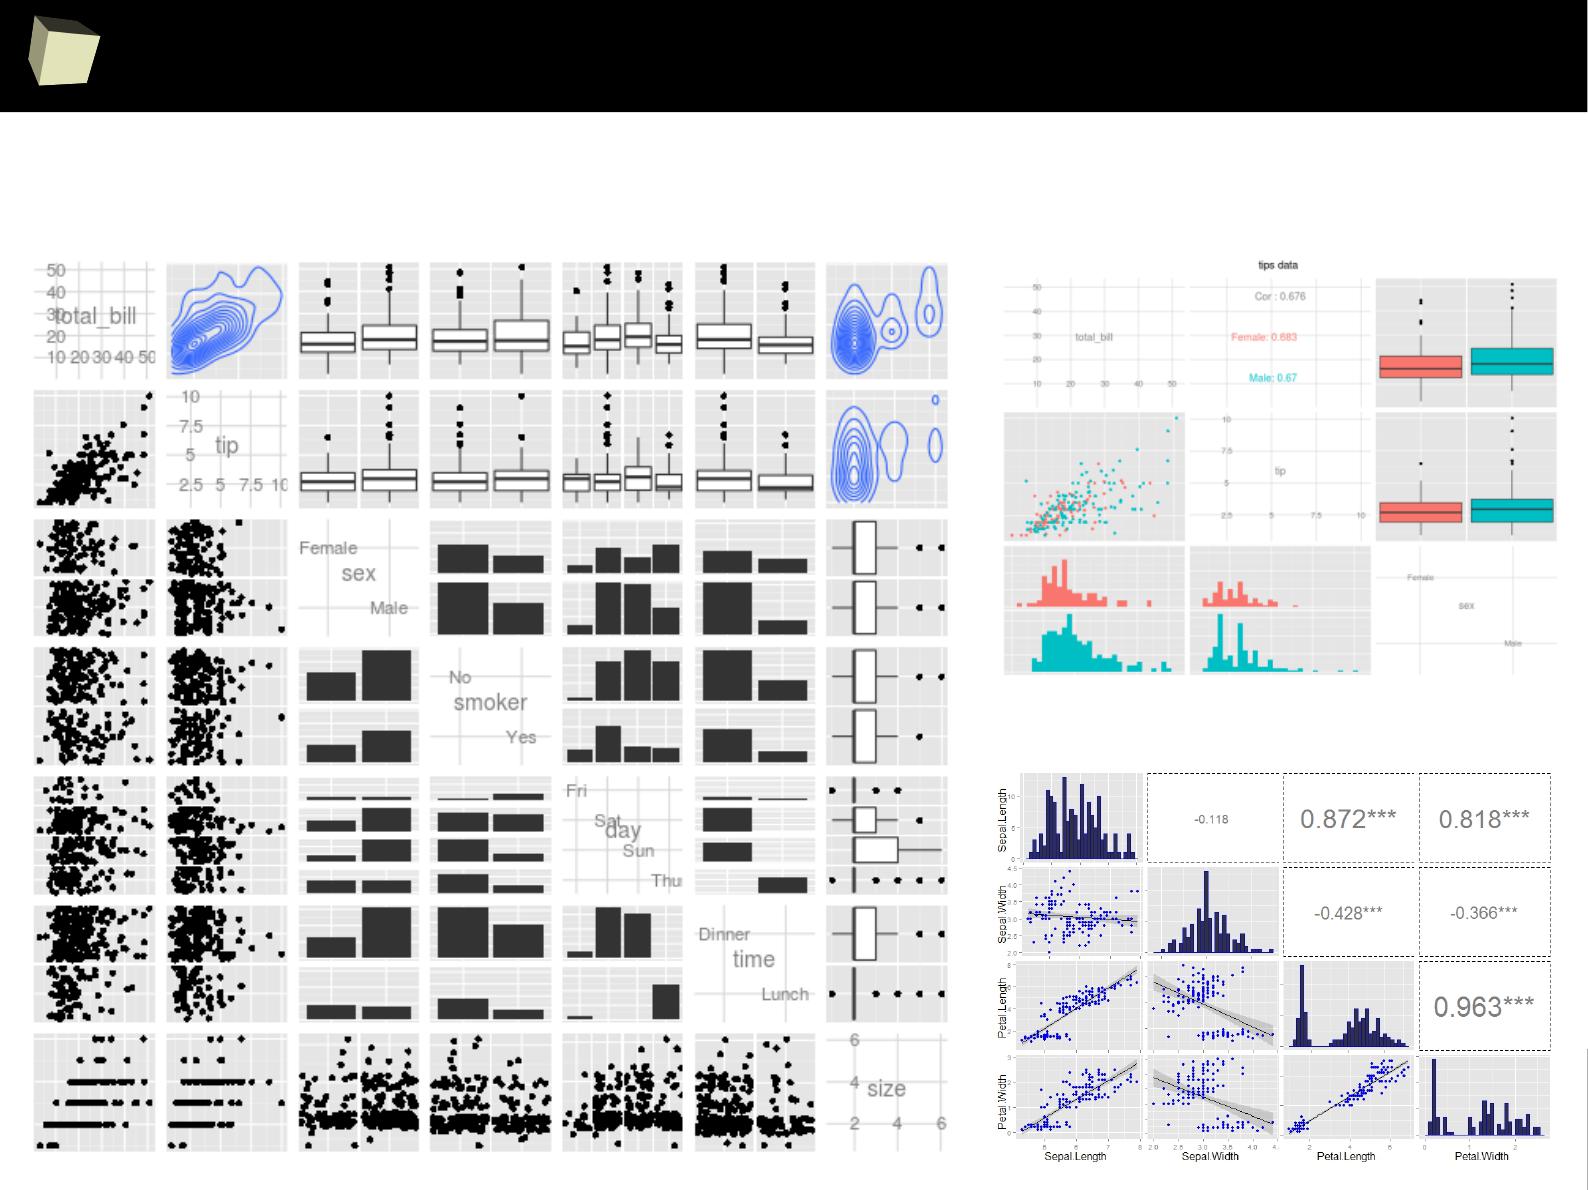
2
6
8
Additional helpers for ggplot2: GGally
Creates a matrix of ggplot2 graphs for data exploration purposes.
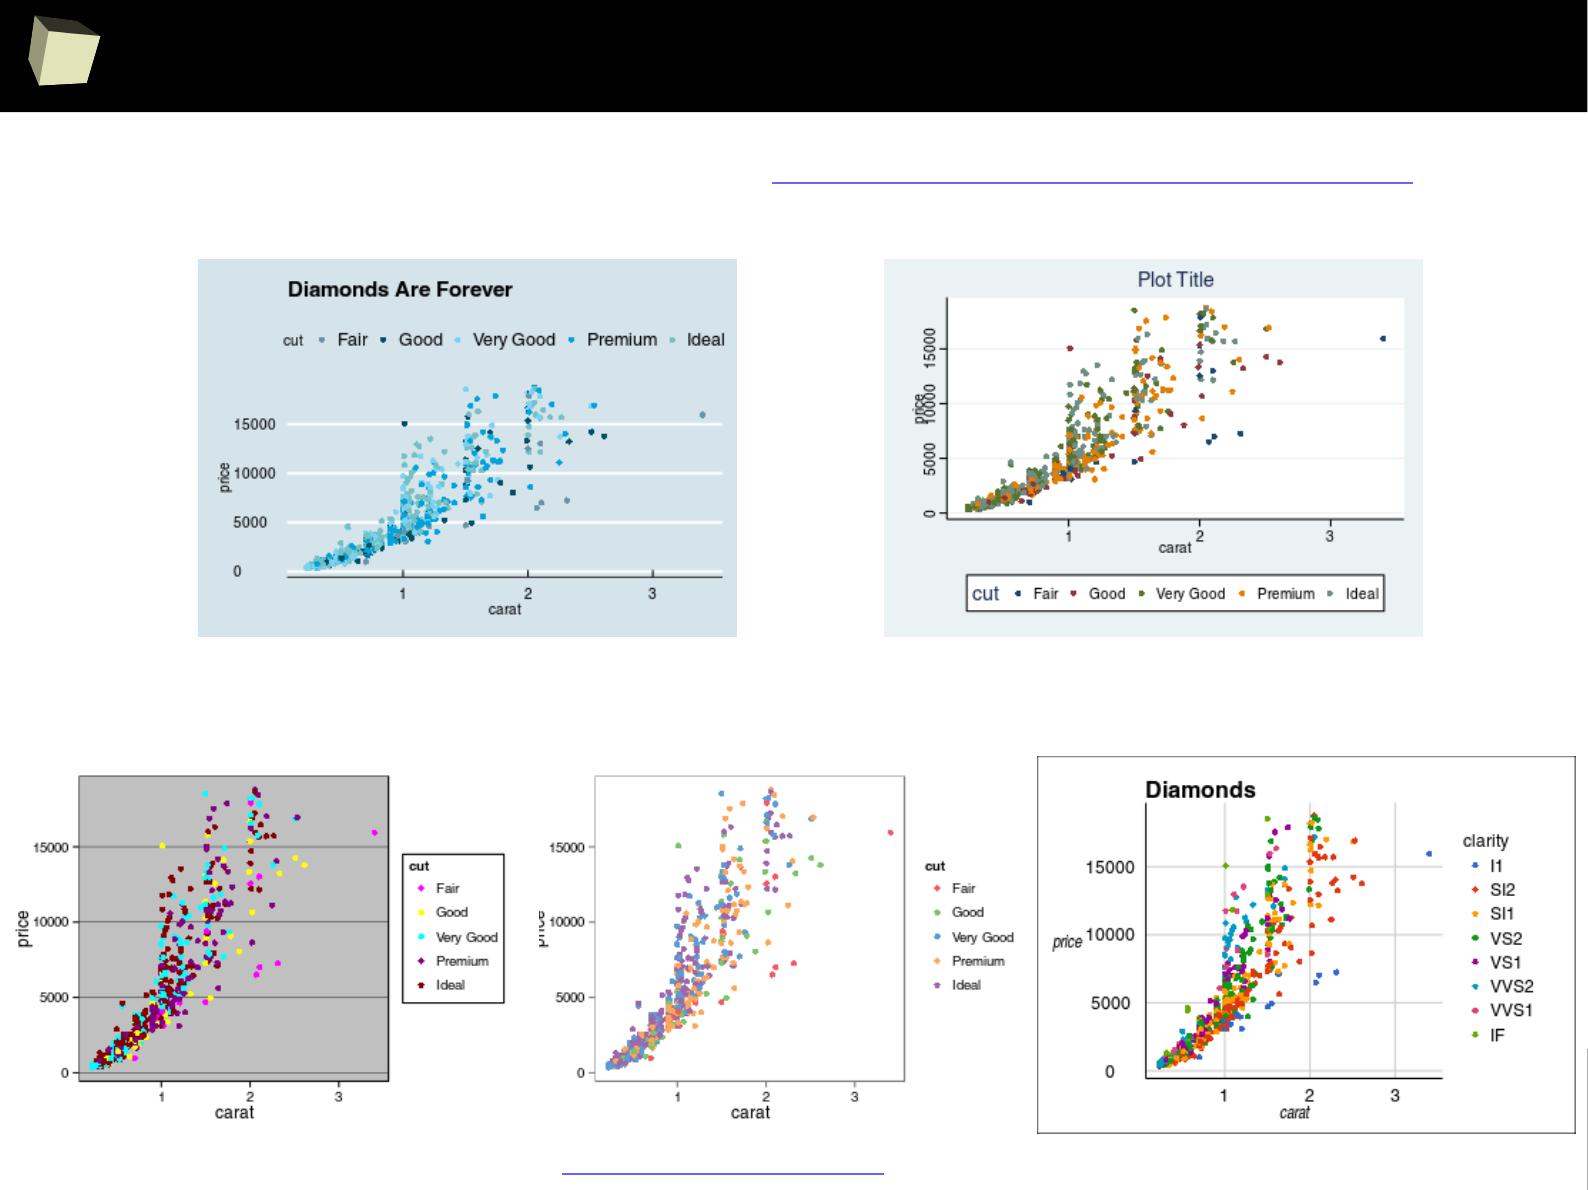
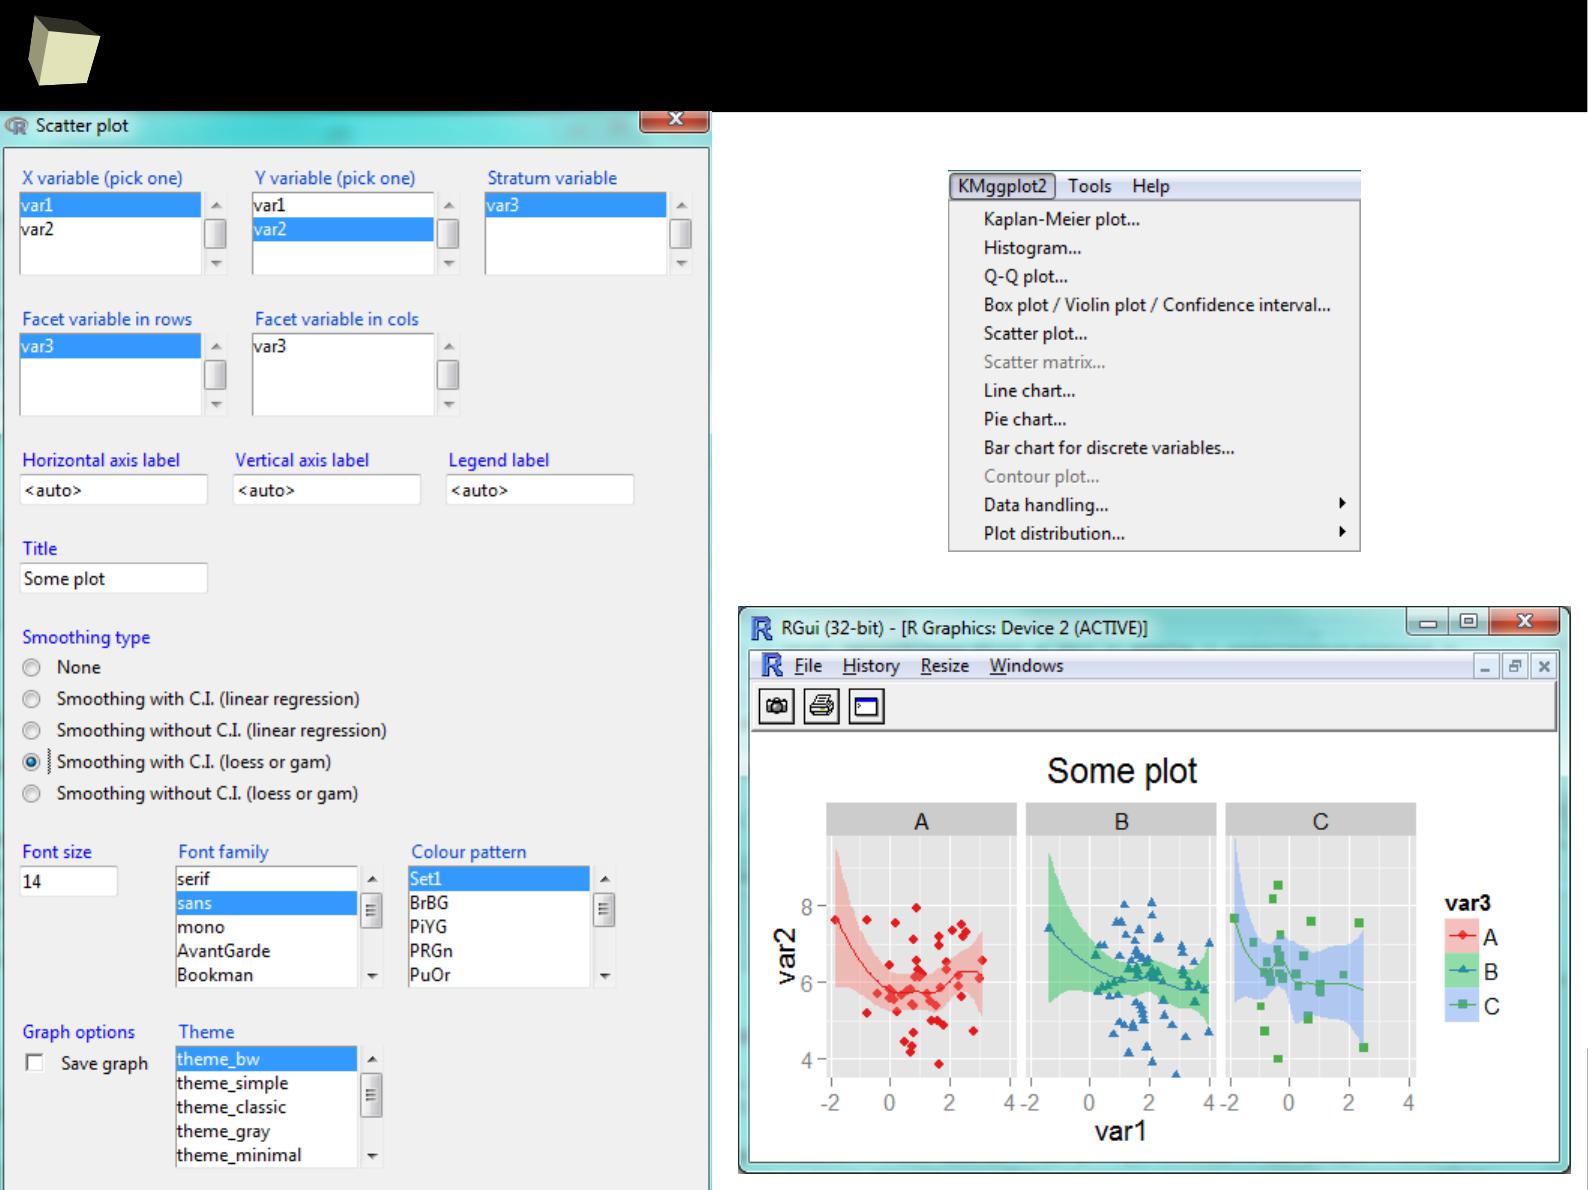
2
7
0
KMggplot2 plugin for RCommander

2
7
1
Deducer
Since ggplot2 is an implementation of Grammar of Graphics, which defines any
graphics as a set of objects and layers and properties, it is possible to create
graphical editor working on the principle “point and click”.
The Deducer package is an attempt to achieve
this goal drawing from the power of ggplot2.
It allows the user to define complex panel of
charts using only mouse.
This is, in my opinion, one of the most advanced,
graphical, free chart creator available in the
Internet.
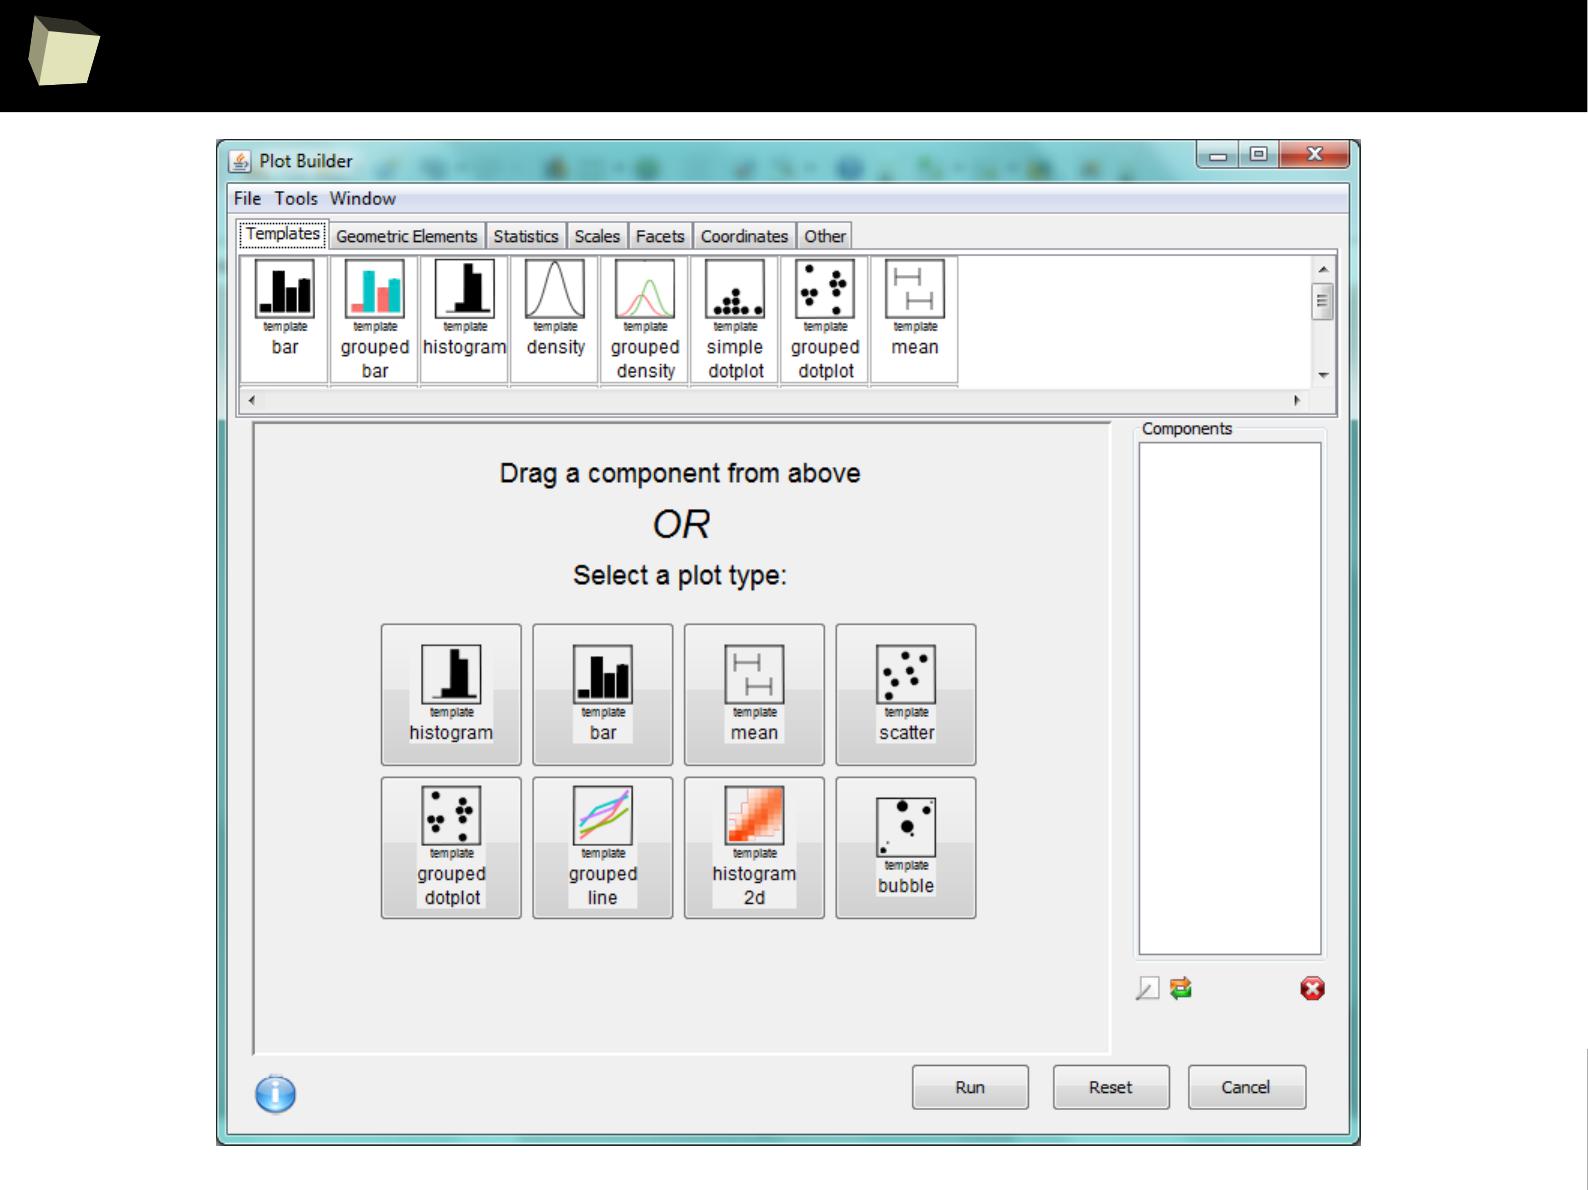
2
7
2
Deducer
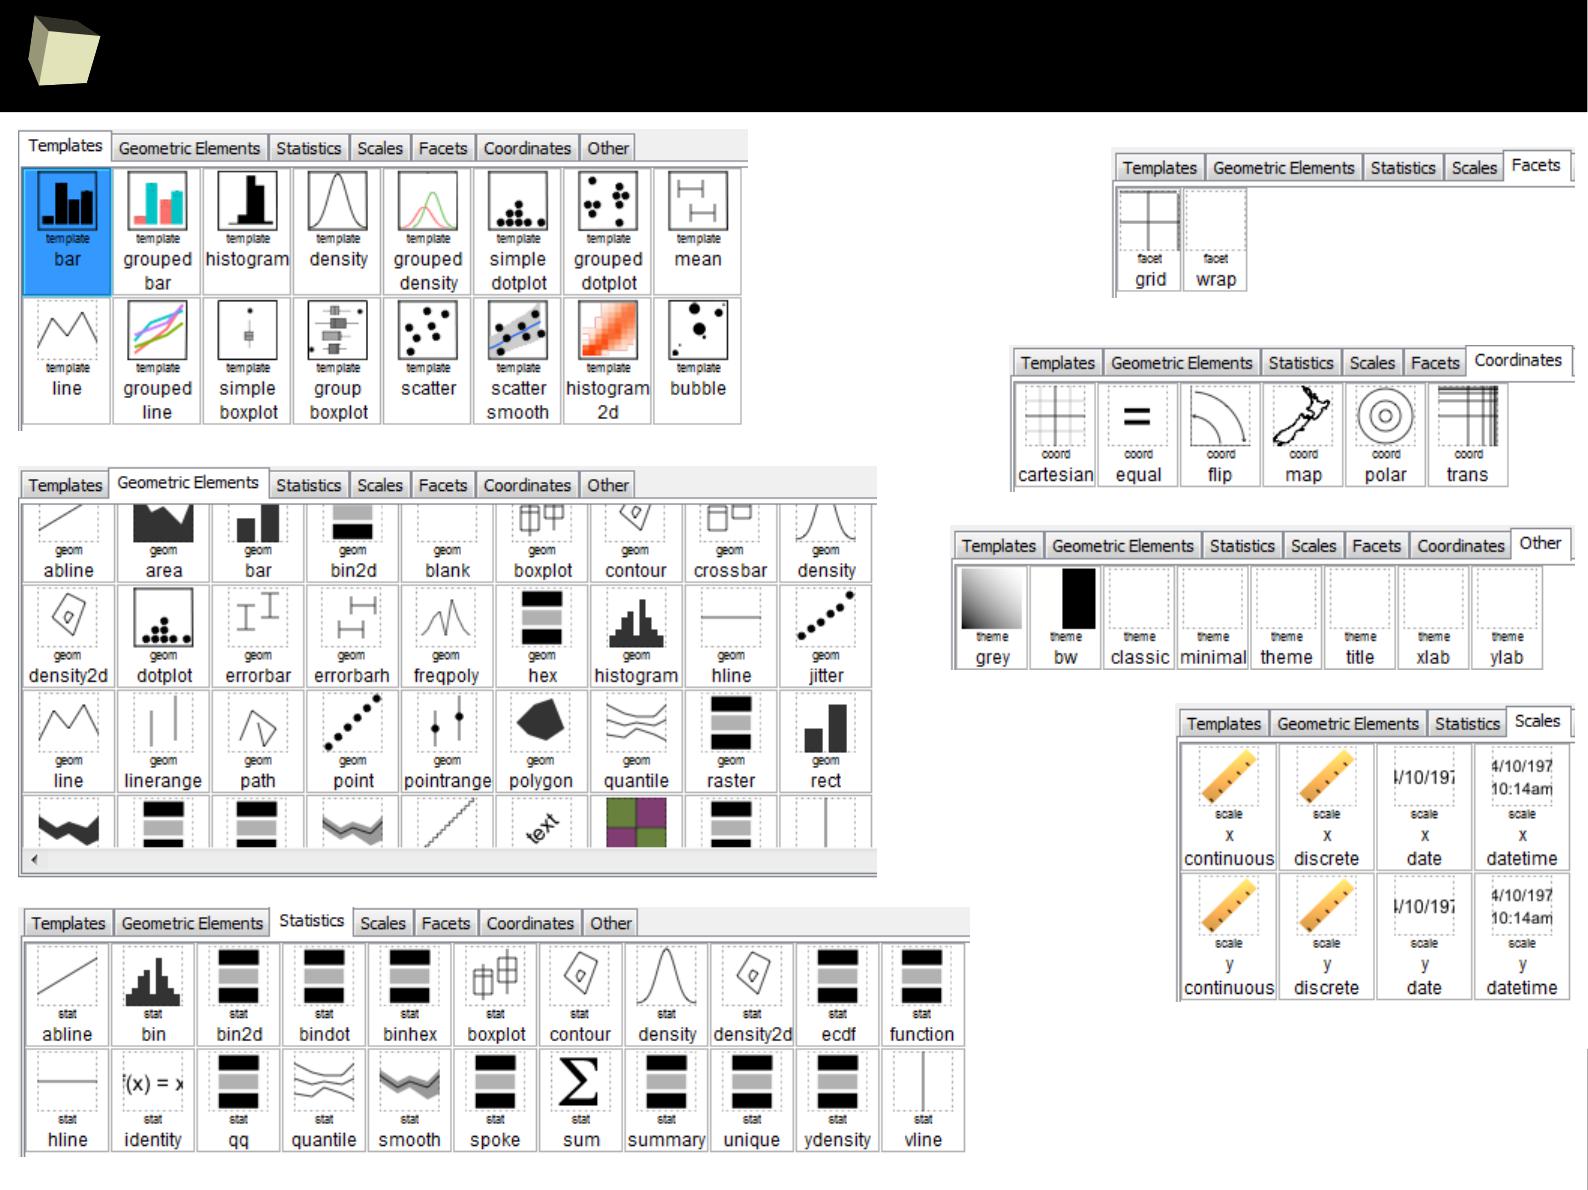
2
7
3
Deducer
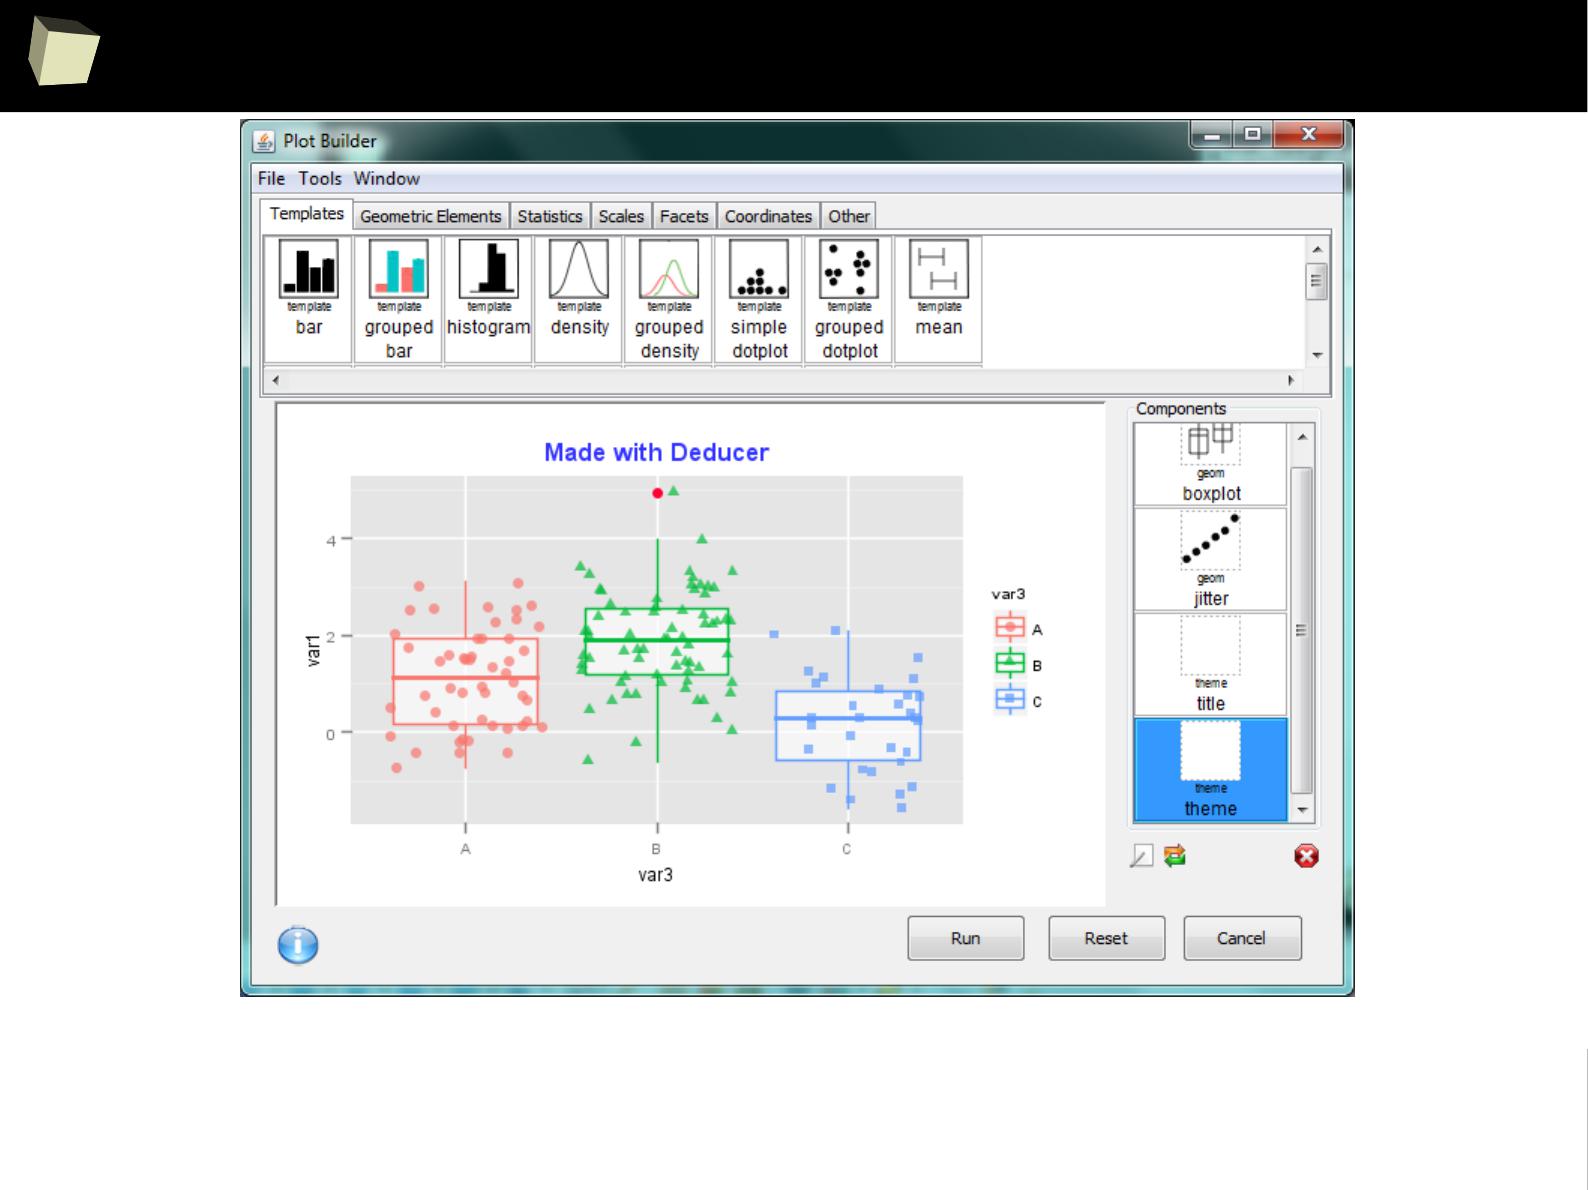
2
7
4
Deducer
ggplot() + geom_boxplot(aes(y = var1,x = var3,colour = var3),data=data,alpha = 0.6,outlier.colour = '#ff0033') +
geom_jitter(aes(x = var3,y = var1,shape = var3,colour = var3),data=data,alpha = 0.7) +
ggtitle(label = 'Made with Deducer') +
theme(plot.title = element_text(family = 'Helvetica',face = 'bold',colour = '#3333ff',size = 17.0,vjust =
1.0),panel.border = element_line())
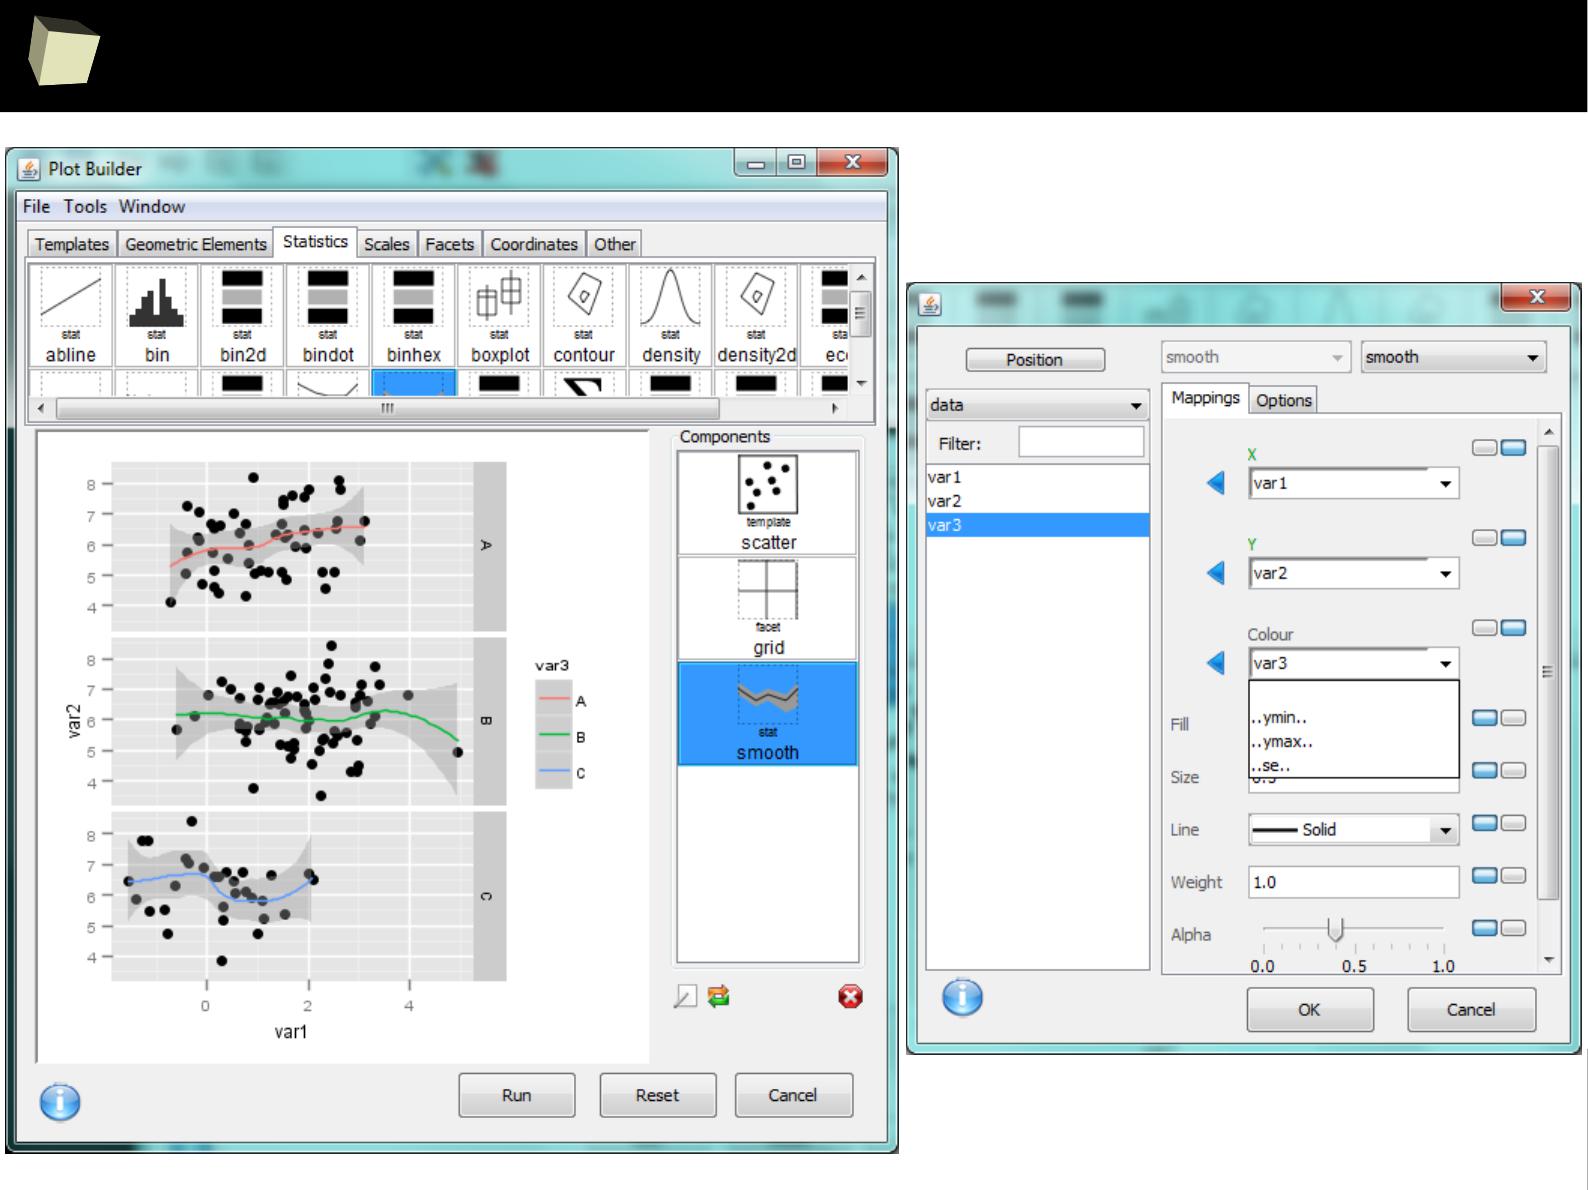
2
7
5
Deducer
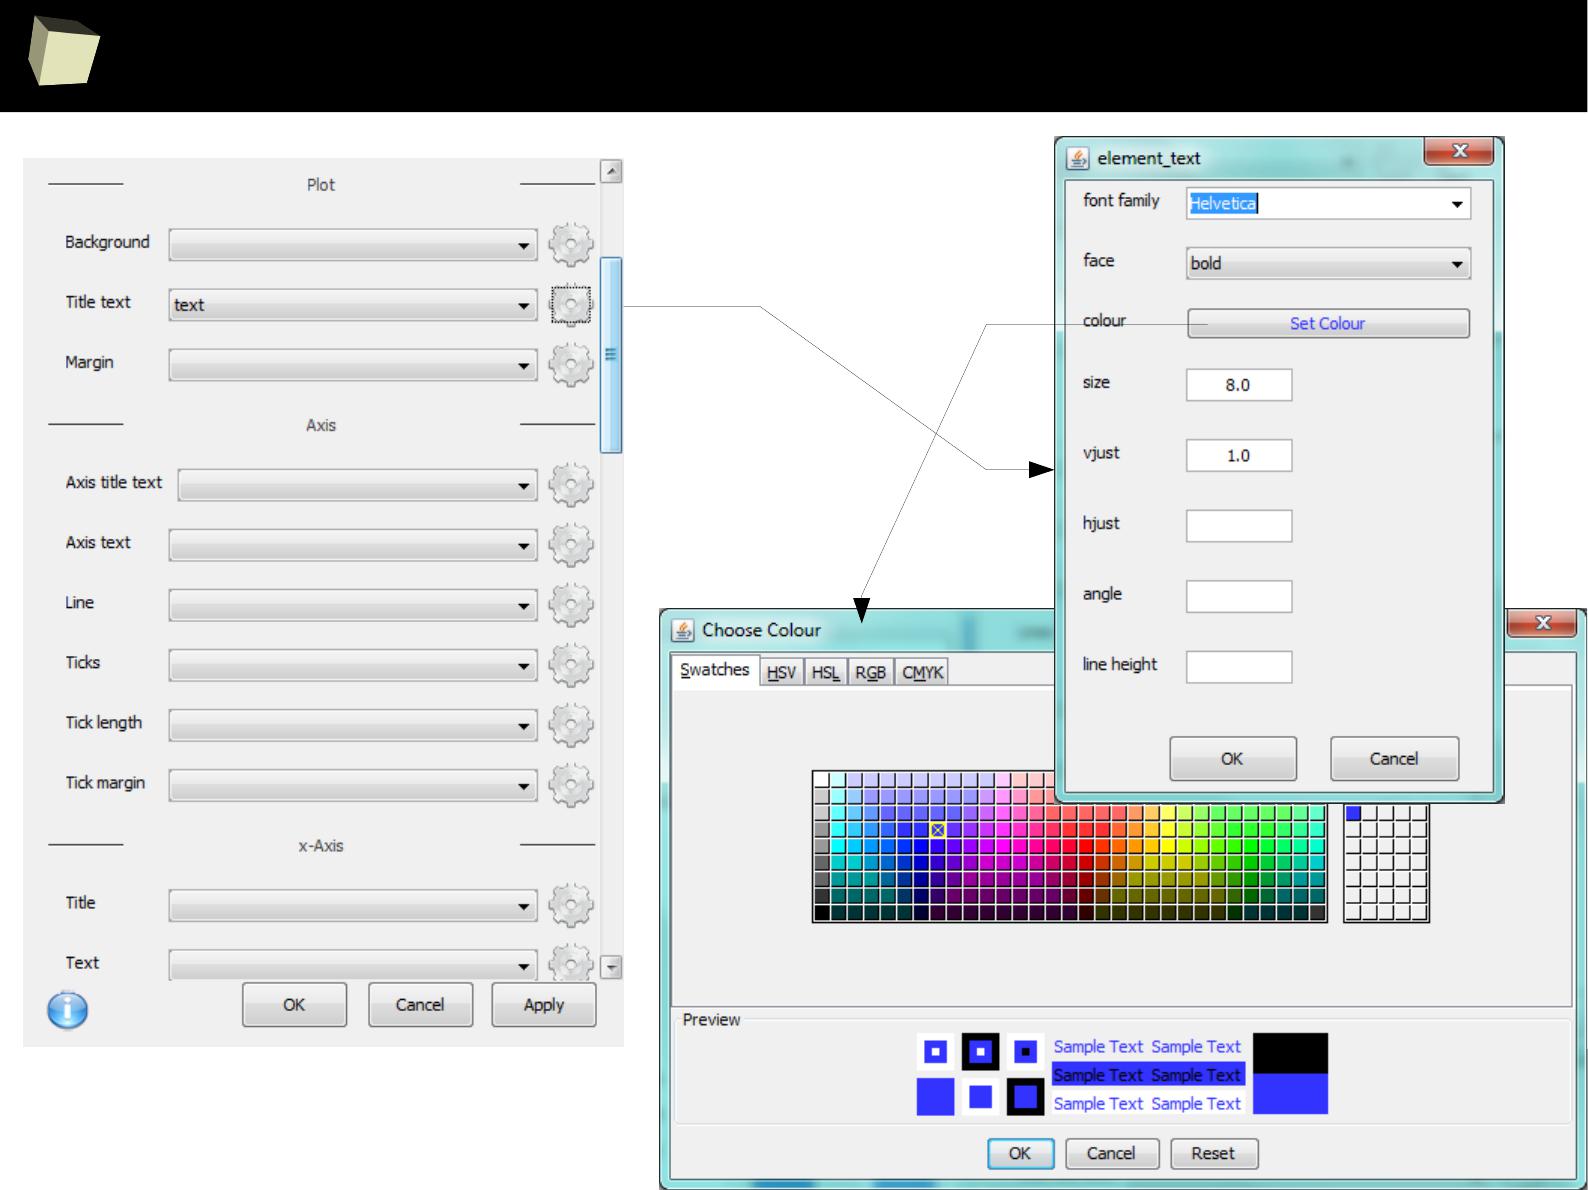
2
7
6
Deducer – control dozens of graph properties
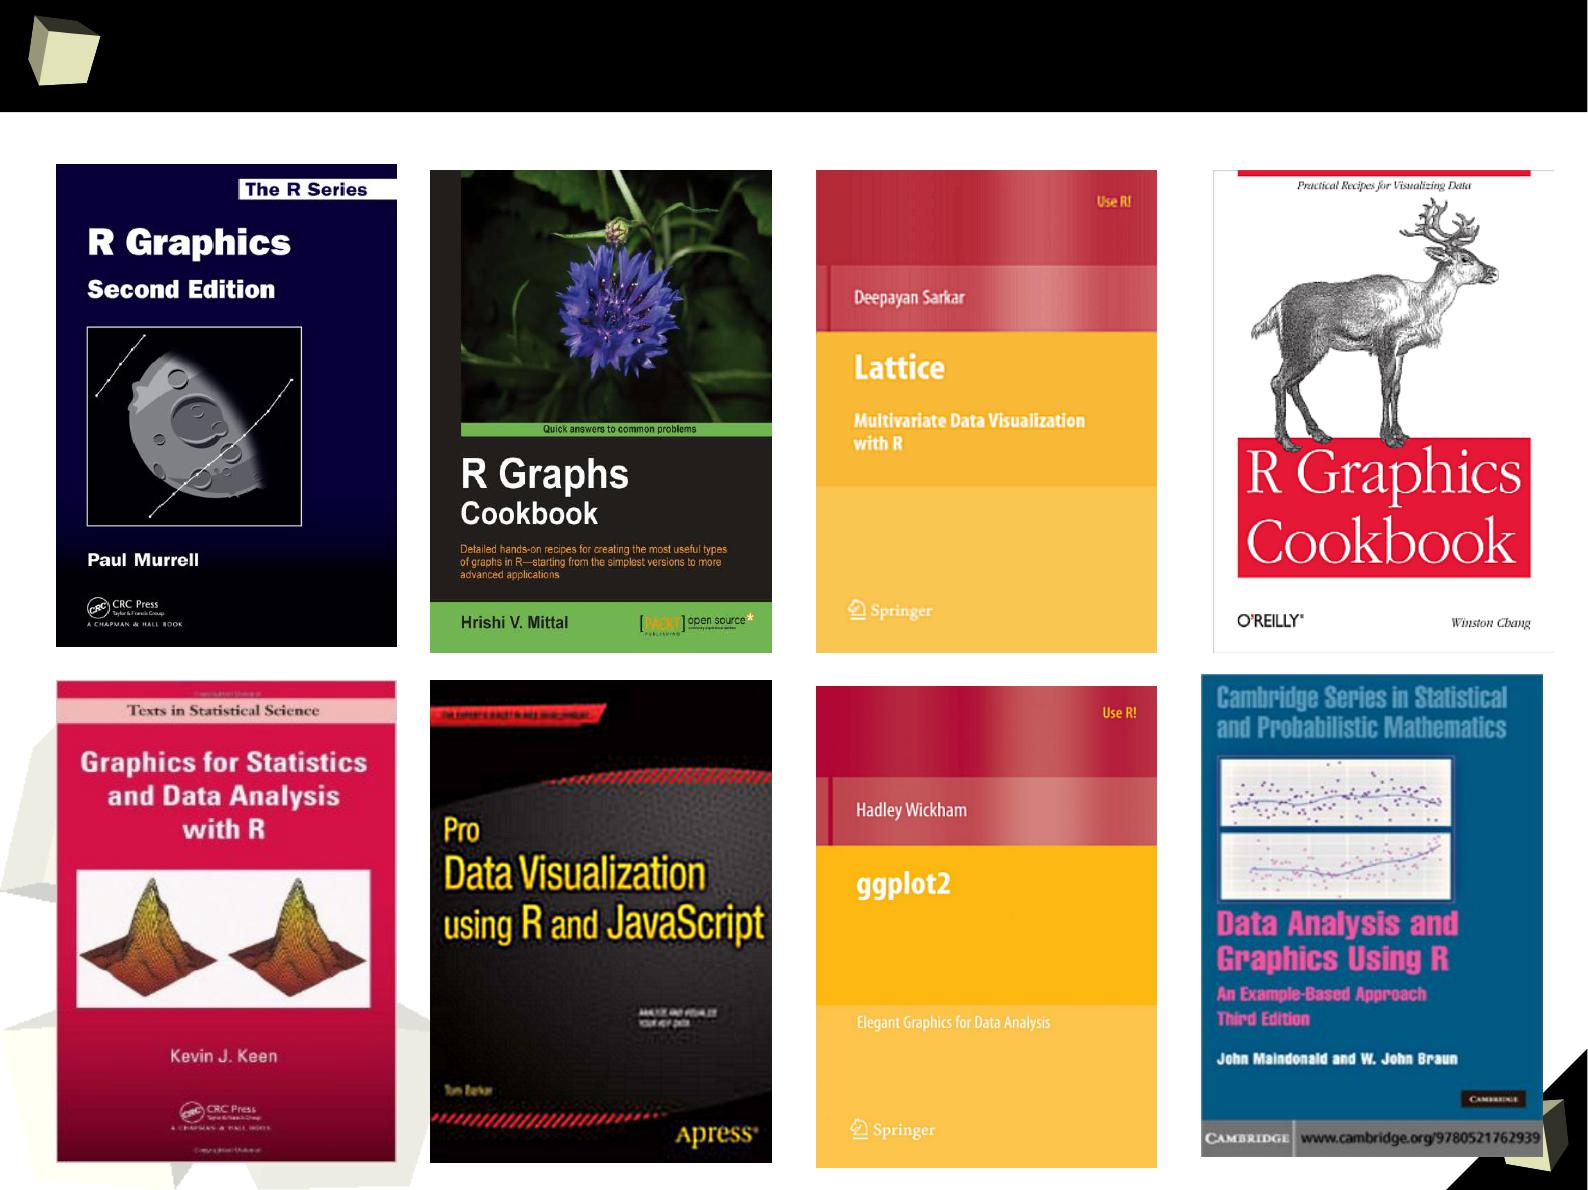
2
7
7
Some books about data visualization in R
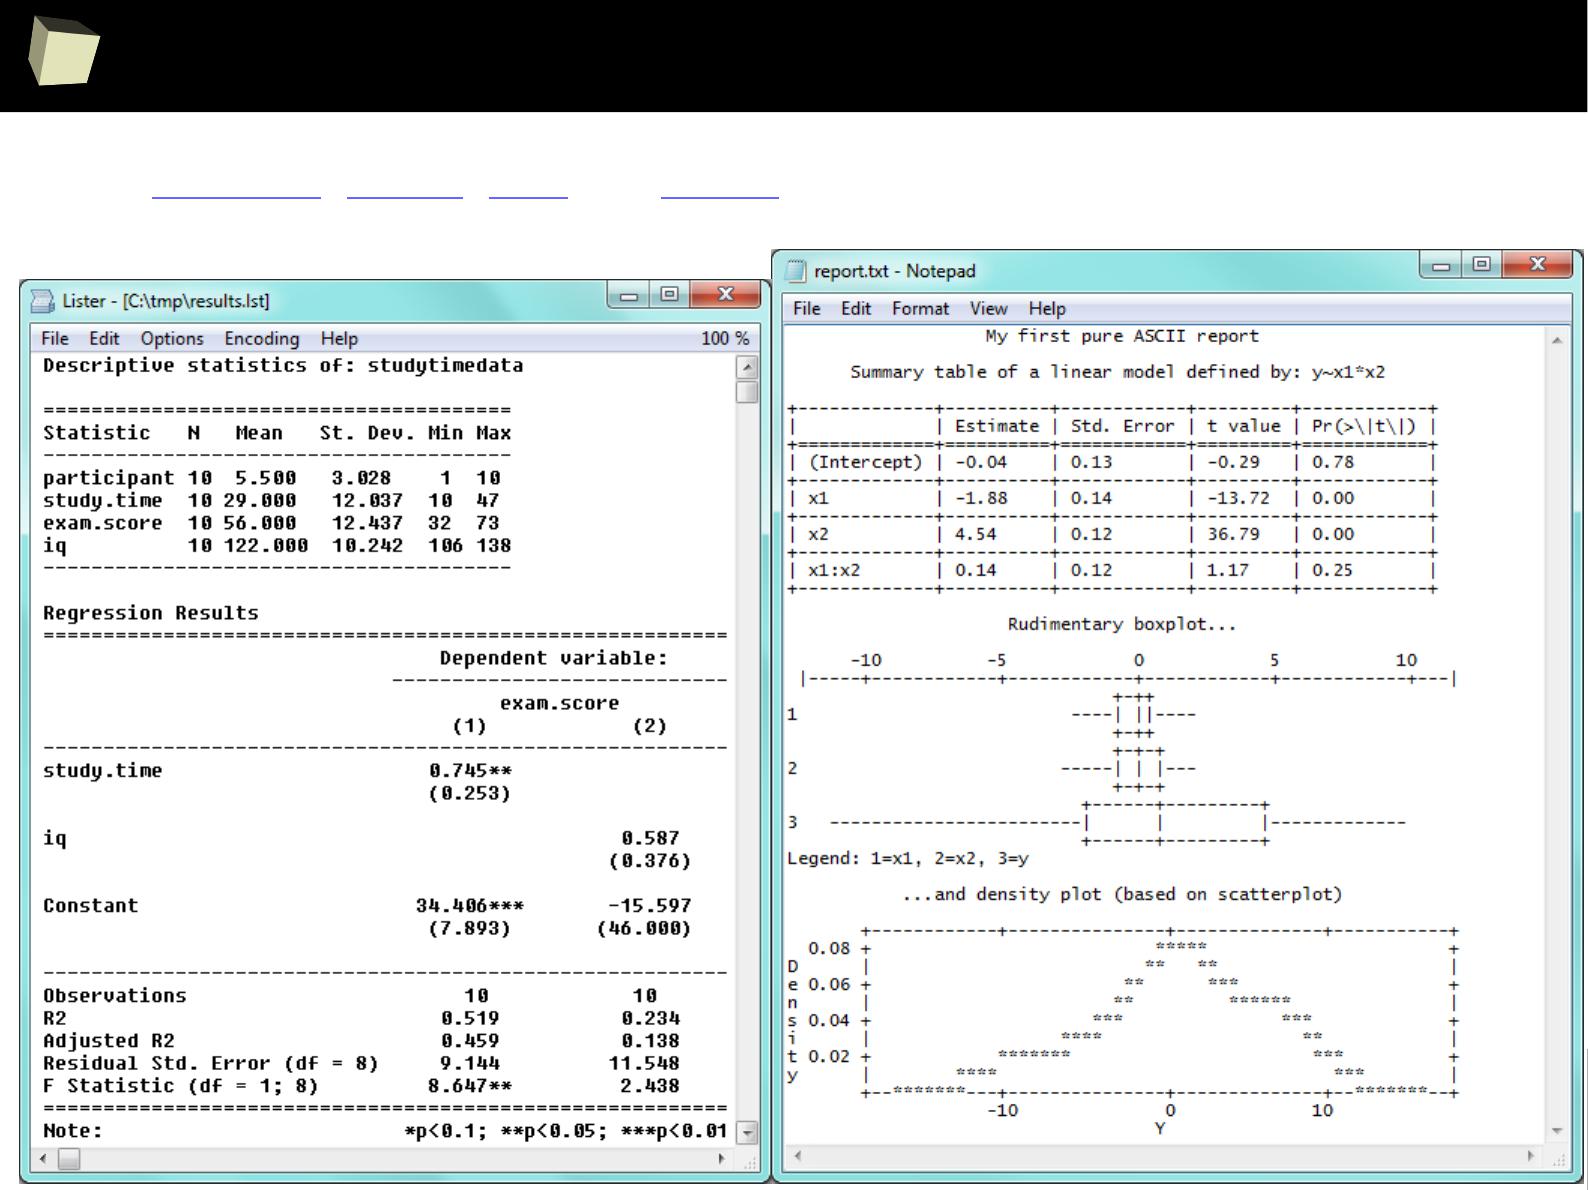
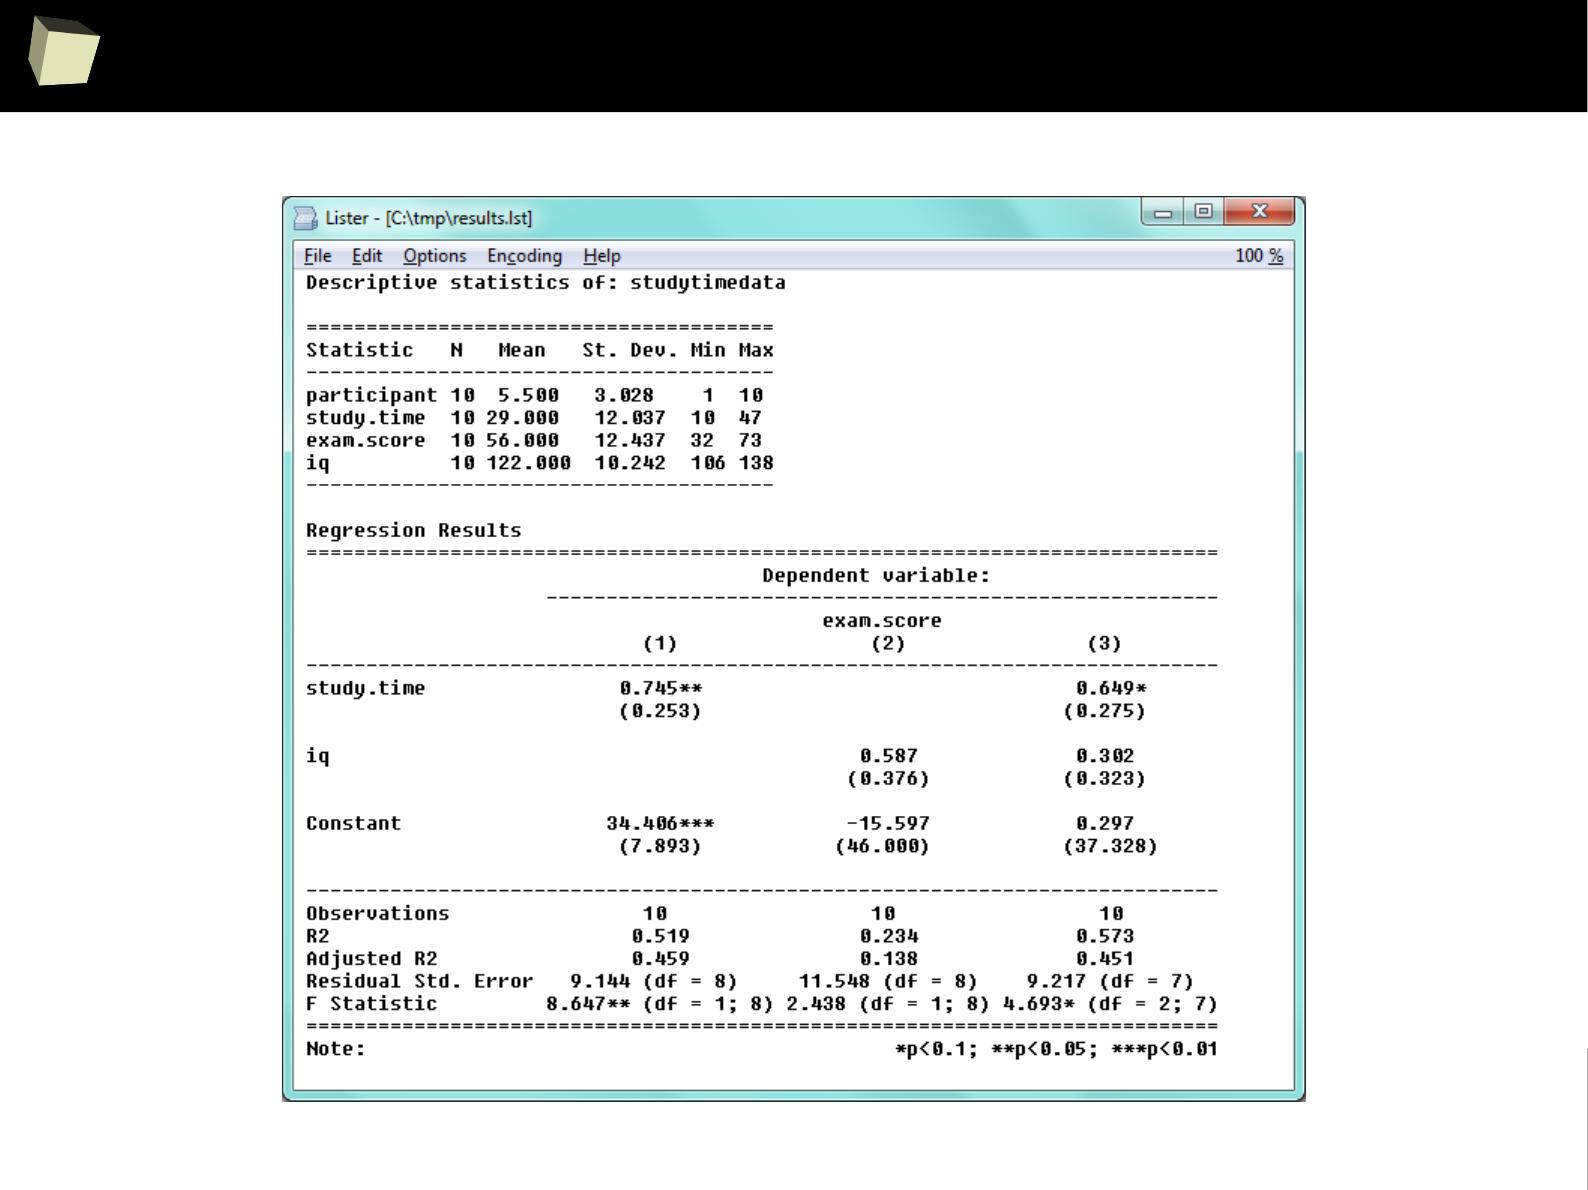
2
7
9
Plain ASCII output
SAS listings

2
8
0
13 reasons why you will love GNU R
I R is (extremely) cheap. In fact - it's free :)
II R has (extremely) wide range of capabilities
III R is (widely) supported by the world of science
IV R is supported by the community
V R is (increasingly) supported by the business
VI R is able to read data in many formats
VII Interoperability is easy to achieve
VIII R is truly cross-platform
IX R offers numerous ways of presenting data
X There are many options to optimize the code
XI R is able to handle large amount of data
XII R has a set of fancy tools and IDEs
XII FDA accepted using R for drug trials!

2
8
1
Tune it up!
R offers a bunch of methods that can remarkably increase the performance of
algorithms in the case of performing complex calculations:
●
Profiling the code, which enables us to determine the computationally
intensive portions of the program
●
Turning on the “Just In Time” compilation of the code
●
Vectorizing calculations – which means avoiding explicit loops. It can
speed up computations 5-10 times
●
Performing all algebraic computations with the use of libraries tuned
for our hardware (e.g. BLAS)
●
Become familiar with methods of algorithmic differentiation (ADMB)
●
Executing parallel computations in a cluster environment
●
Using the power of a graphic card processor (CUDA, OpenCL)
●
Implement key parts of algorithm in C++ and call them using RCPP
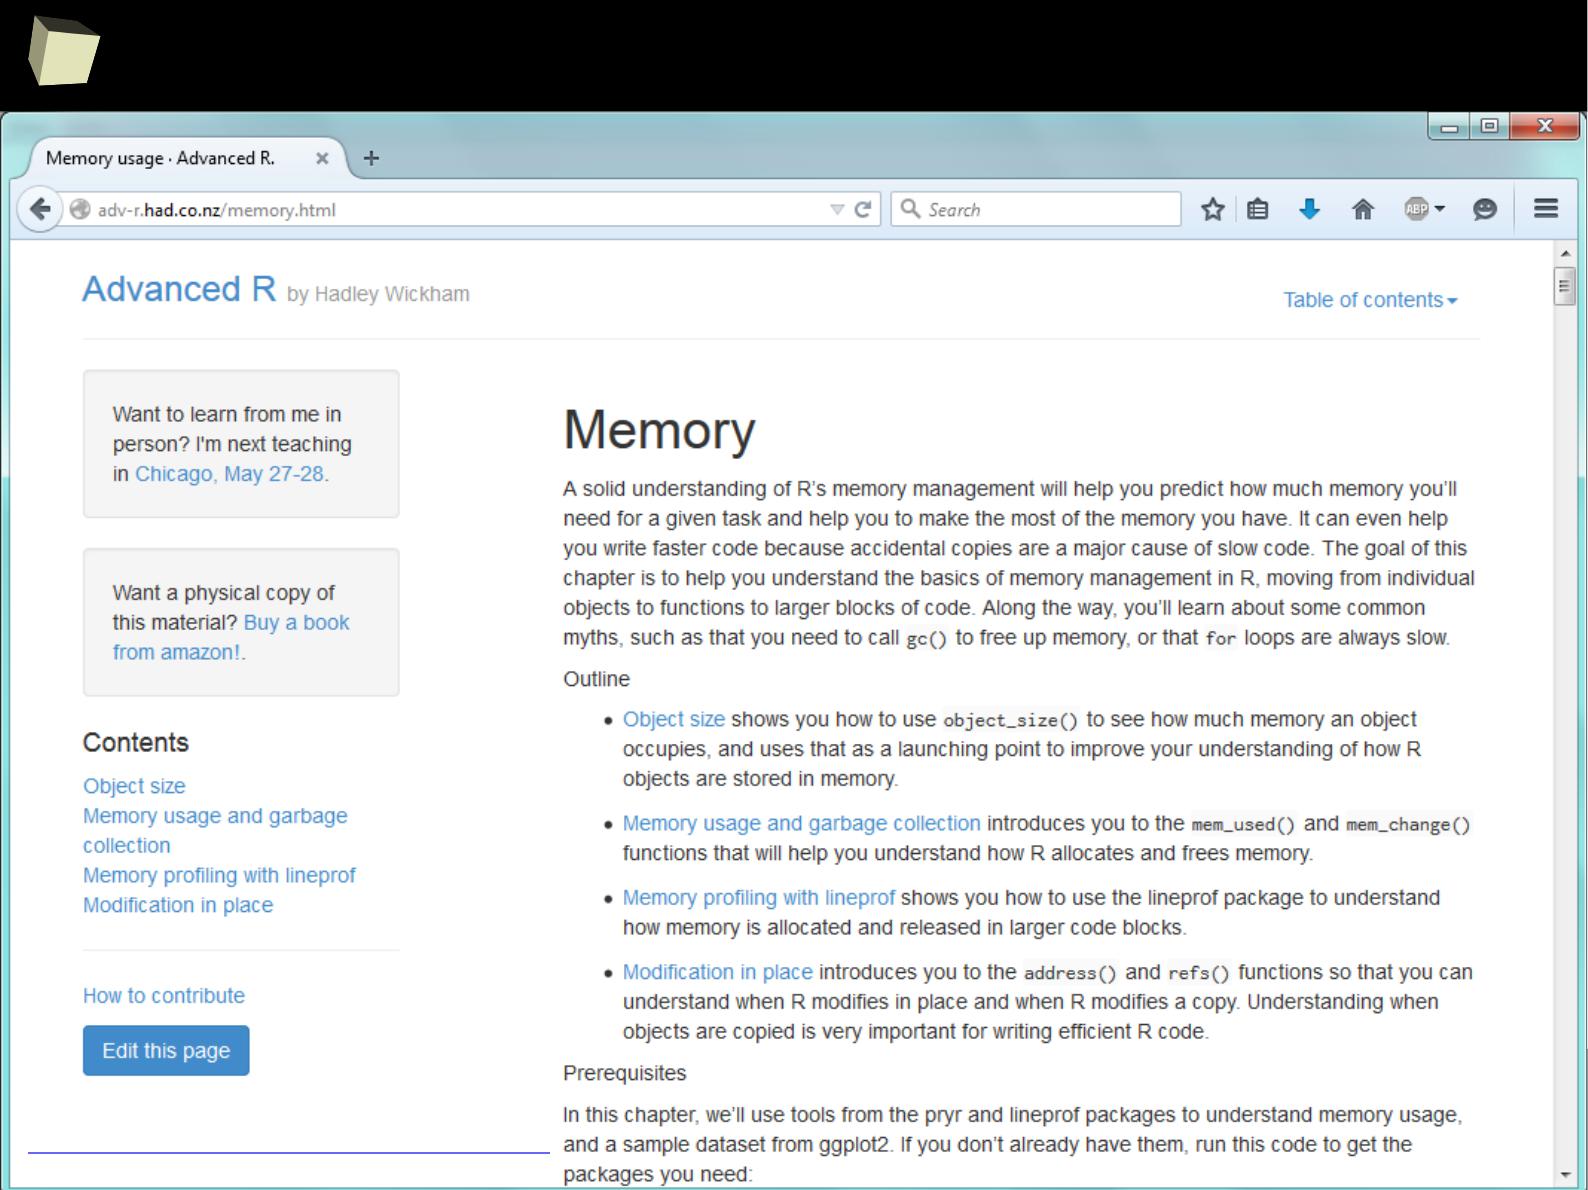
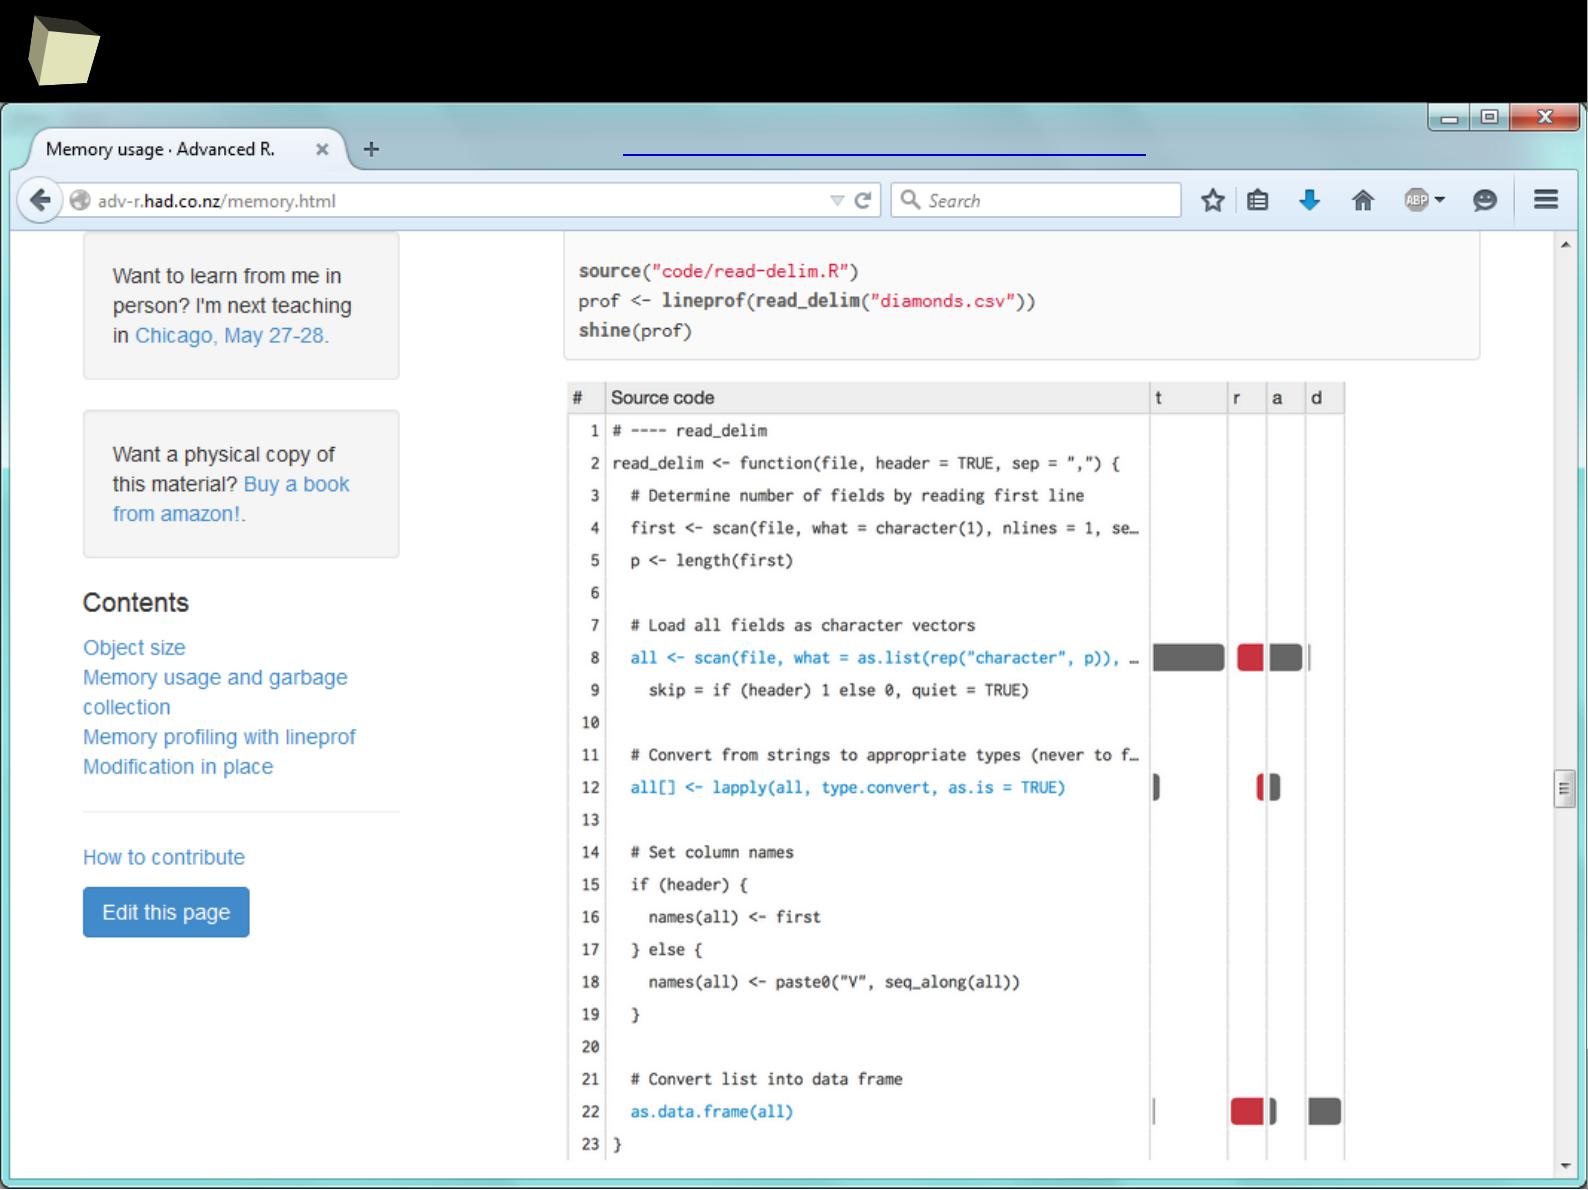
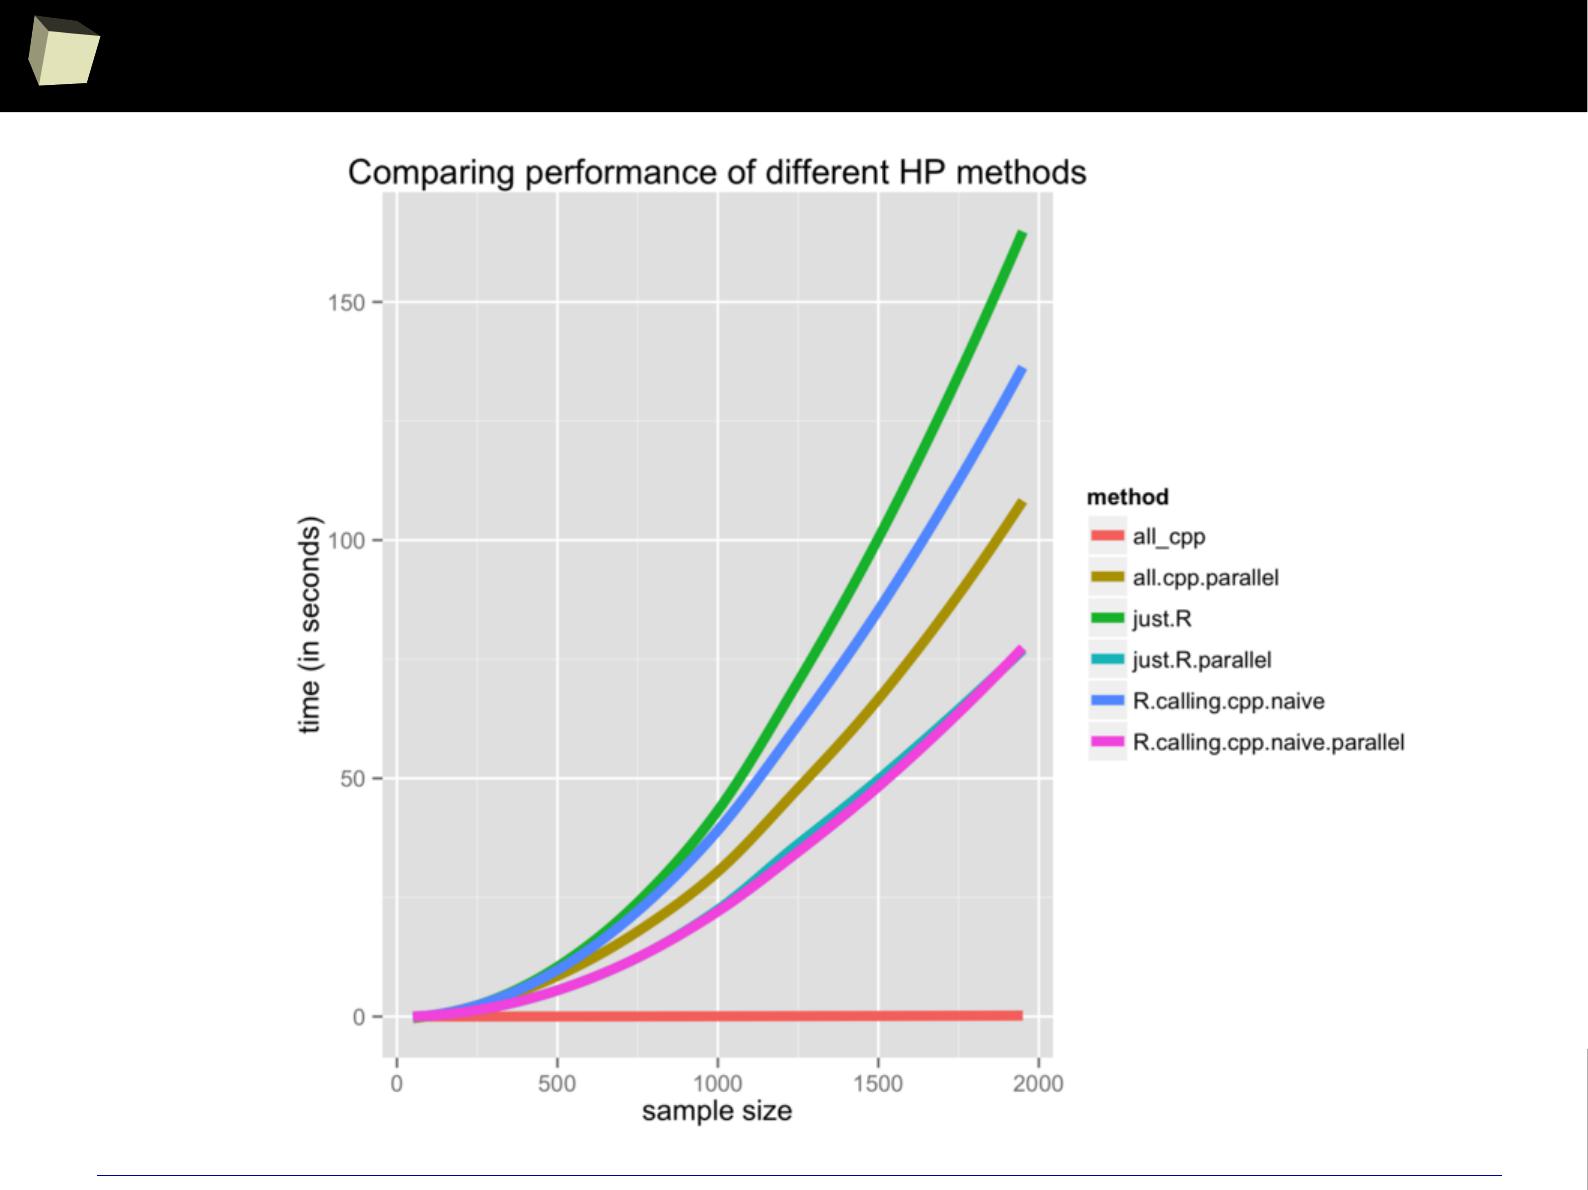
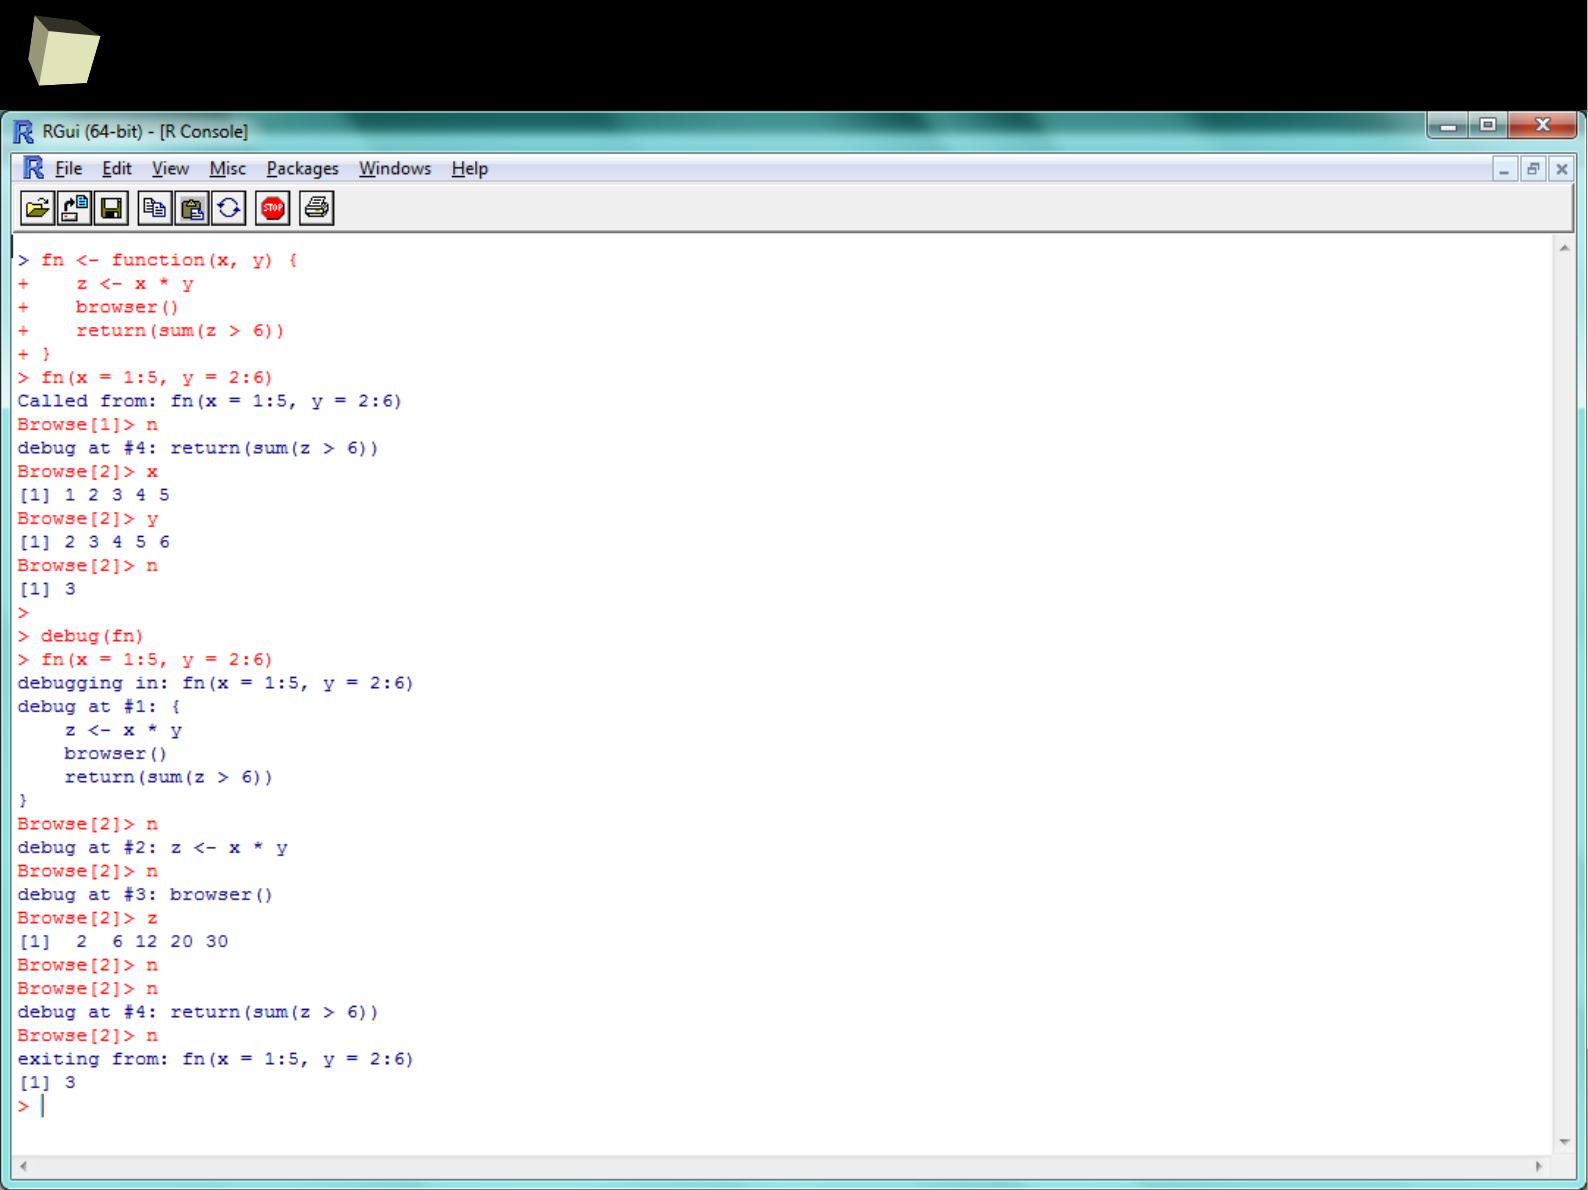
2
8
6
Debug your code!
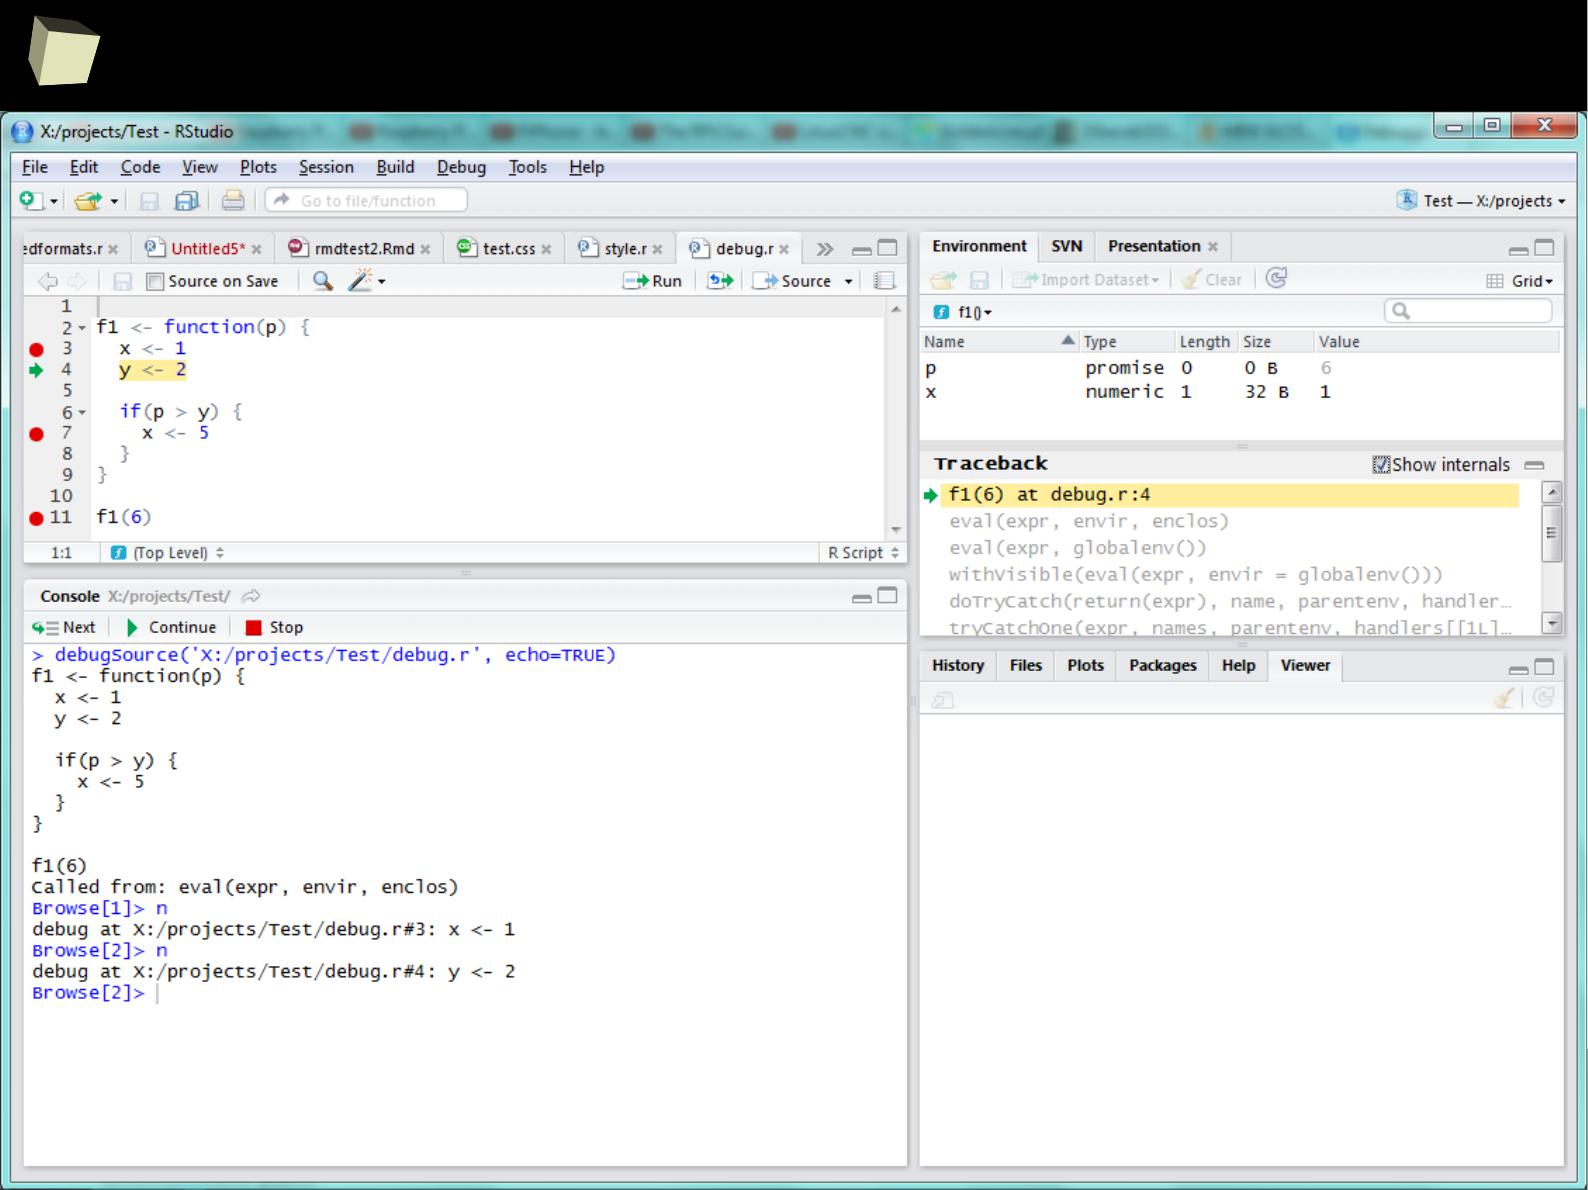
2
8
7
Debug your code!

2
8
8
13 reasons why you will love GNU R
I R is (extremely) cheap. In fact - it's free :)
II R has (extremely) wide range of capabilities
III R is (widely) supported by the world of science
IV R is supported by the community
V R is (increasingly) supported by the business
VI R is able to read data in many formats
VII Interoperability is easy to achieve
VIII R is truly cross-platform
IX R offers numerous ways of presenting data
X There are many options to optimize the code
XI R is able to handle large amount of data
XII R has a set of fancy tools and IDEs
XII FDA accepted using R for drug trials!
2
8
9
“Big data” doesn't mean a “big trouble”
Sometimes there is a need for processing large datasets that don't fit
in the RAM memory. Size of the data cannot exceed 2GB per process
in a 32-bit machine and 8GB per process in a 64-bit machine.
In such cases R gives a couple of methods for handling massive data:
●
Building models on chunks of the data. Only linear models are supported
●
Mapping physical memory on a set of files (disk virtual memory)
●
Storing parts of datasets outside of the current process memory
http://www.r-pbd.org/
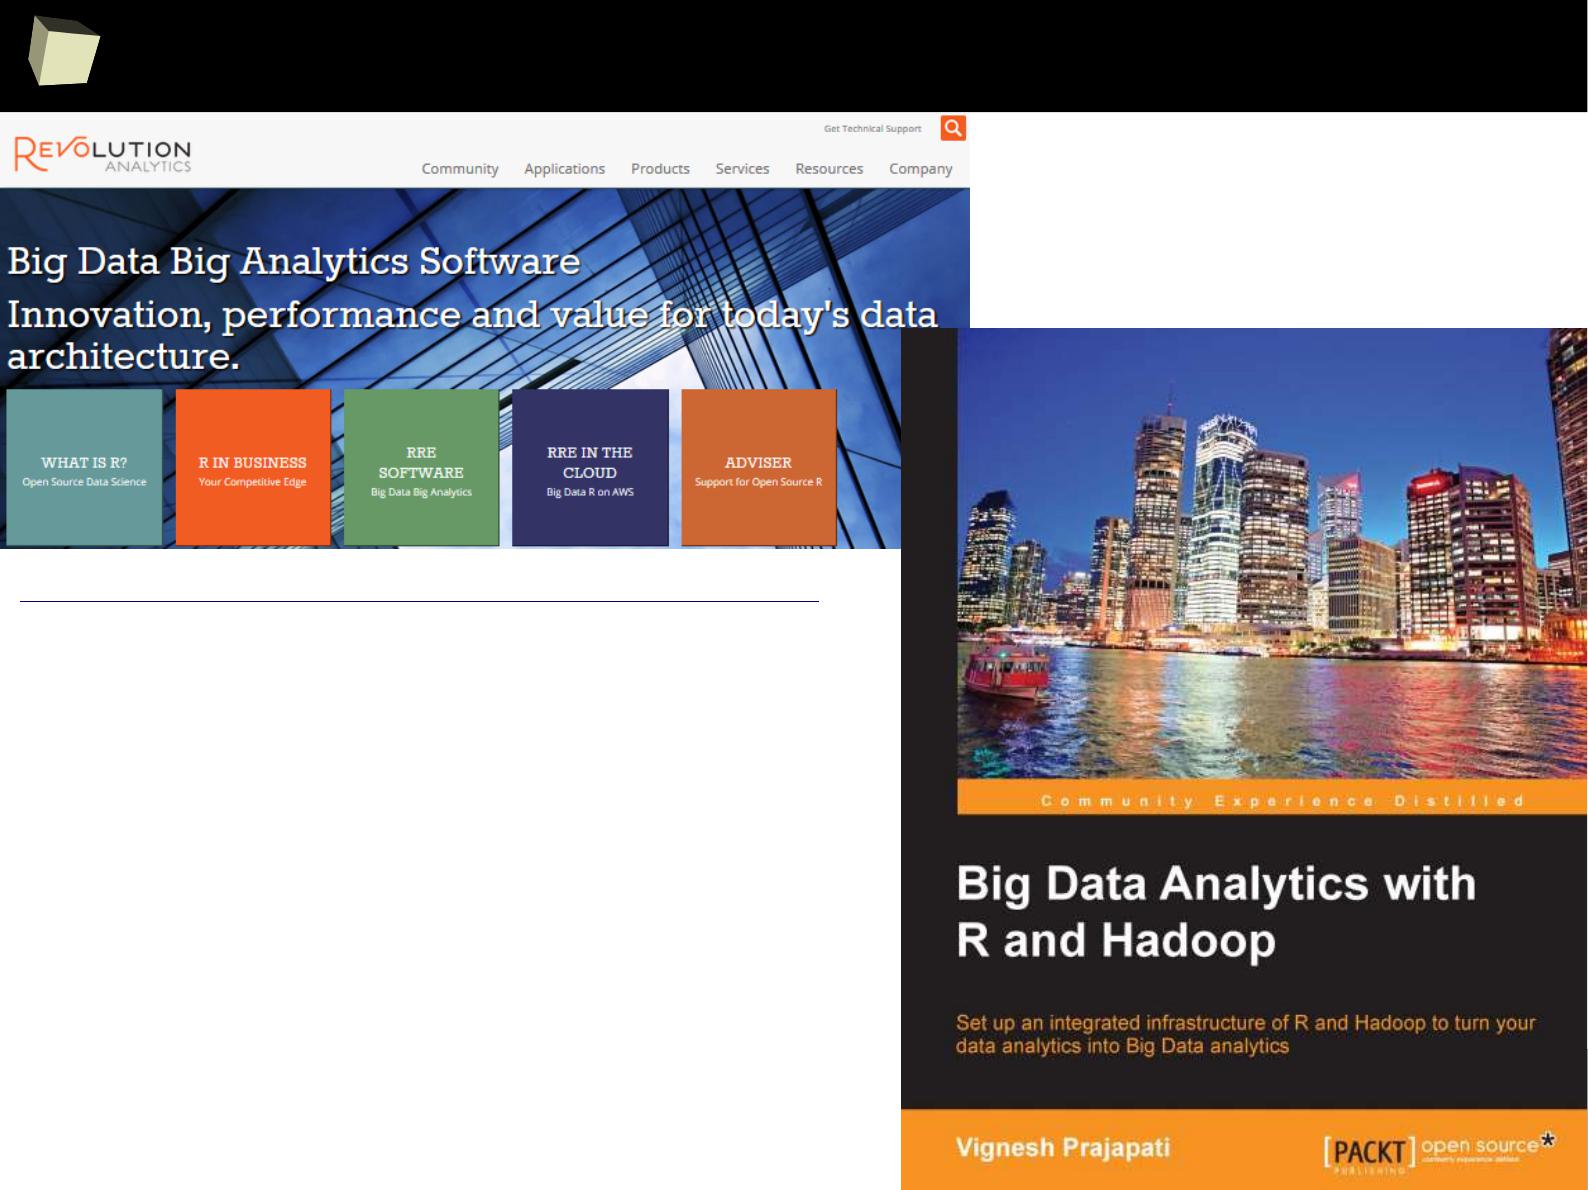
2
9
0
“Big data” doesn't mean a “big trouble”
●
Parallel computing:
●
Explicit and implicit parallelism
●
Grid computing
●
Hadoop
●
Random numbers
●
Resource managers and batch schedulers
●
Applications
●
GPUs
●
Large memory and out-of-memory data
●
Easier interfaces for Compiled code
●
Profiling tools
High-Performance and Parallel Computing with R:
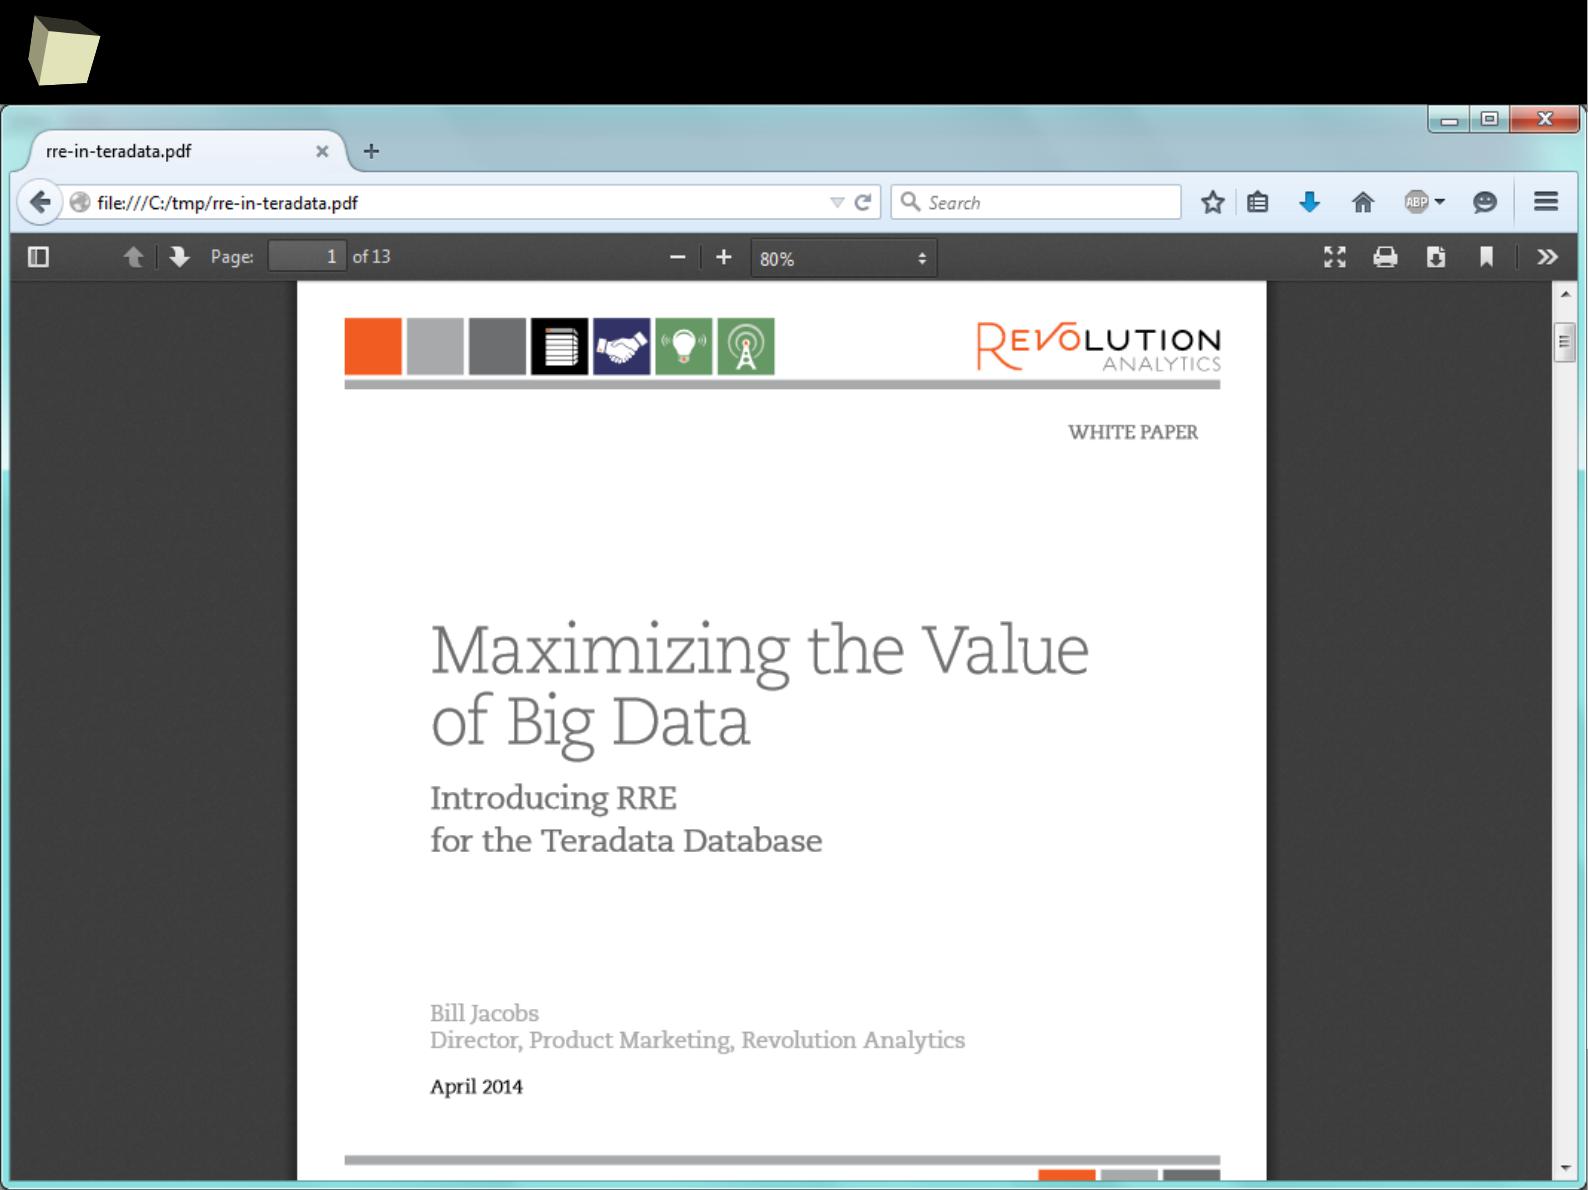
2
9
1
“Big data” doesn't mean a “big trouble”
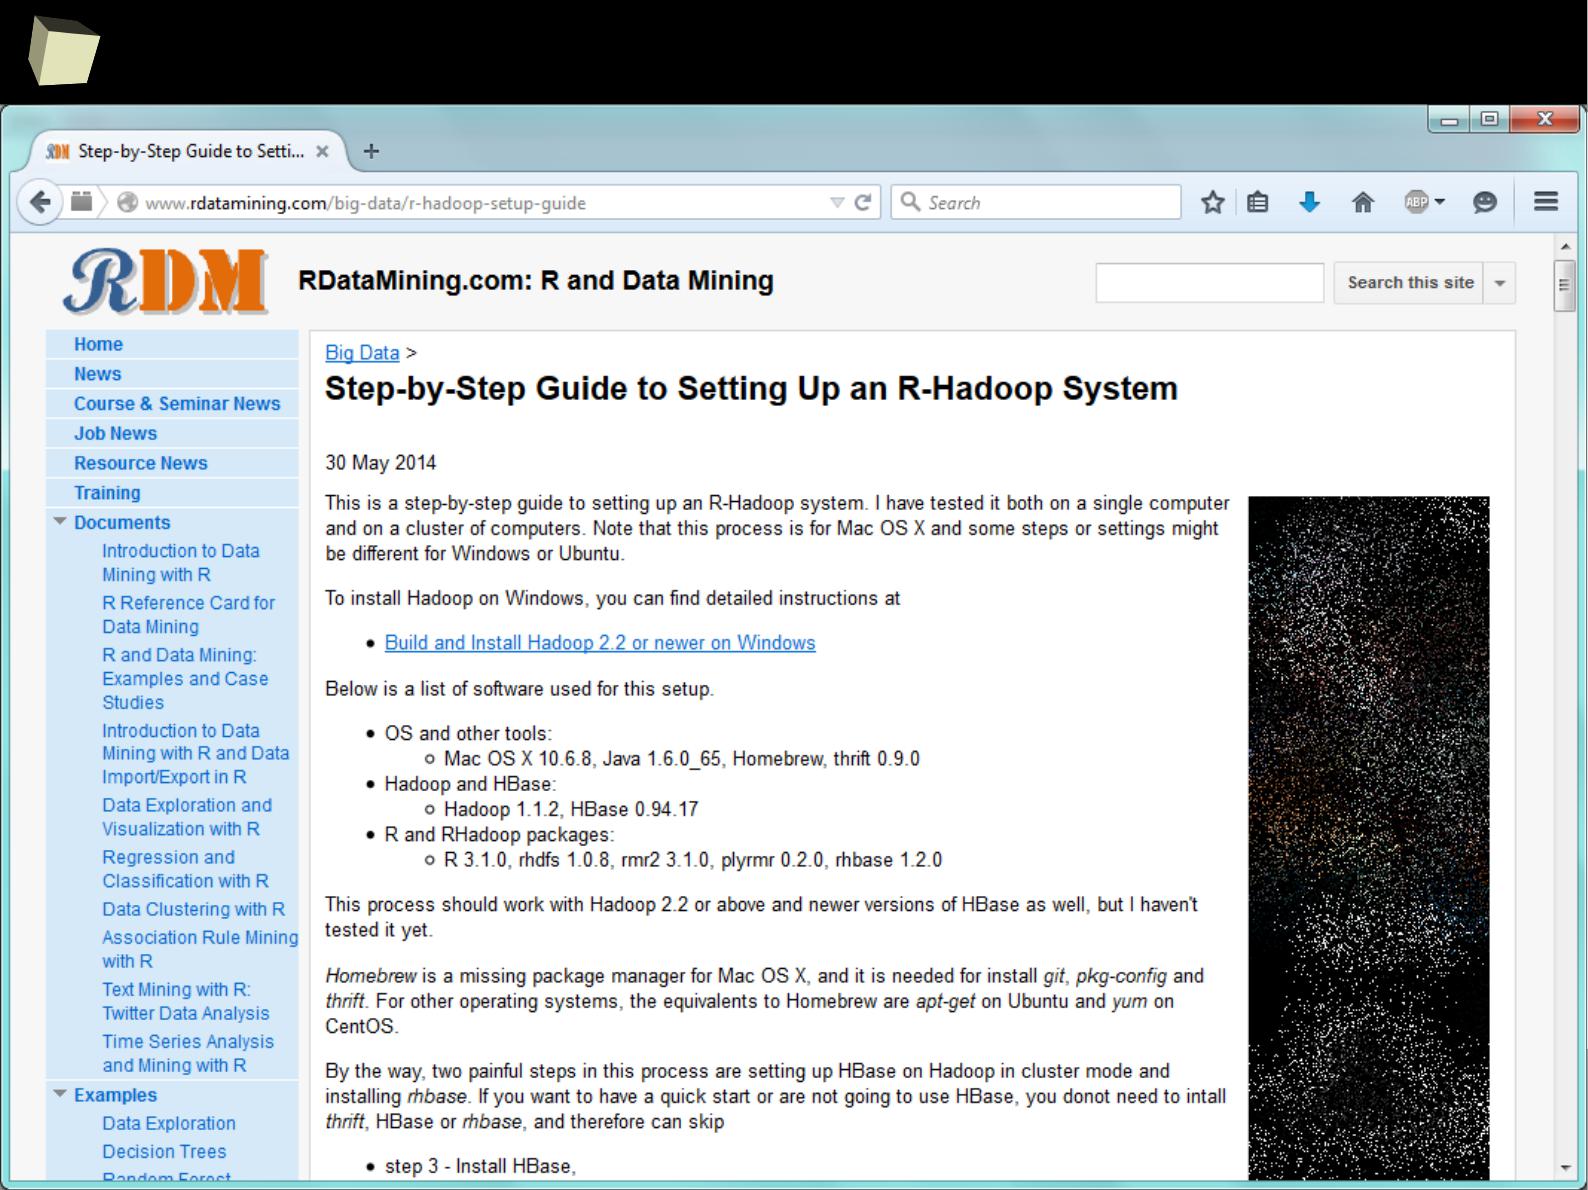
2
9
2
“Big data” doesn't mean a “big trouble”

2
9
3
13 reasons why you will love GNU R
I R is (extremely) cheap. In fact - it's free :)
II R has (extremely) wide range of capabilities
III R is (widely) supported by the world of science
IV R is supported by the community
V R is (increasingly) supported by the business
VI R is able to read data in many formats
VII Interoperability is easy to achieve
VIII R is truly cross-platform
IX R offers numerous ways of presenting data
X There are many options to optimize the code
XI R is able to handle large amount of data
XII R has a set of fancy tools and IDEs
XII FDA accepted using R for drug trials!

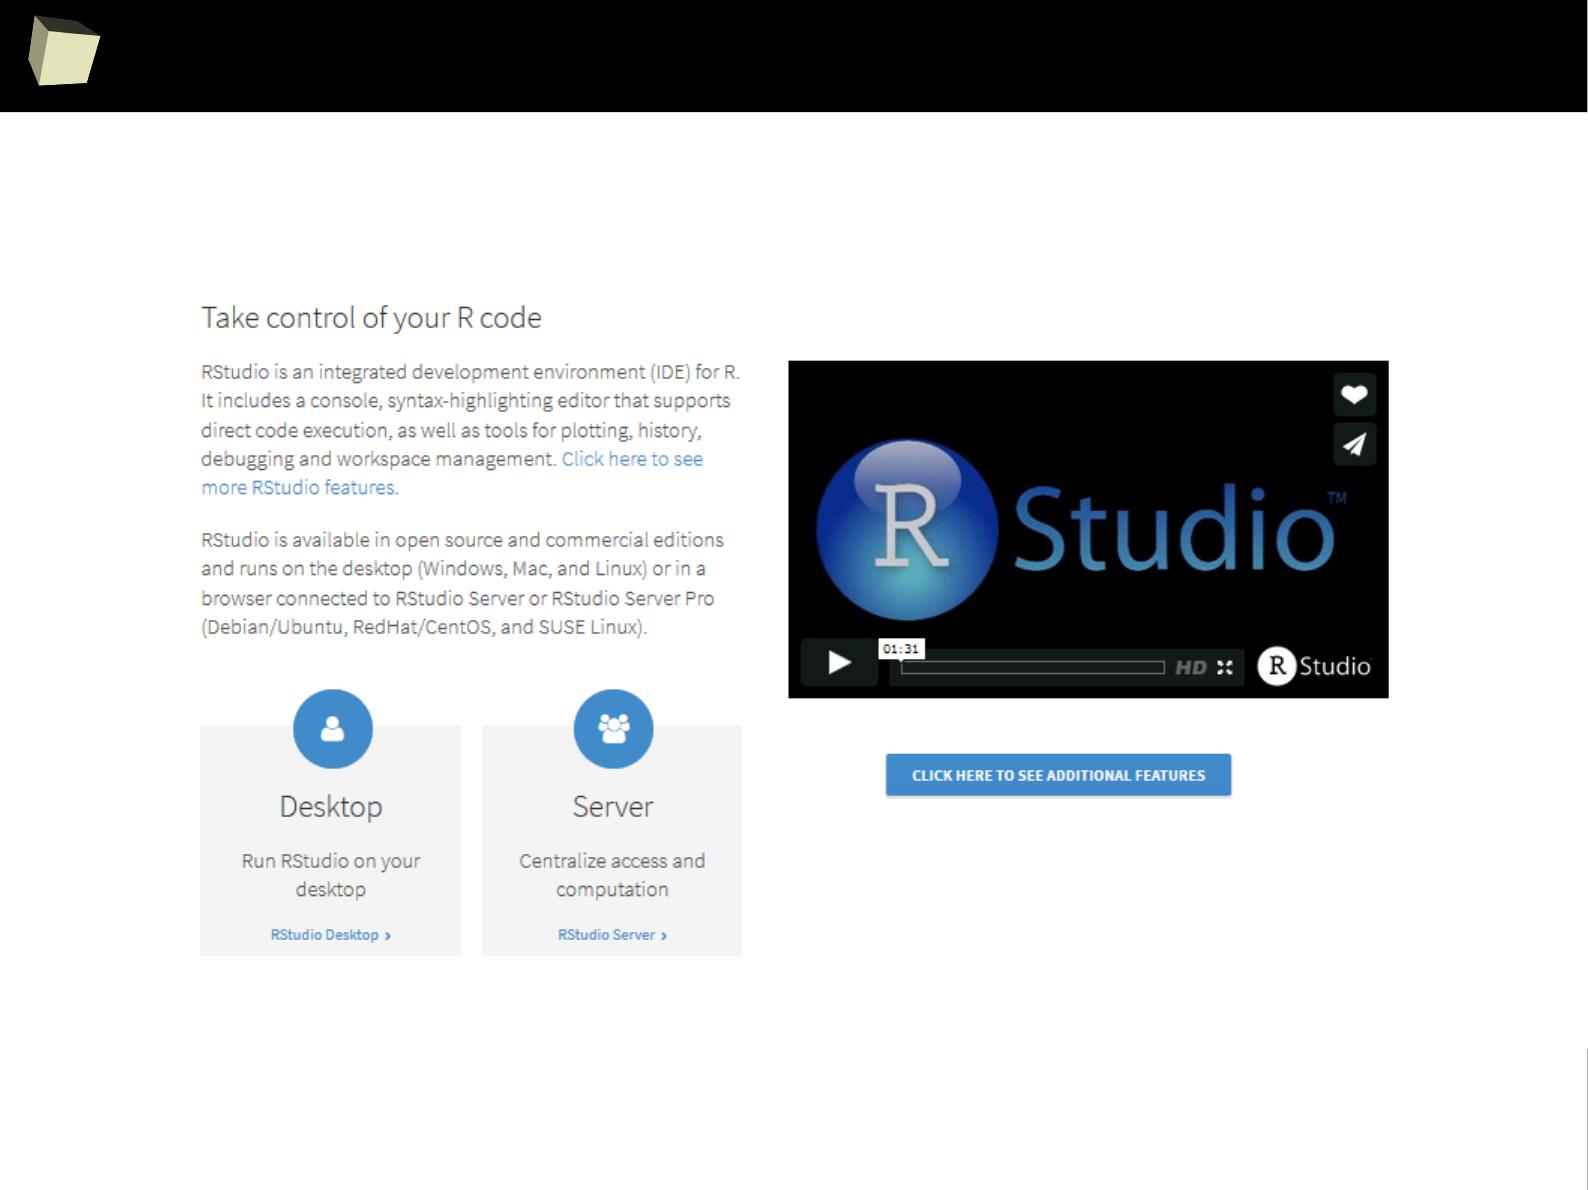
2
9
5
RStudio
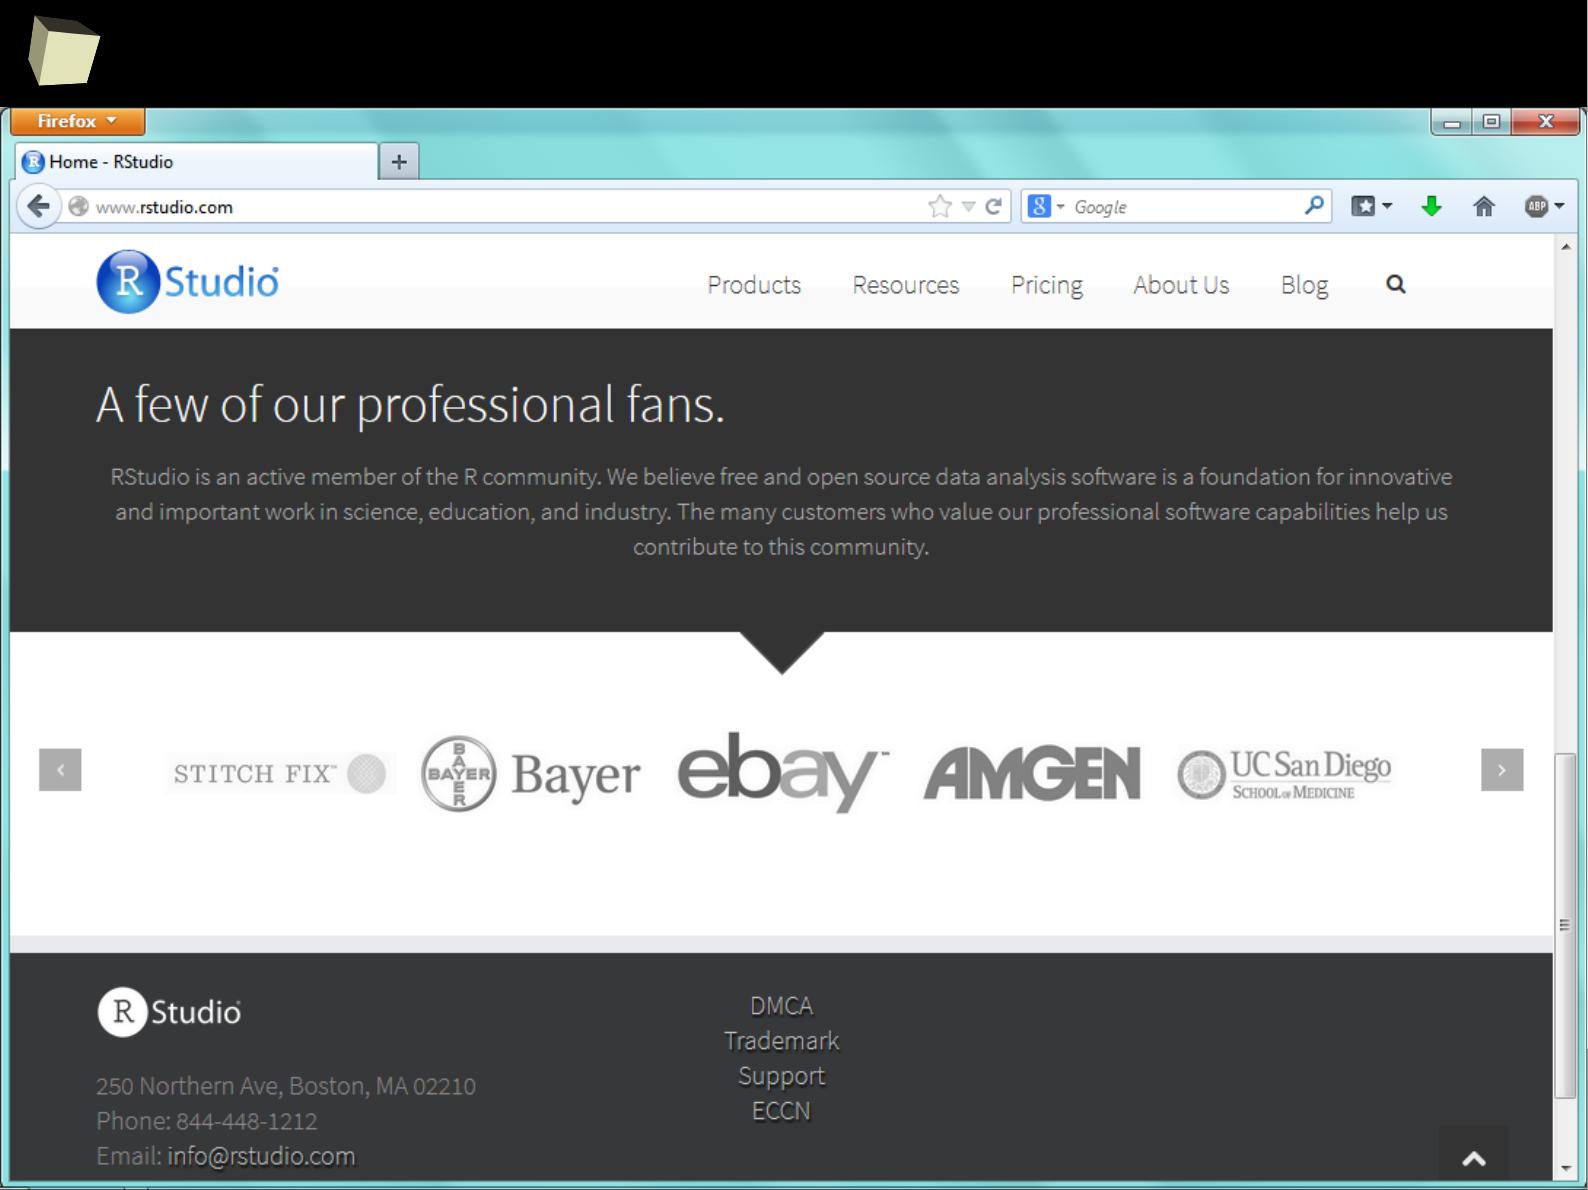
2
9
6
RStudio
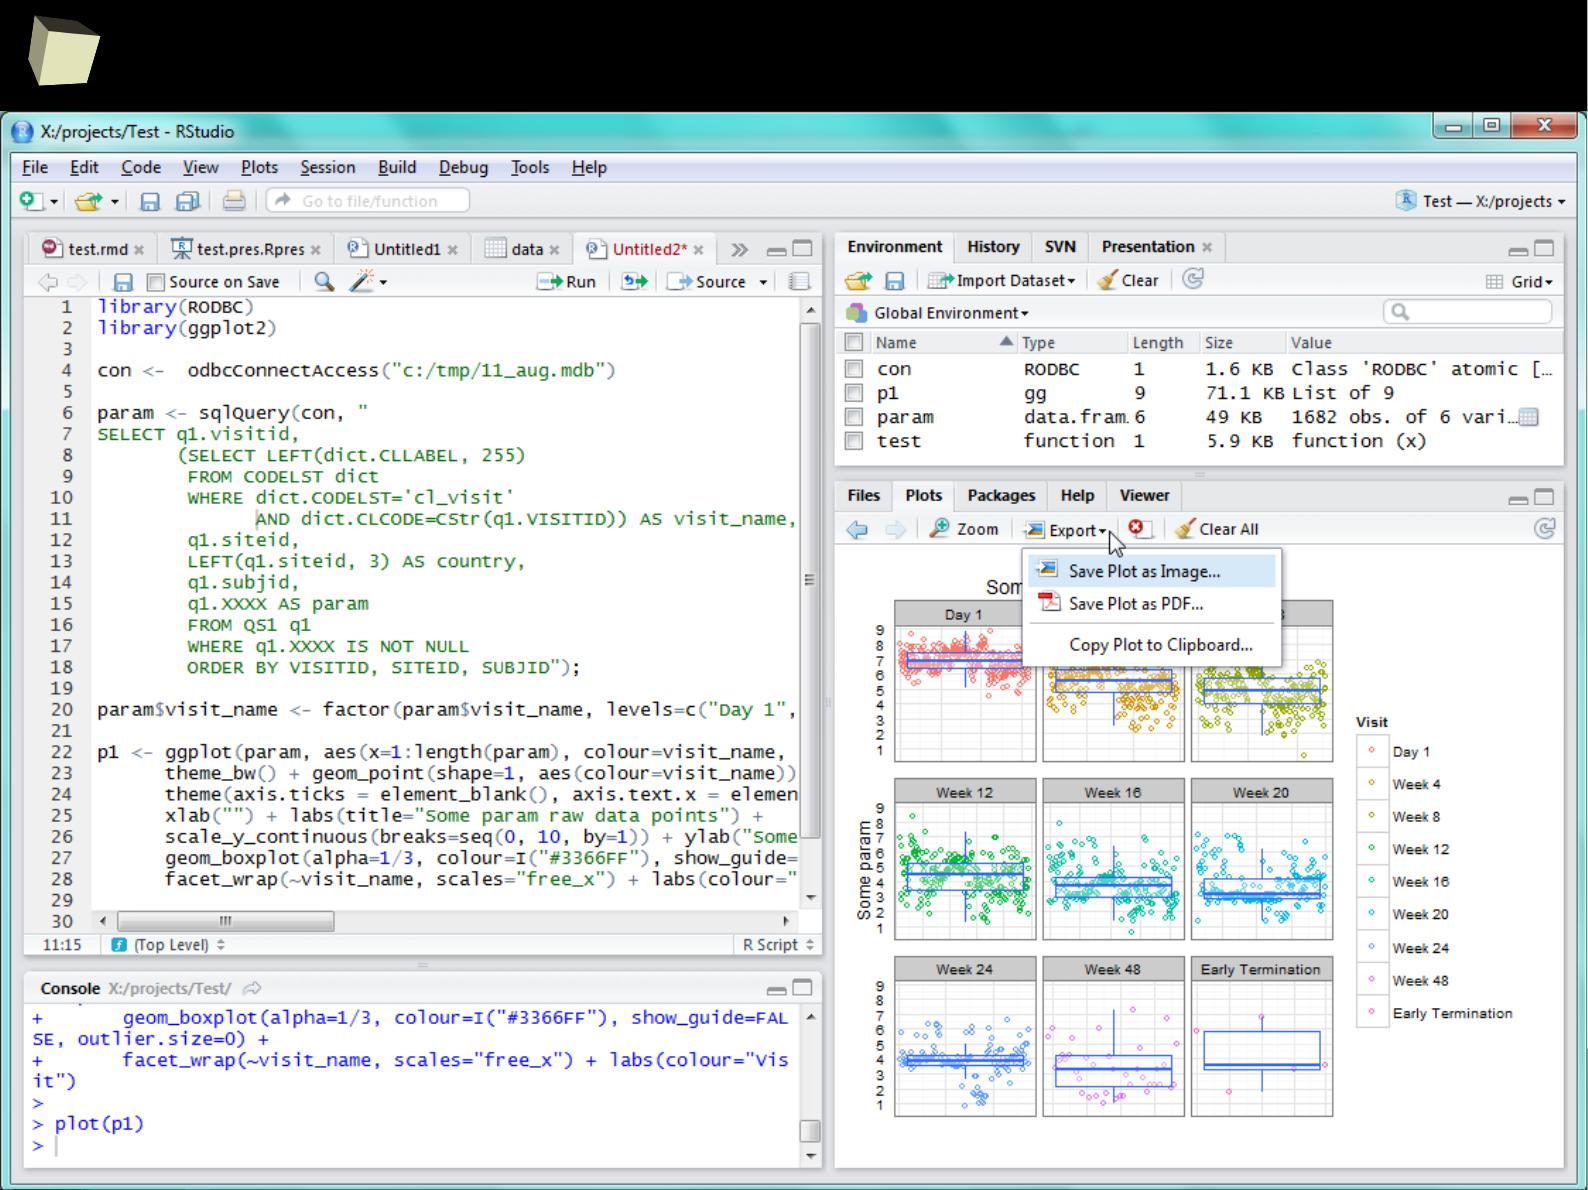
2
9
7
RStudio
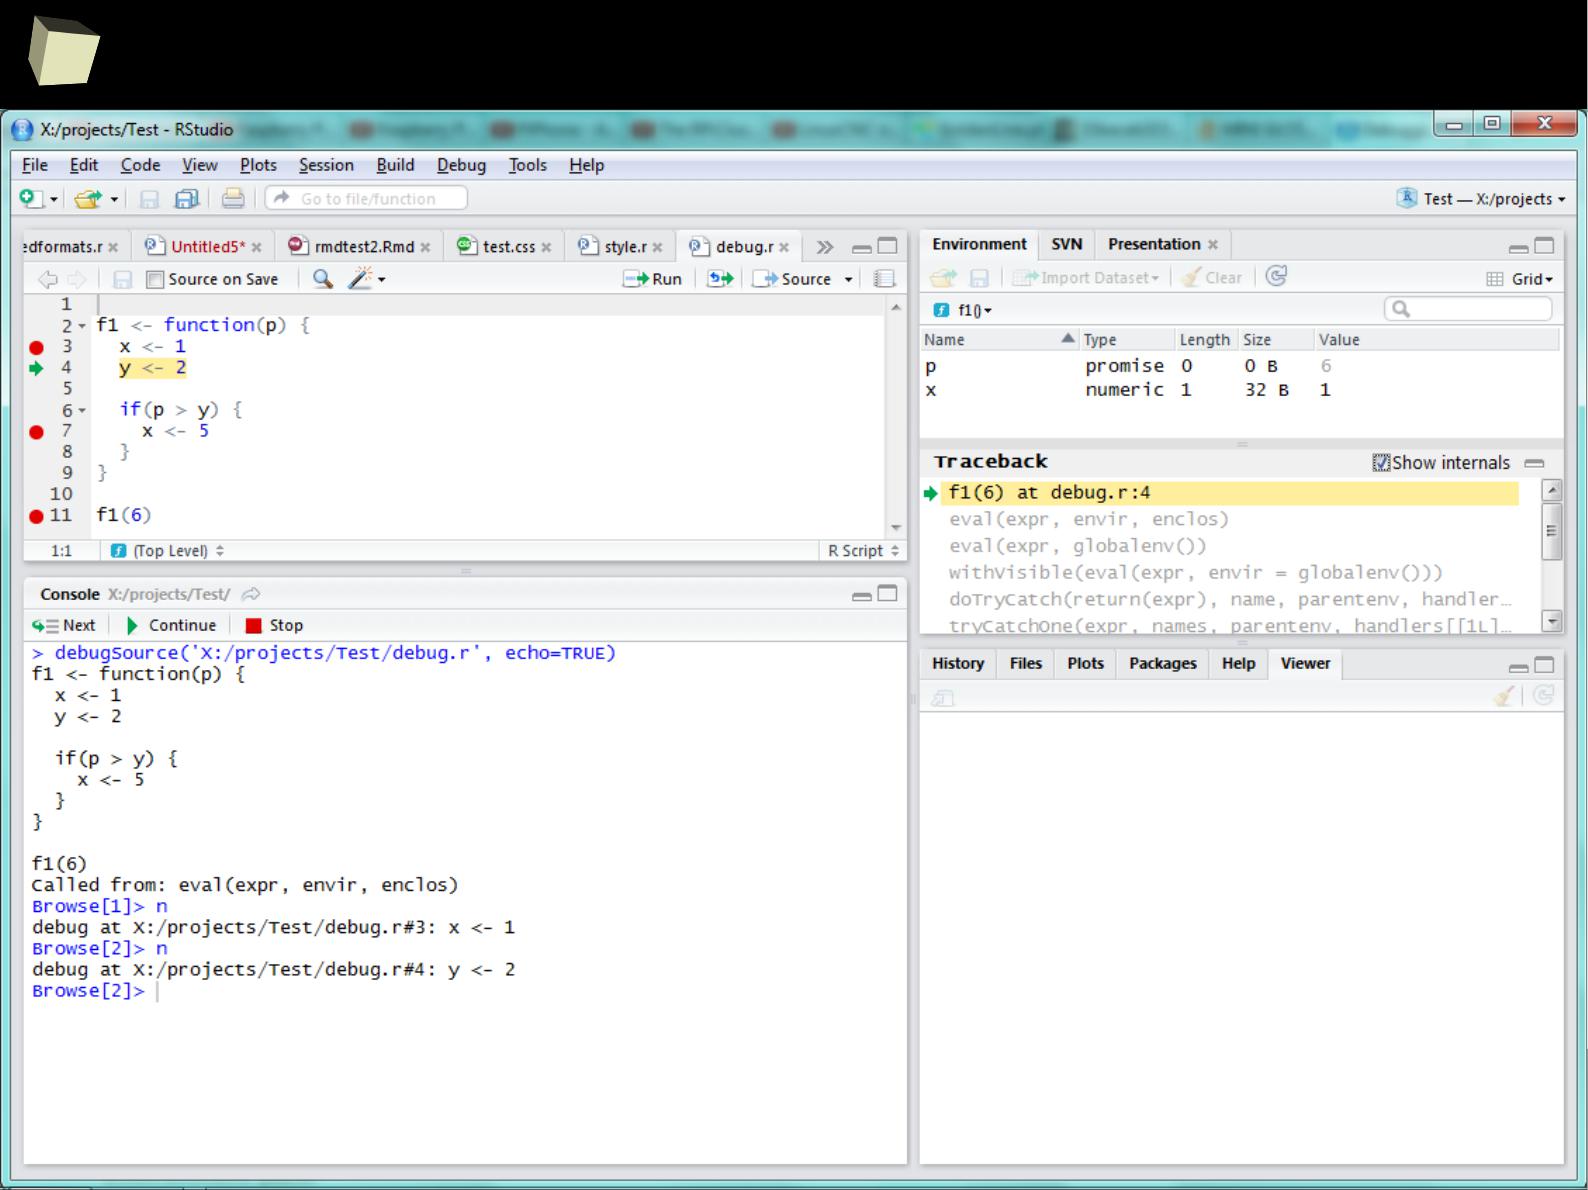
2
9
8
RStudio – debugging
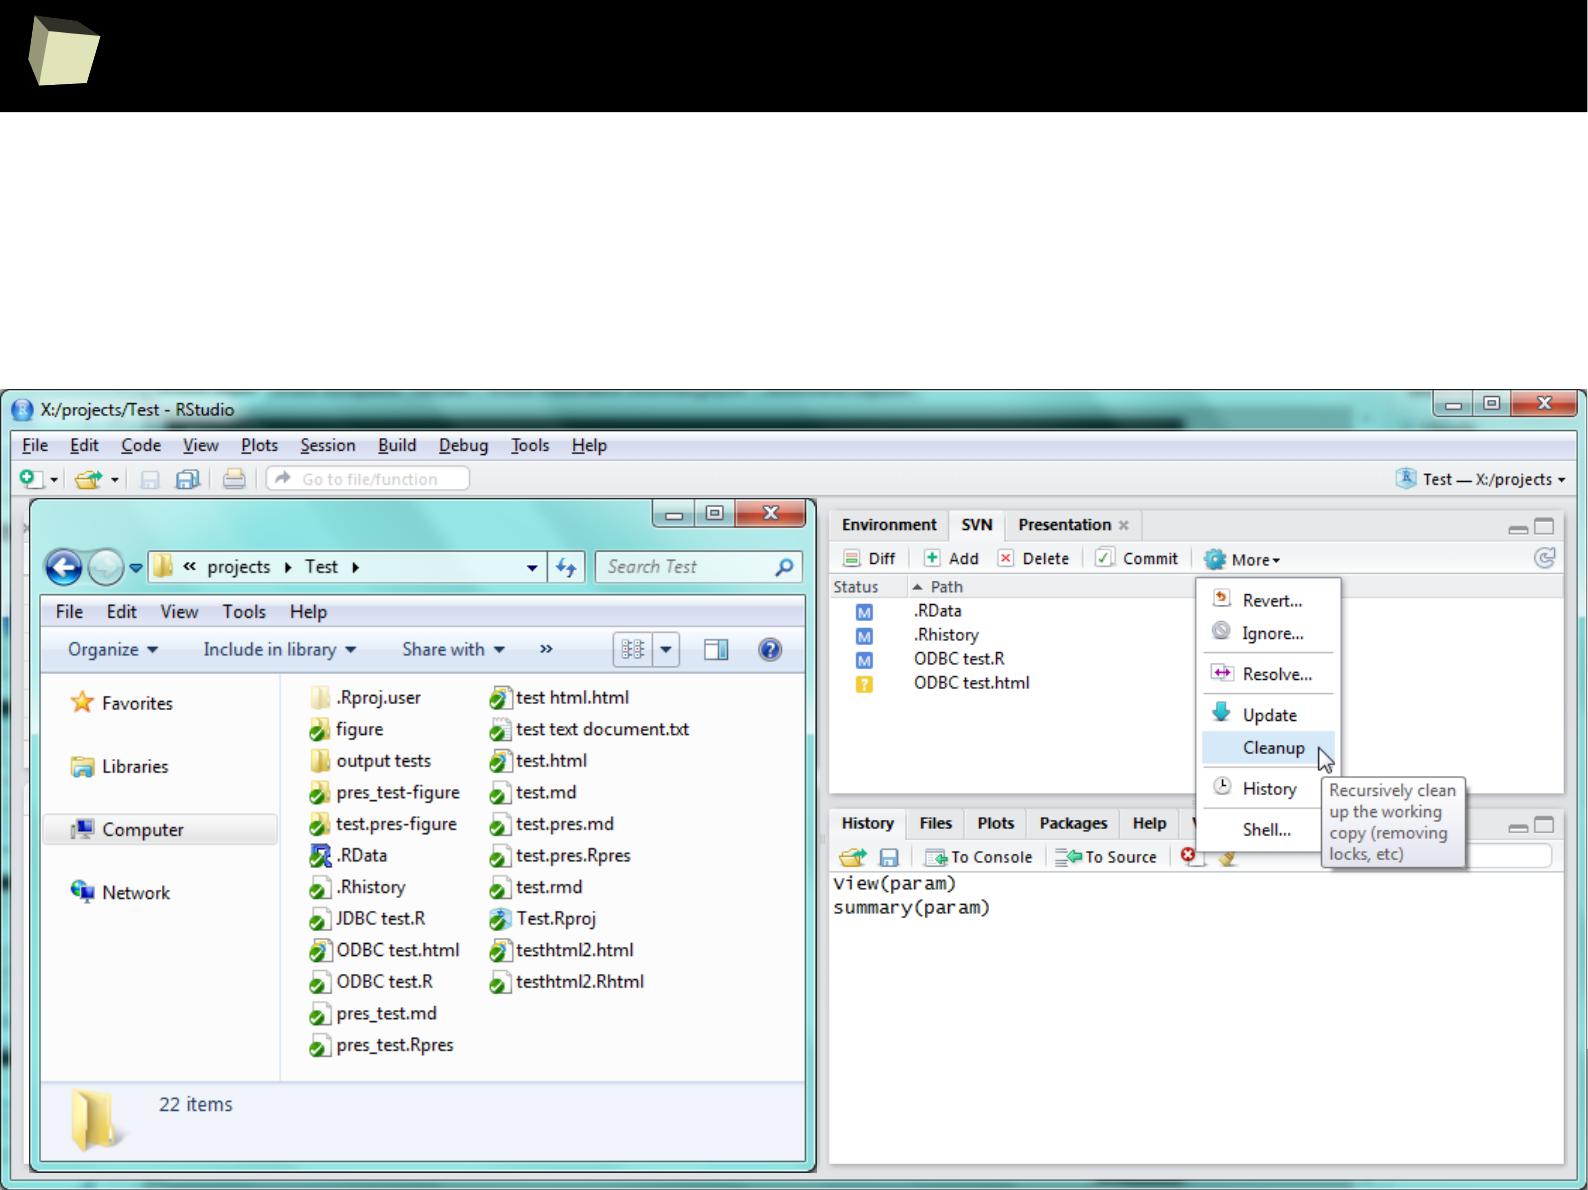
2
9
9
RStudio – version control
RStudio integrates seamlessly with version control systems like Git or
Subversion (SVN). Version control is one of the major requirements for
documentation management in clinical research.
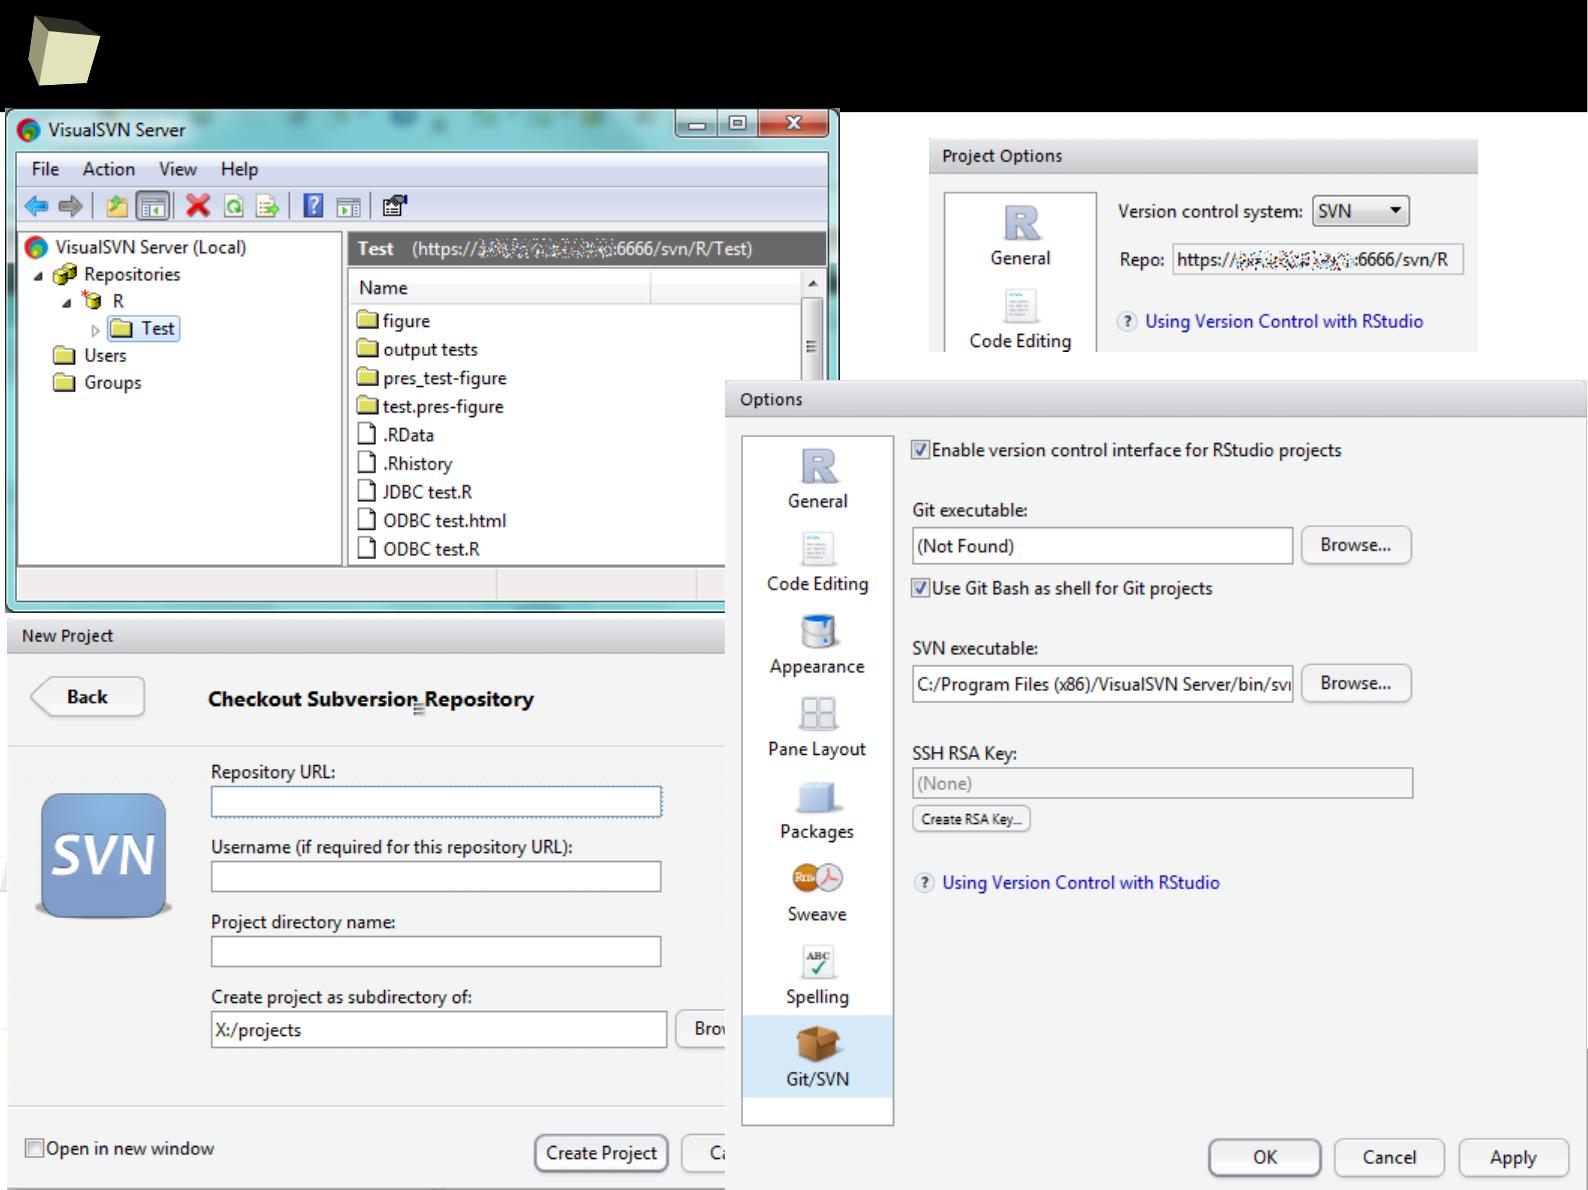
3
0
0
RStudio – version control
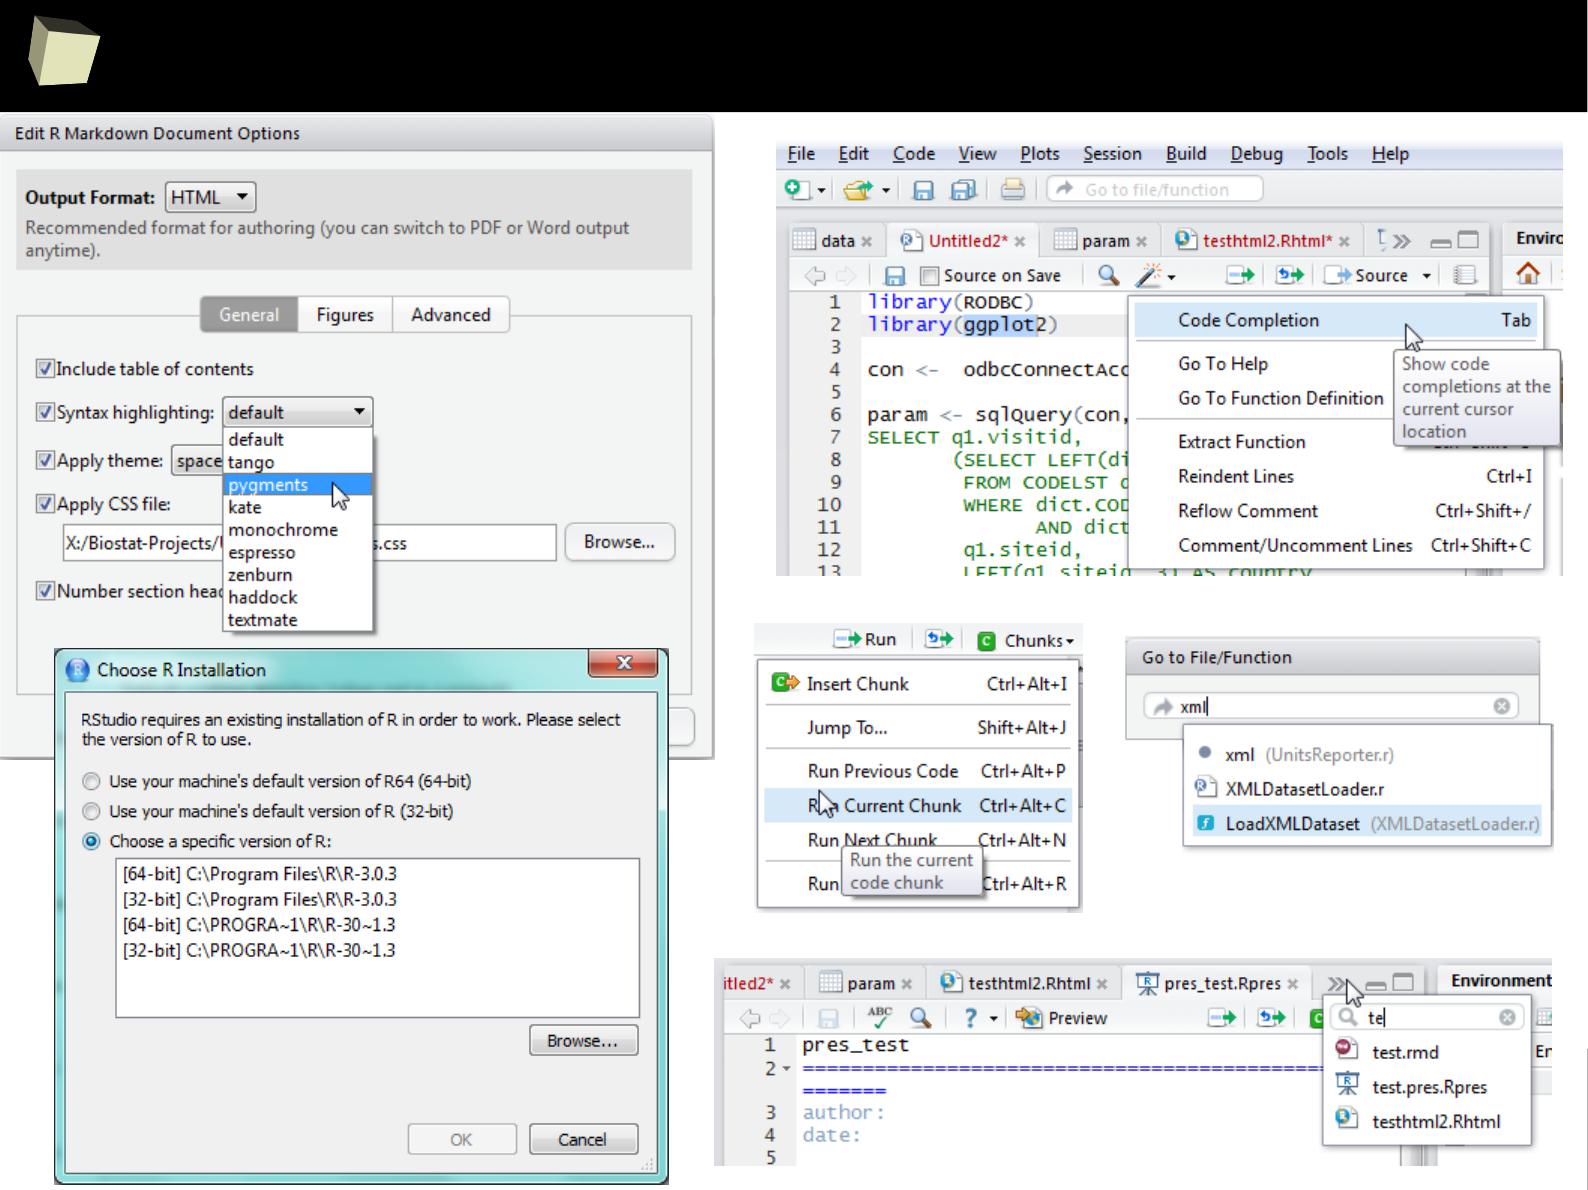
3
0
1
RStudio – some taste...
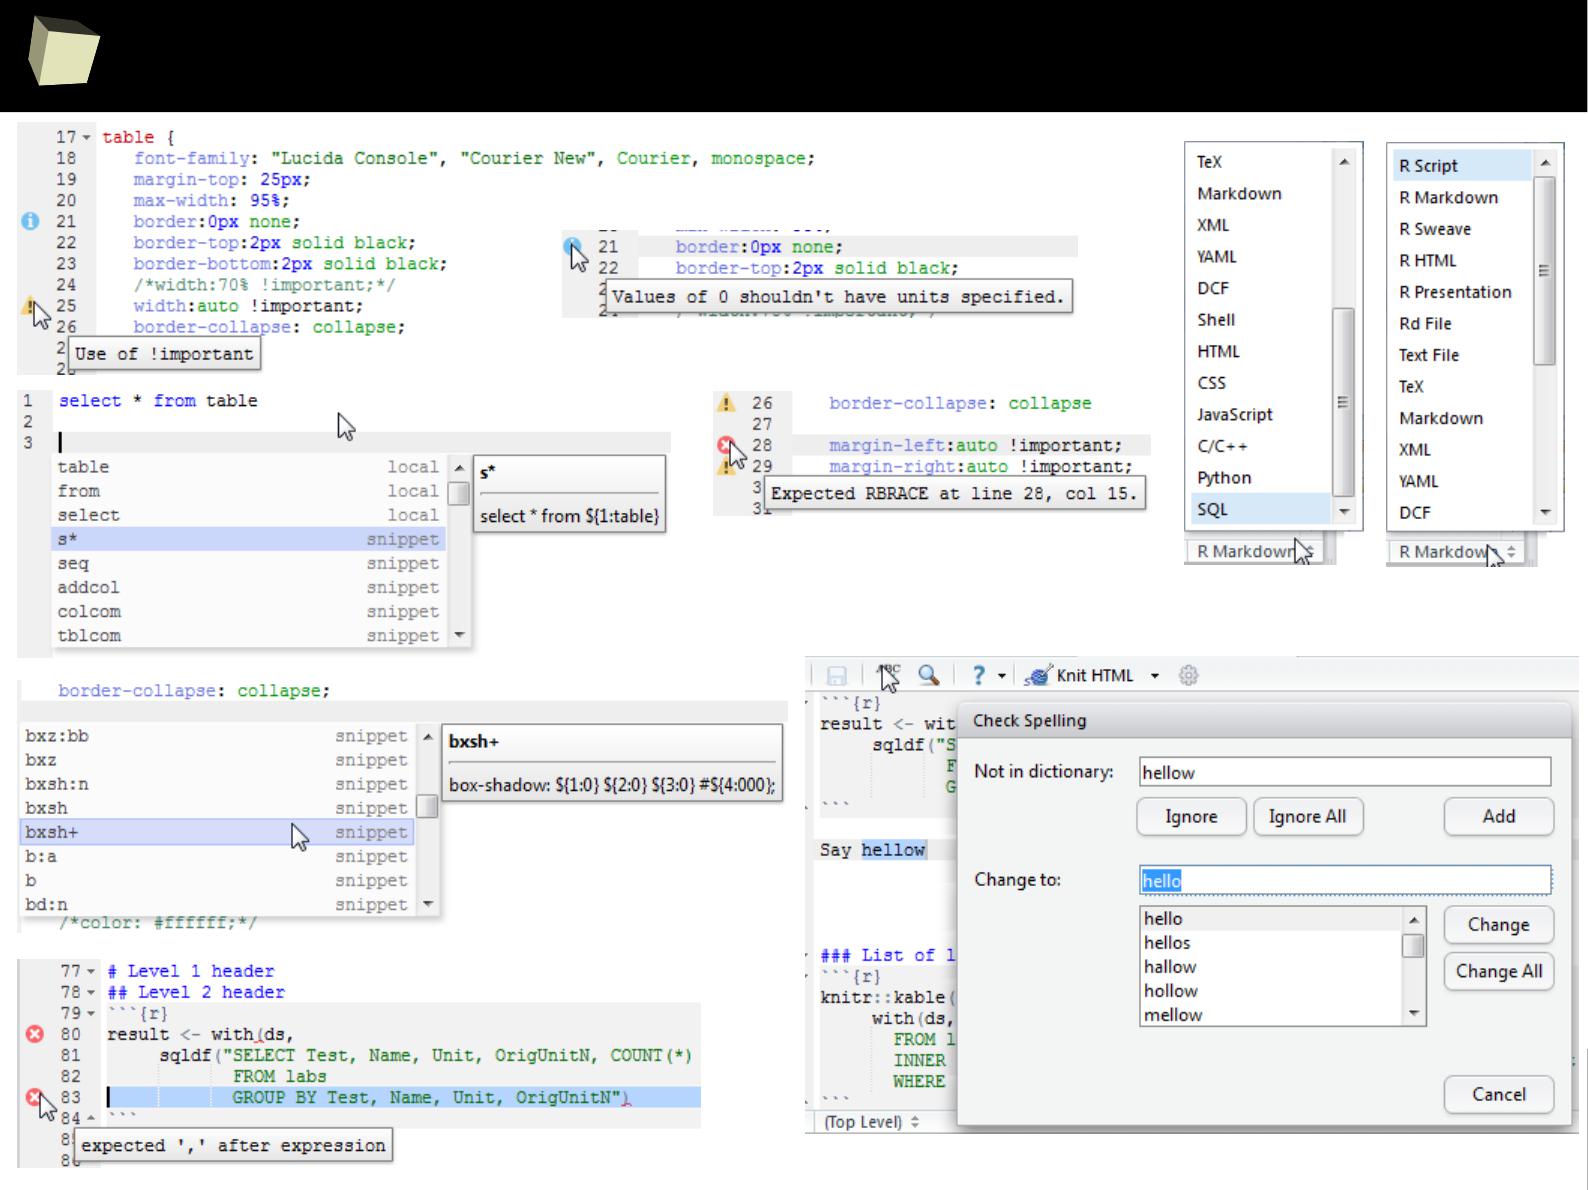
3
0
2
RStudio – syntax and validation
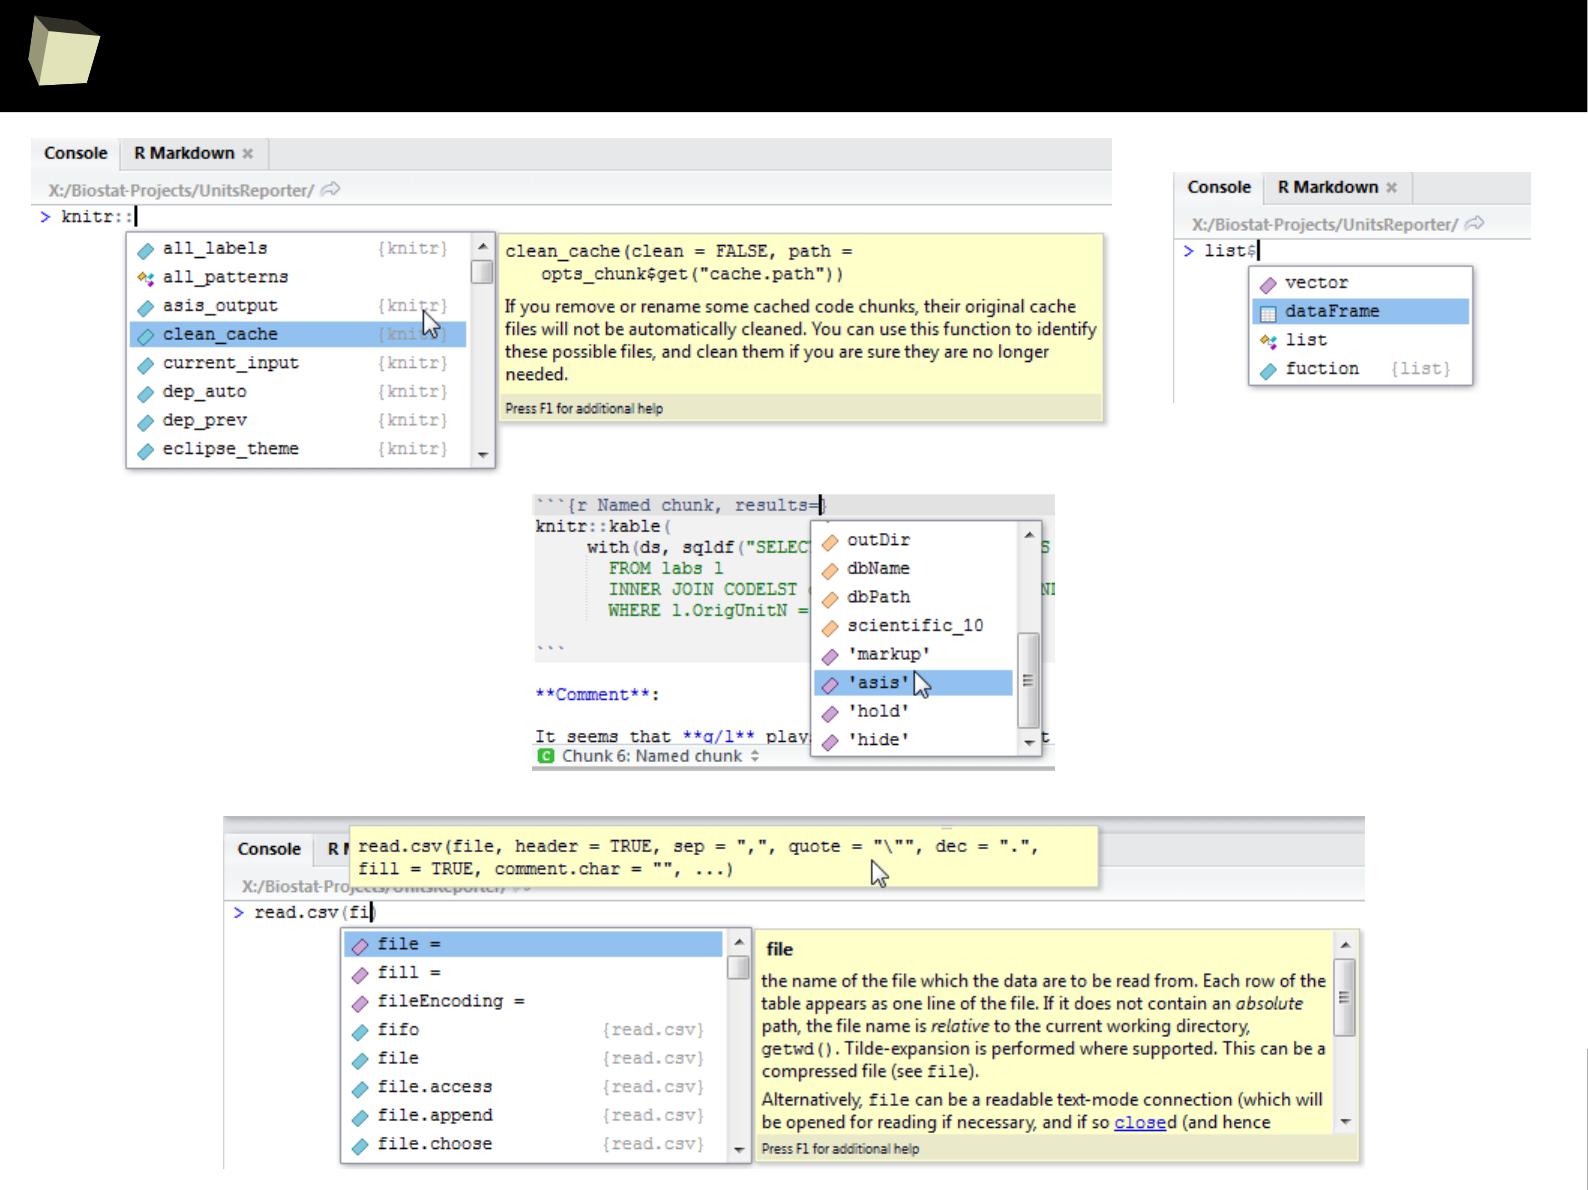
3
0
3
RStudio - autocompletion
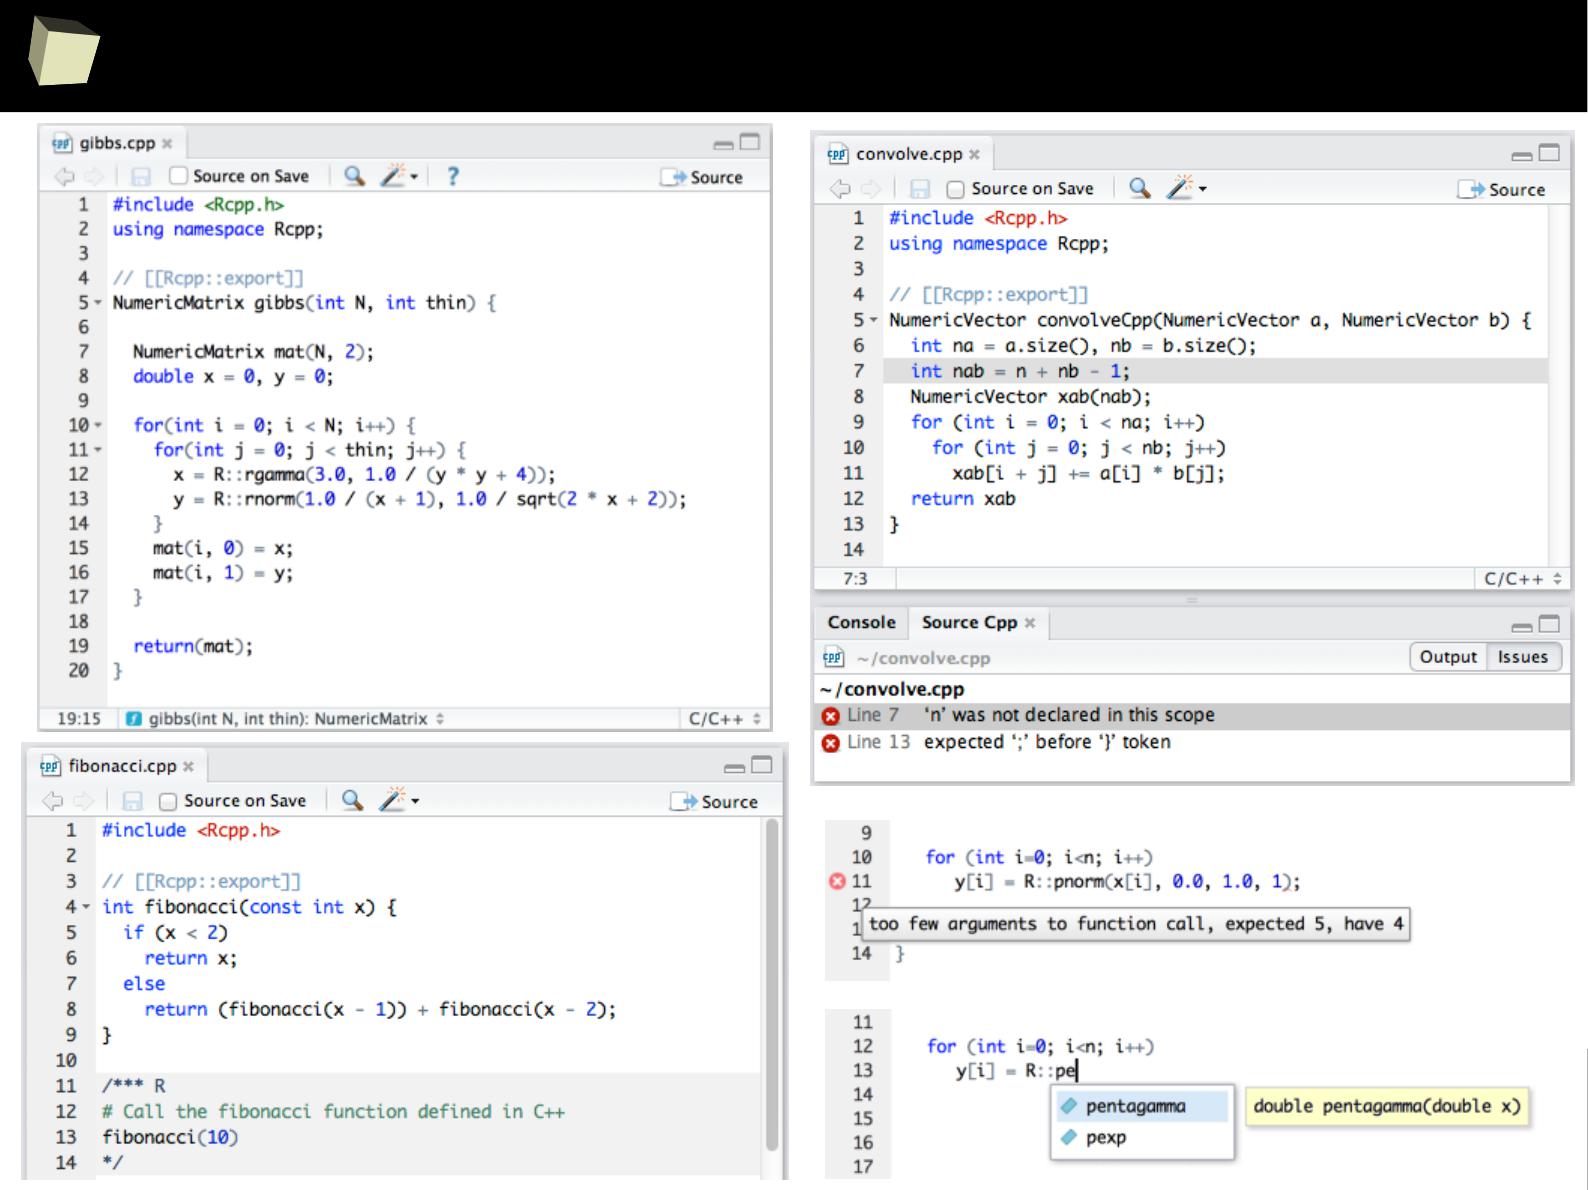
3
0
4
RStudio – support for Rcpp
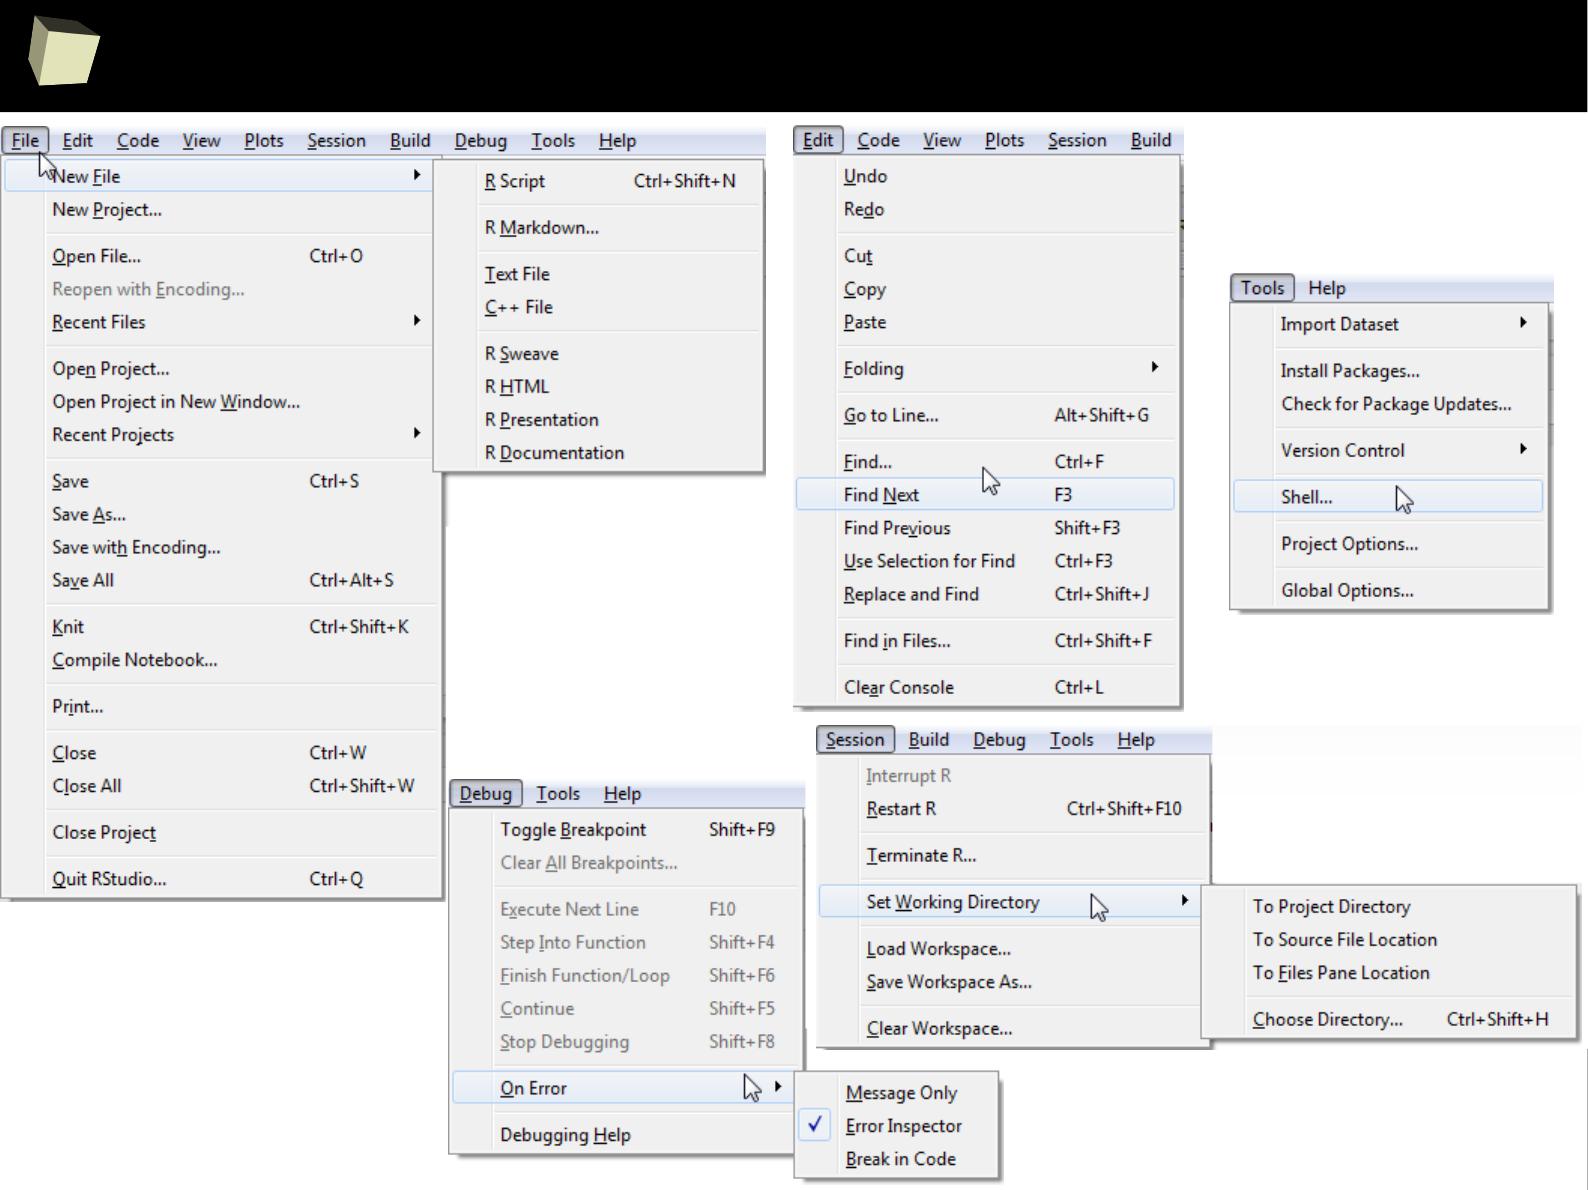
3
0
5
RStudio - menu
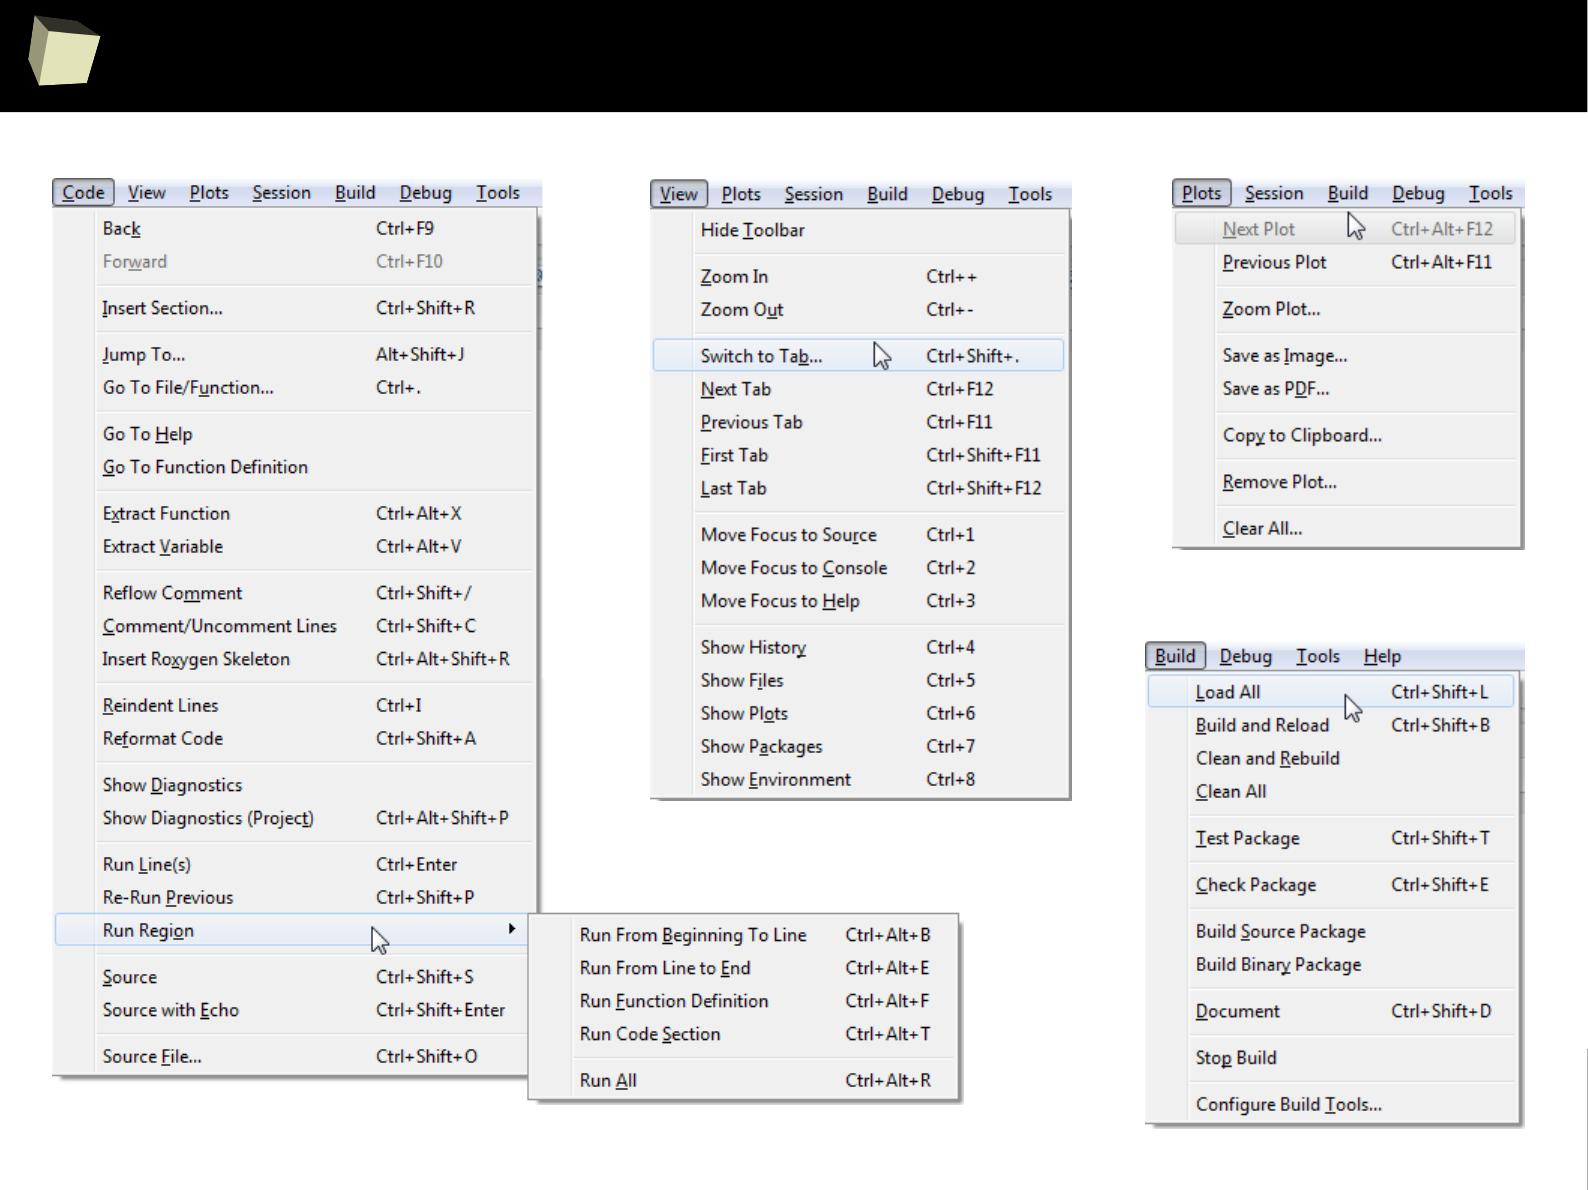
3
0
6
RStudio - menu
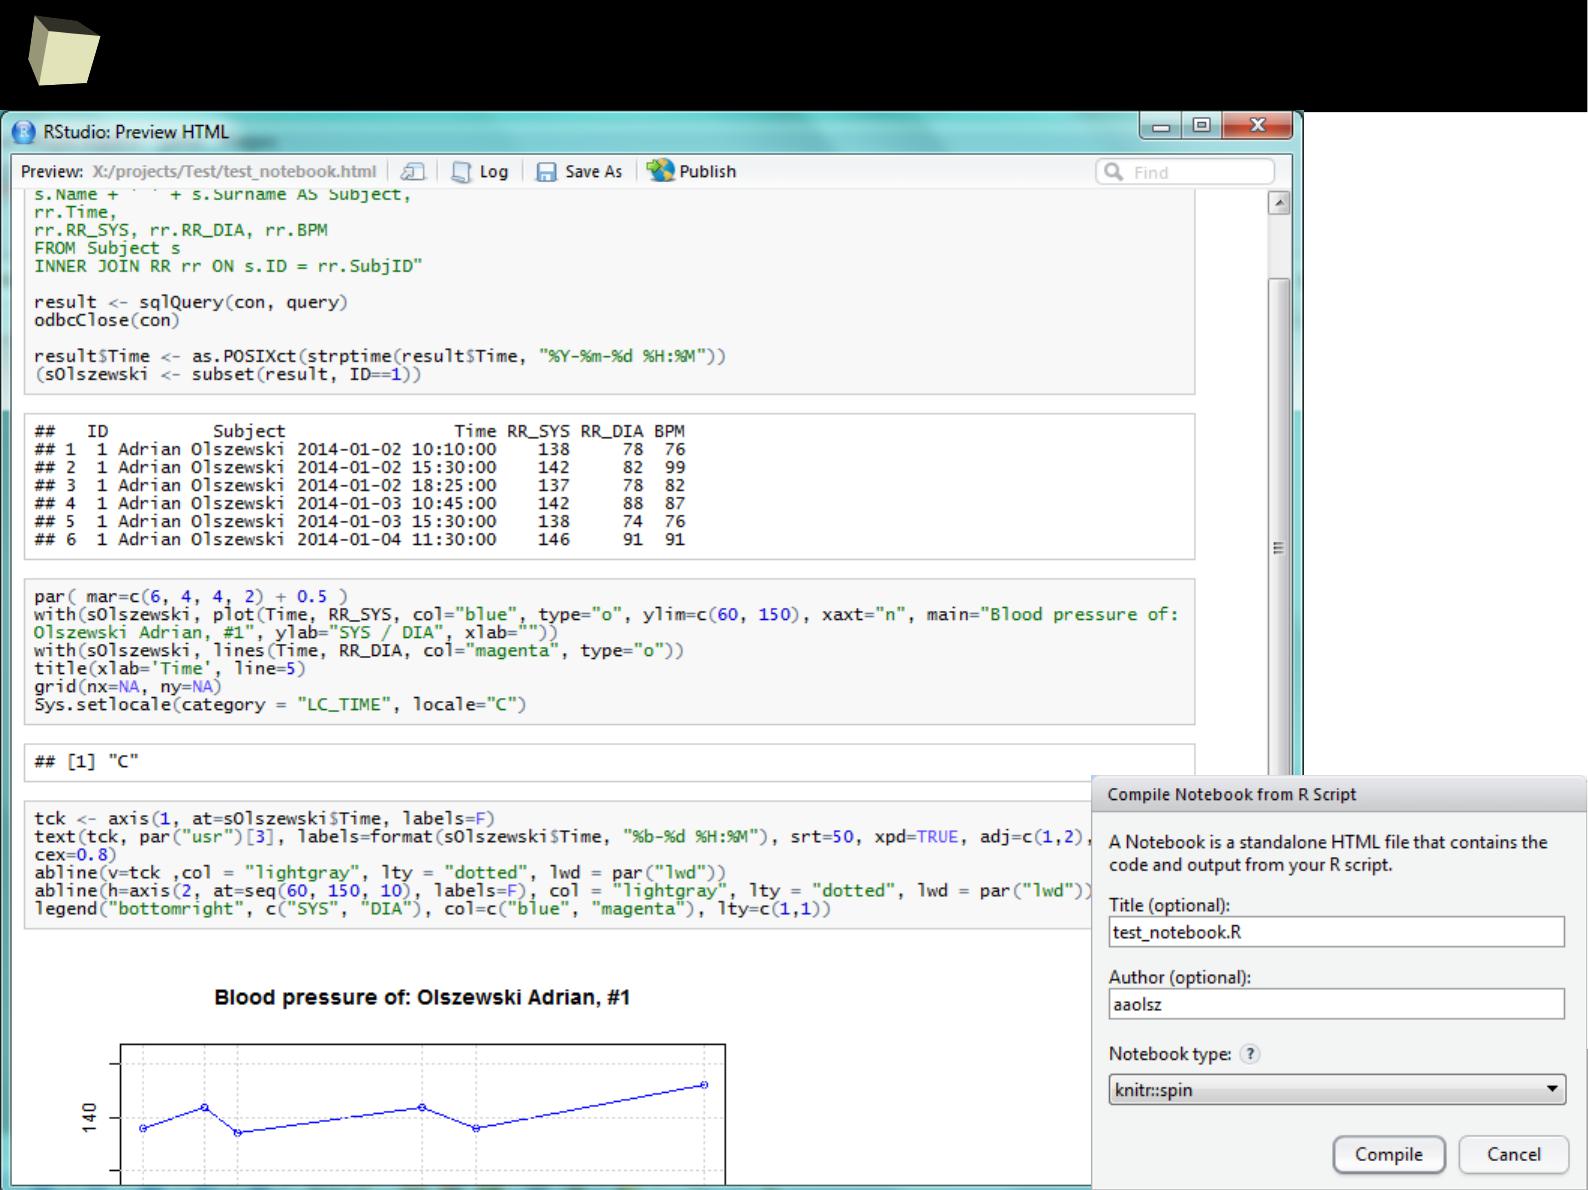
3
0
7
RStudio – the notebook (RMarkdown)
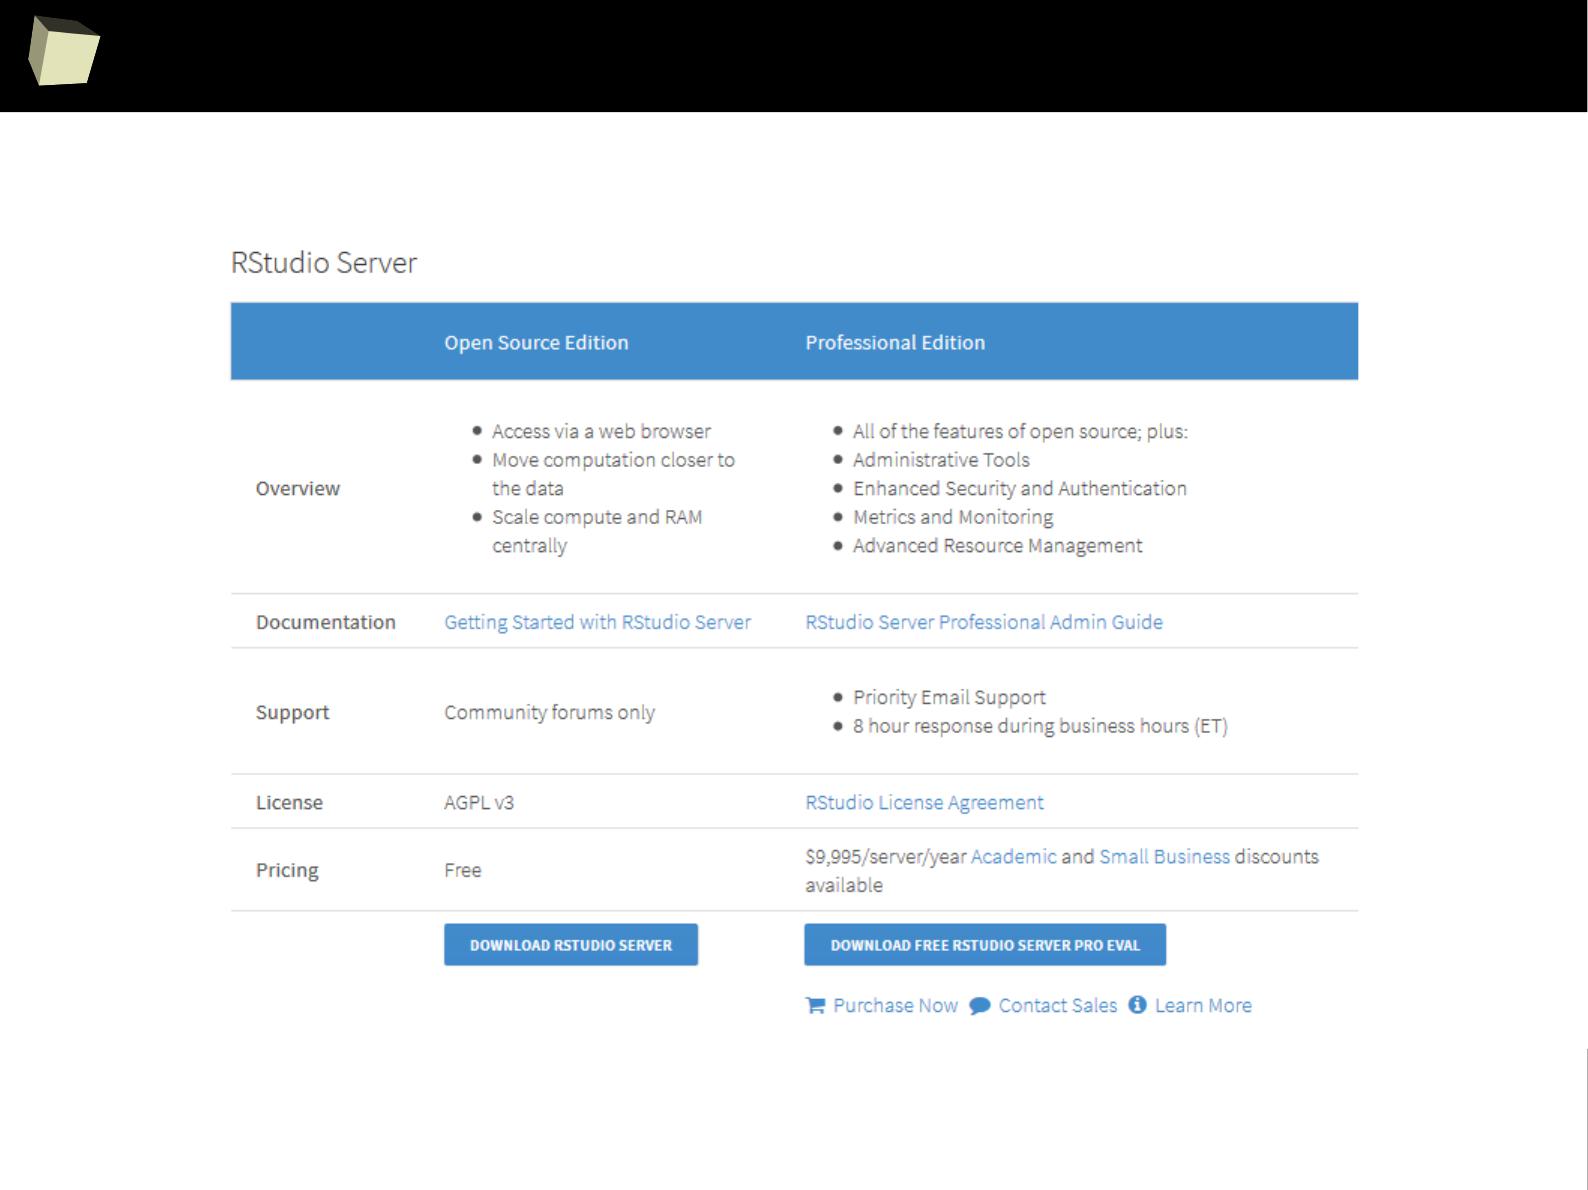
3
0
8
RStudio Server
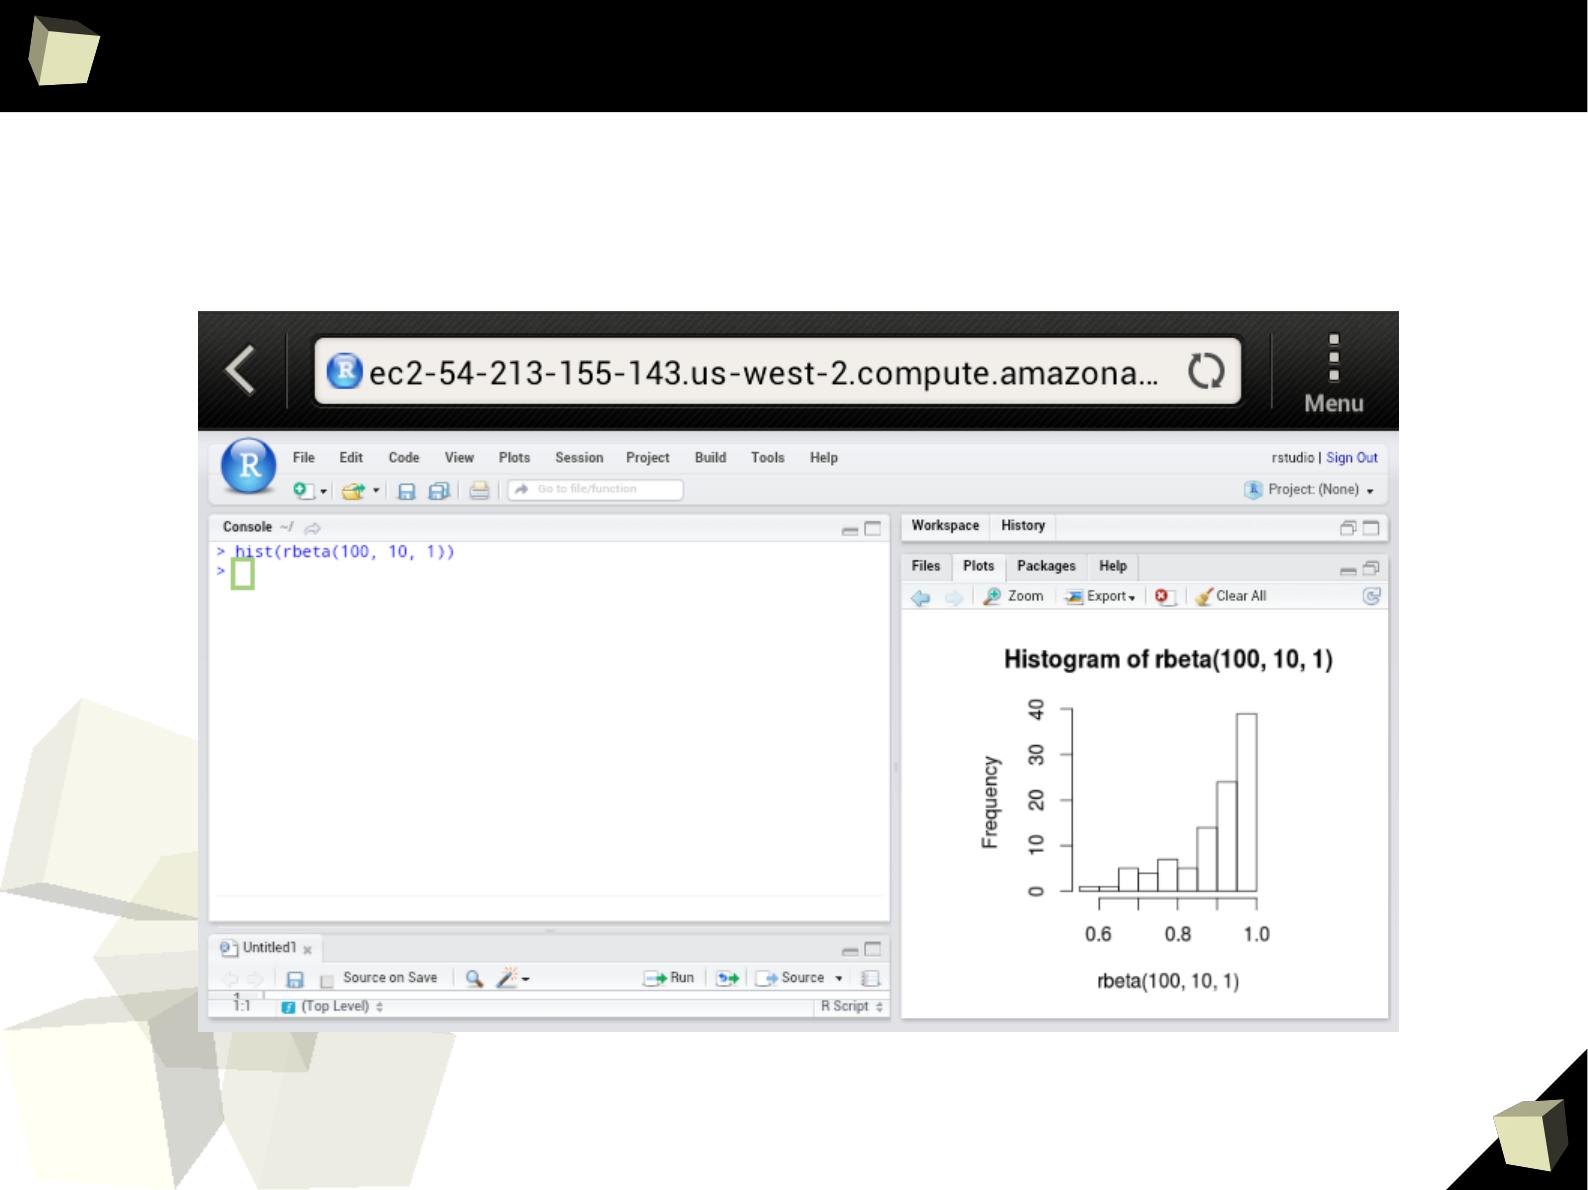
3
0
9
RStudio Server
On my... pocket HTC :)
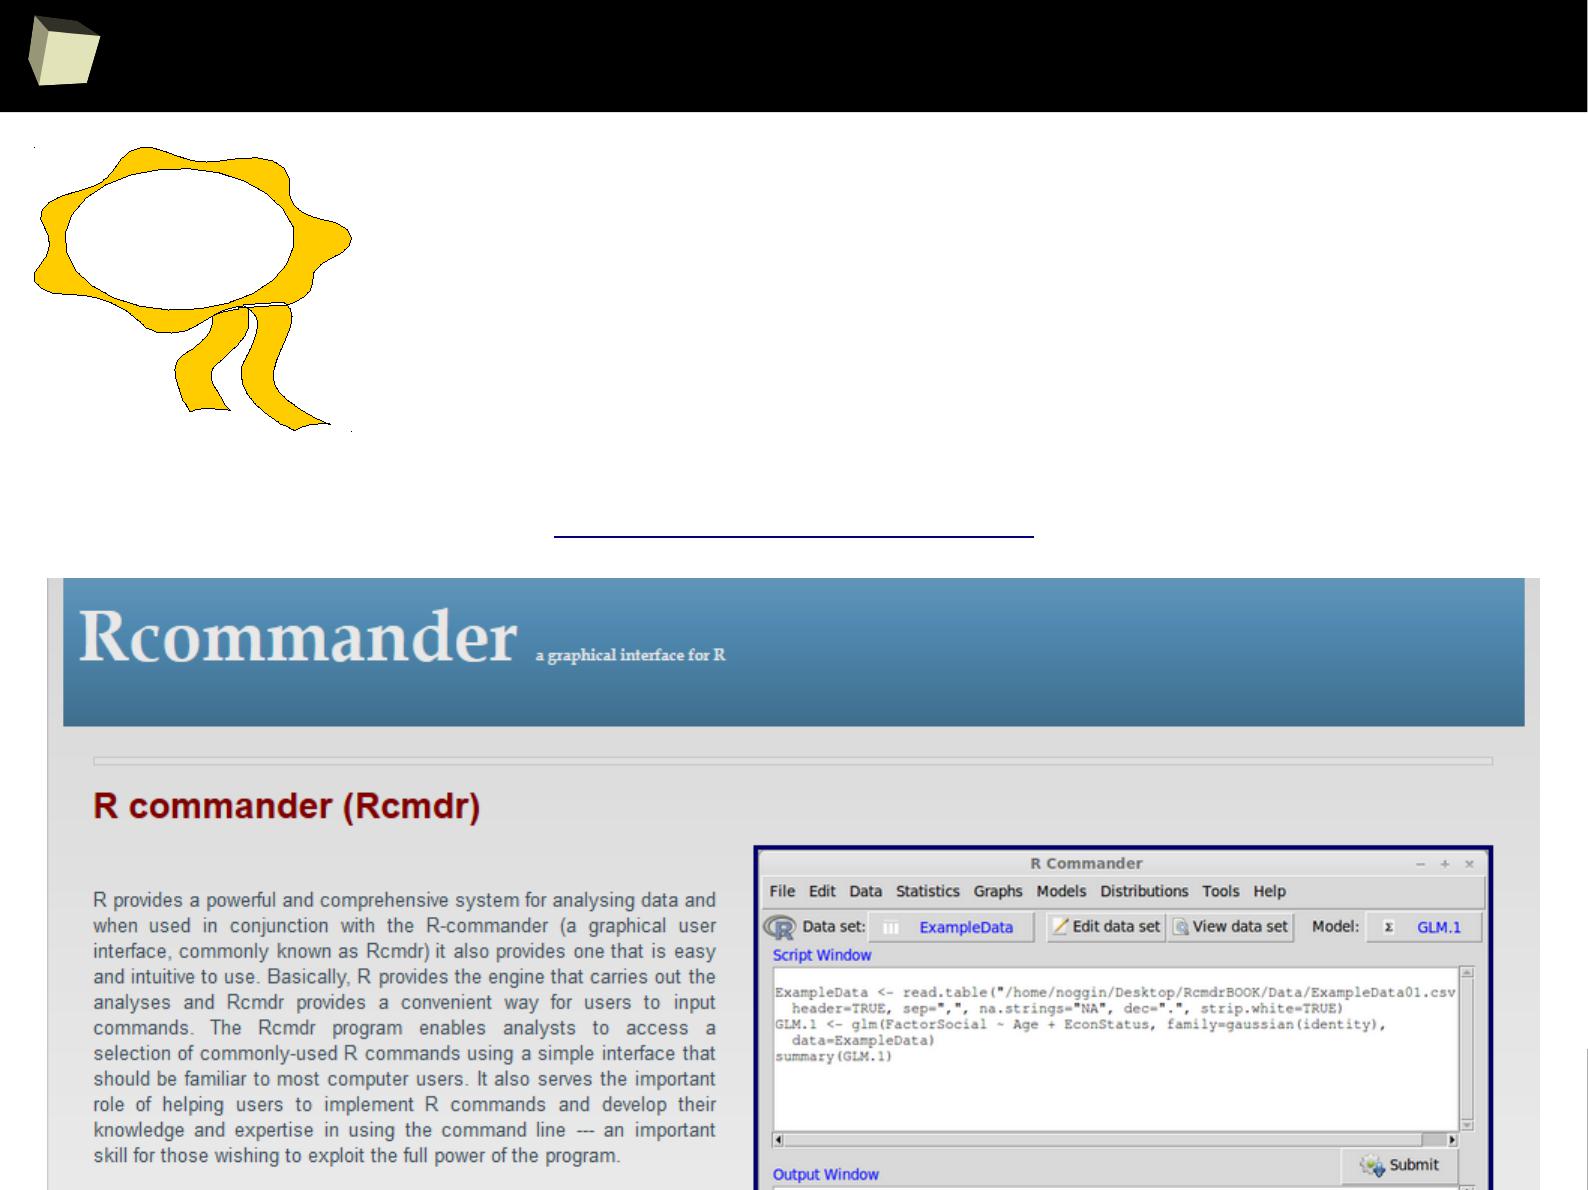
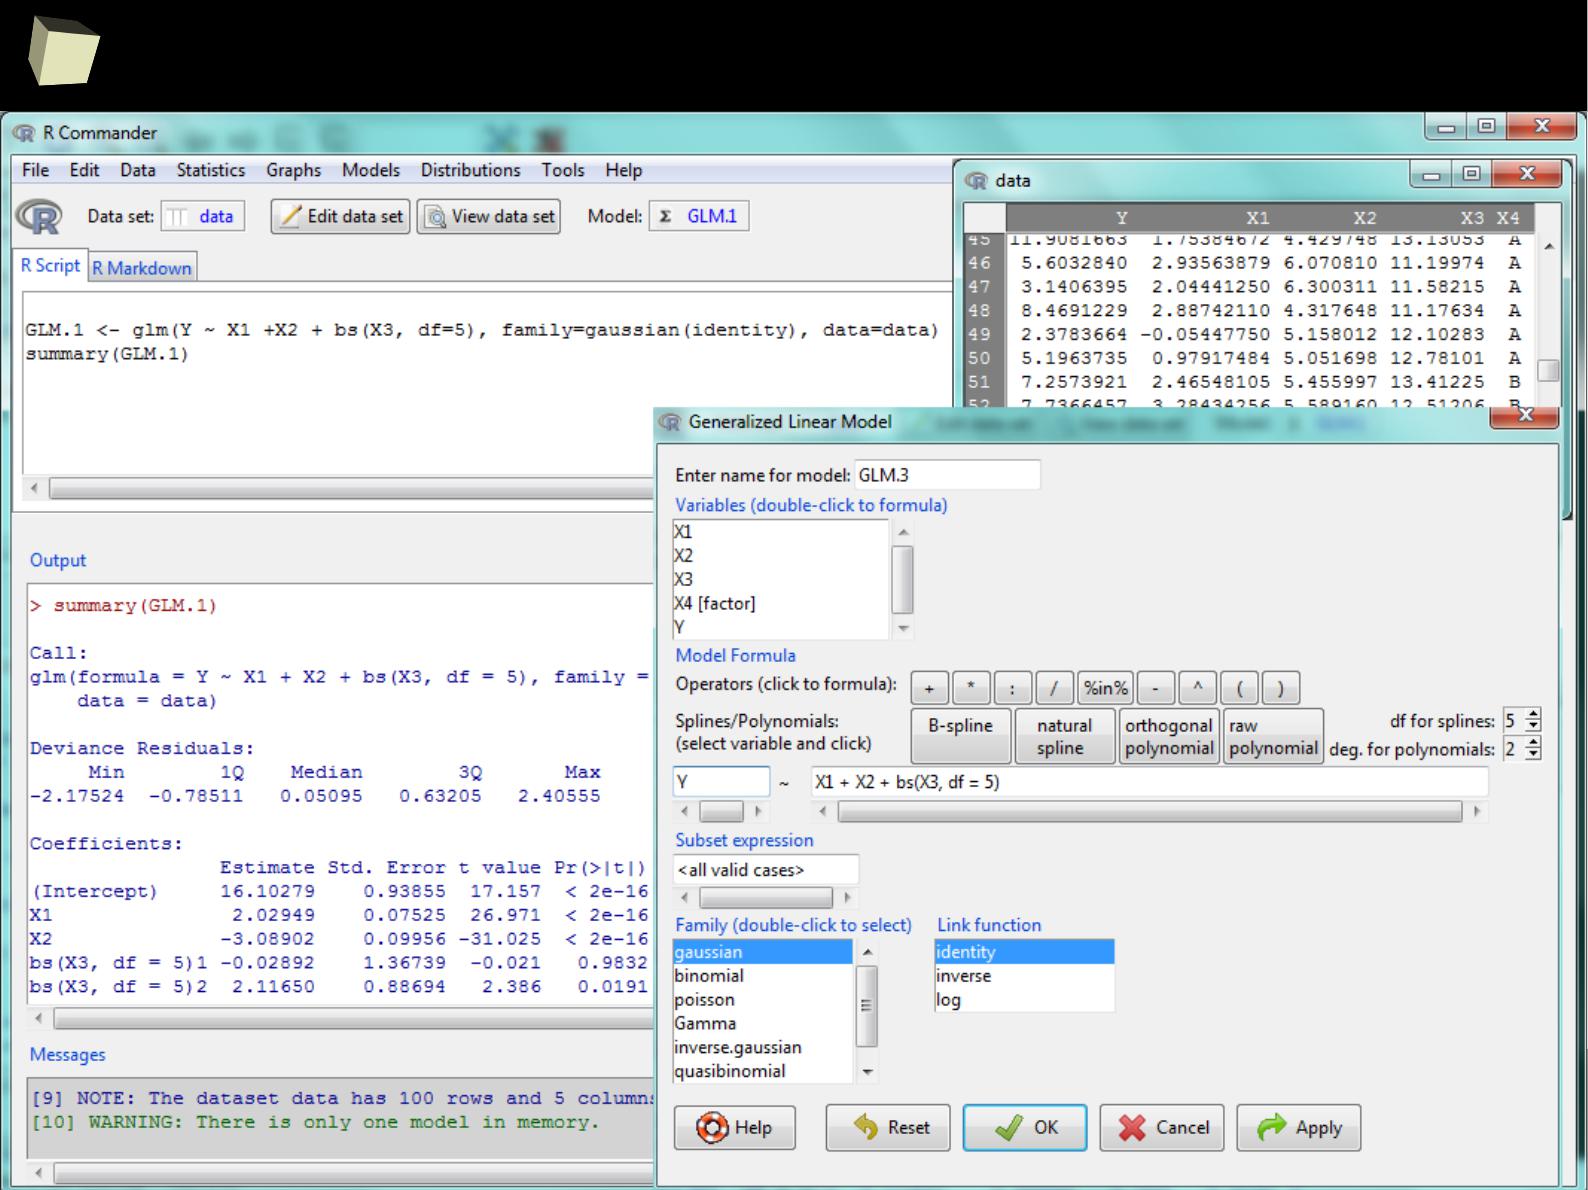
3
1
1
RCommander
`
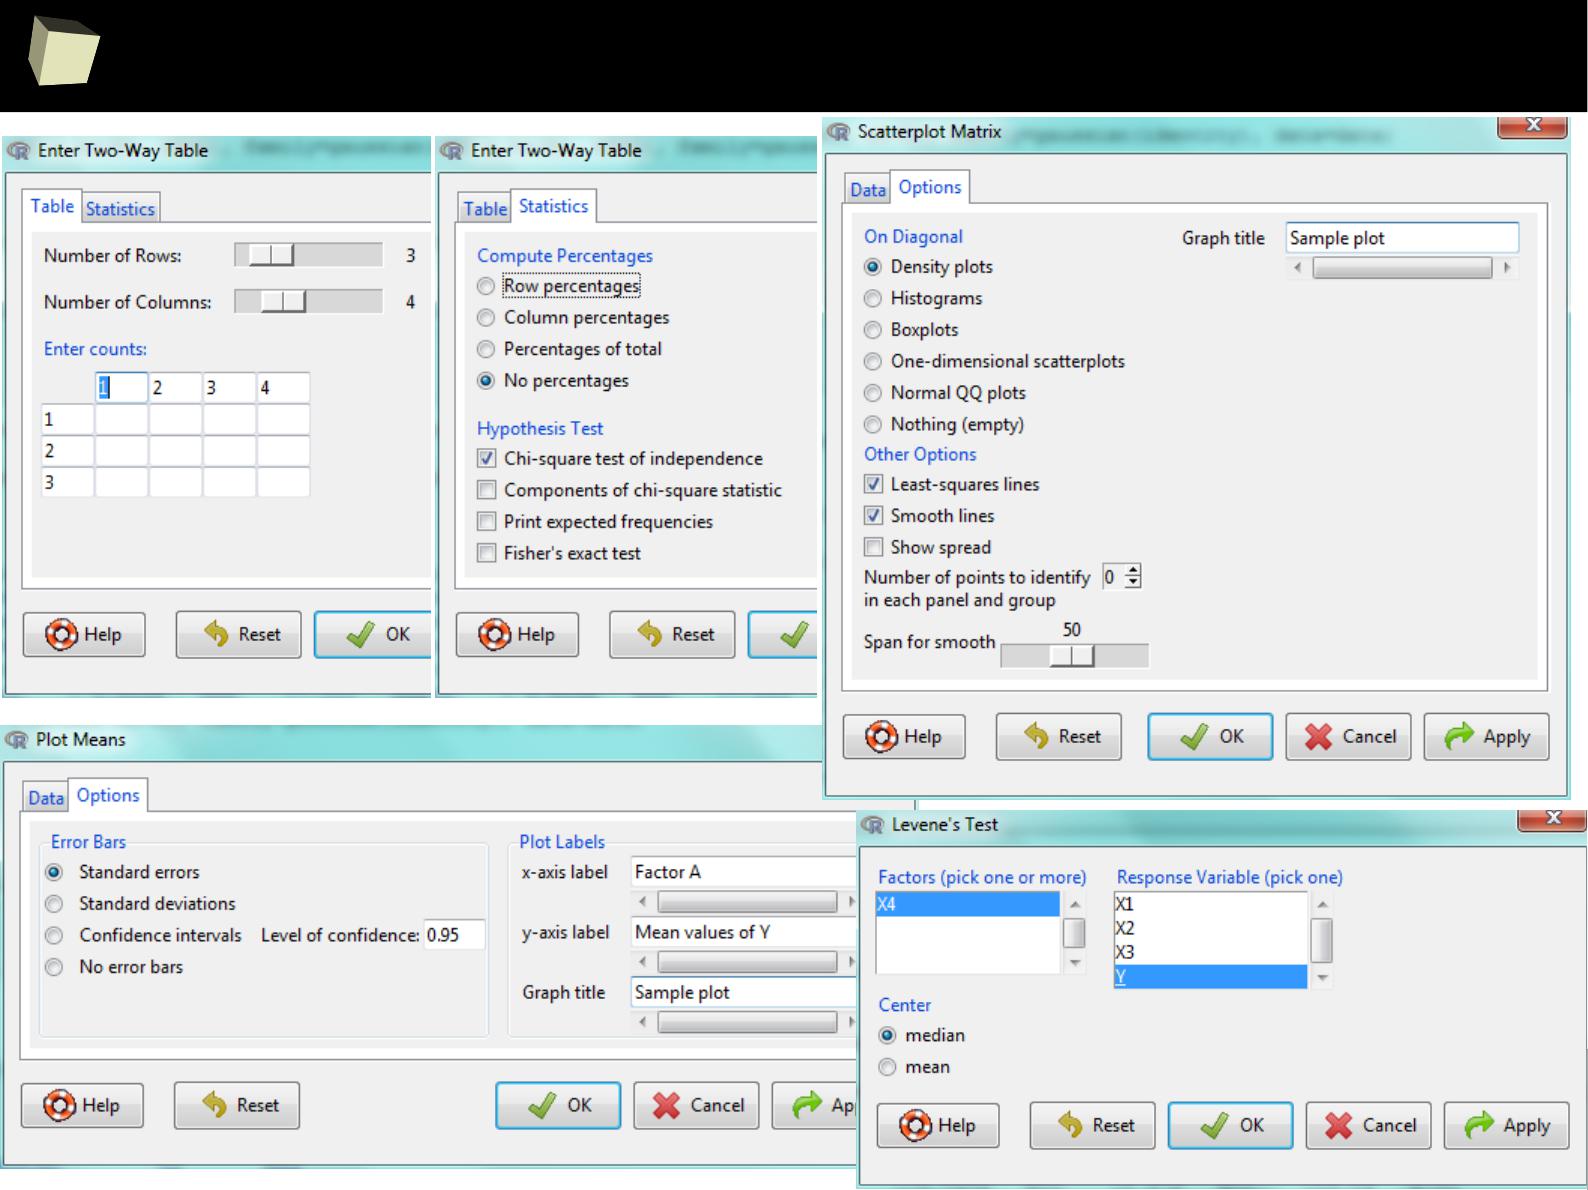
3
1
2
RCommander
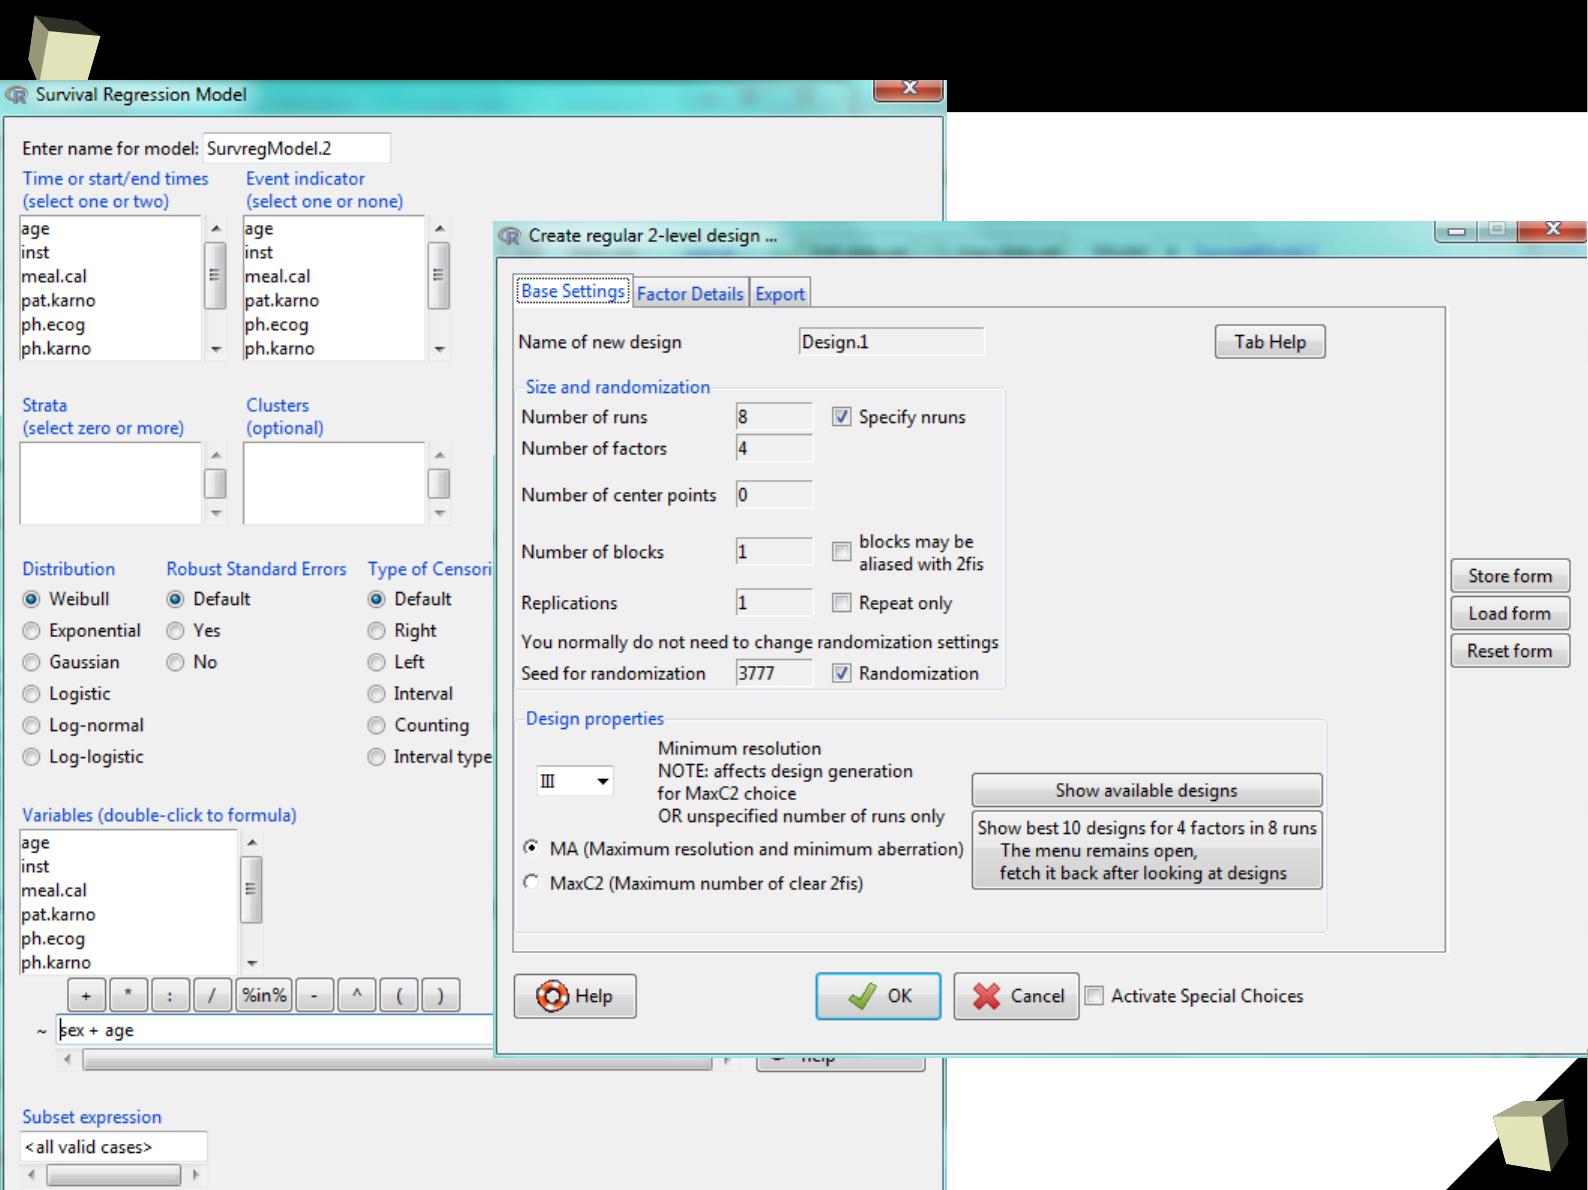
3
1
3
RCommander
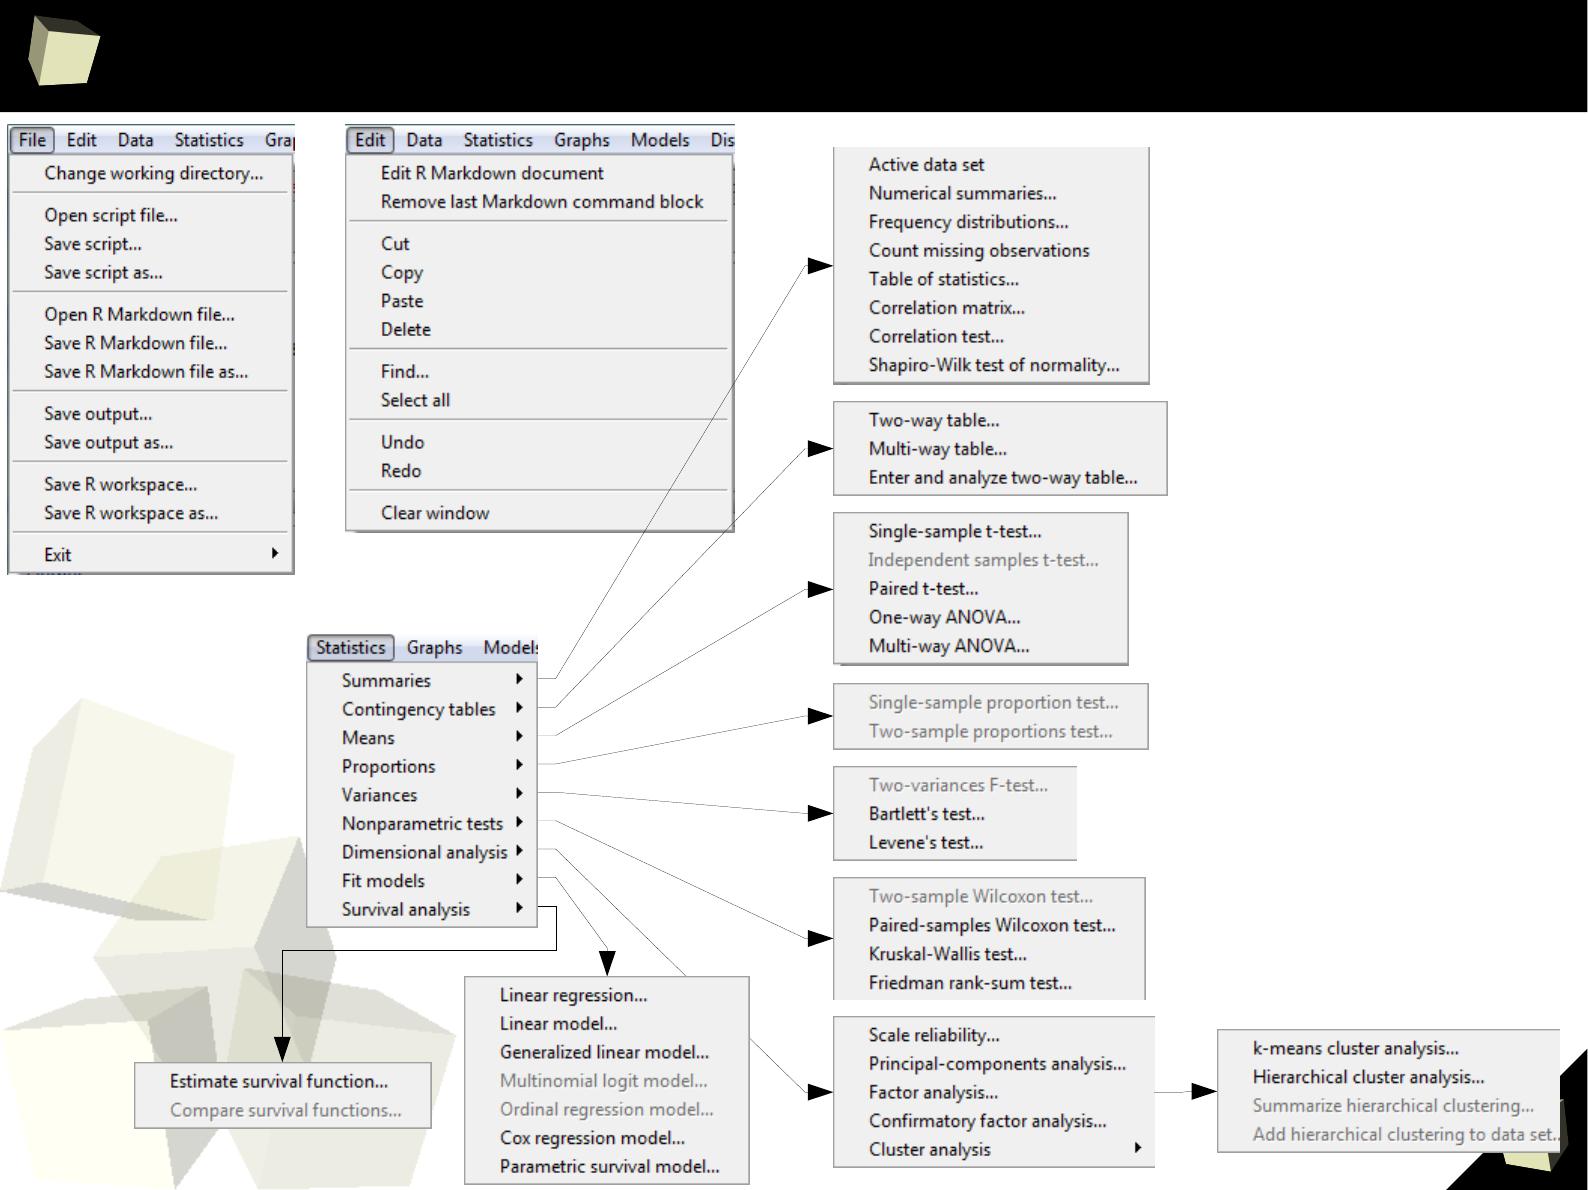
3
1
4
RCommander
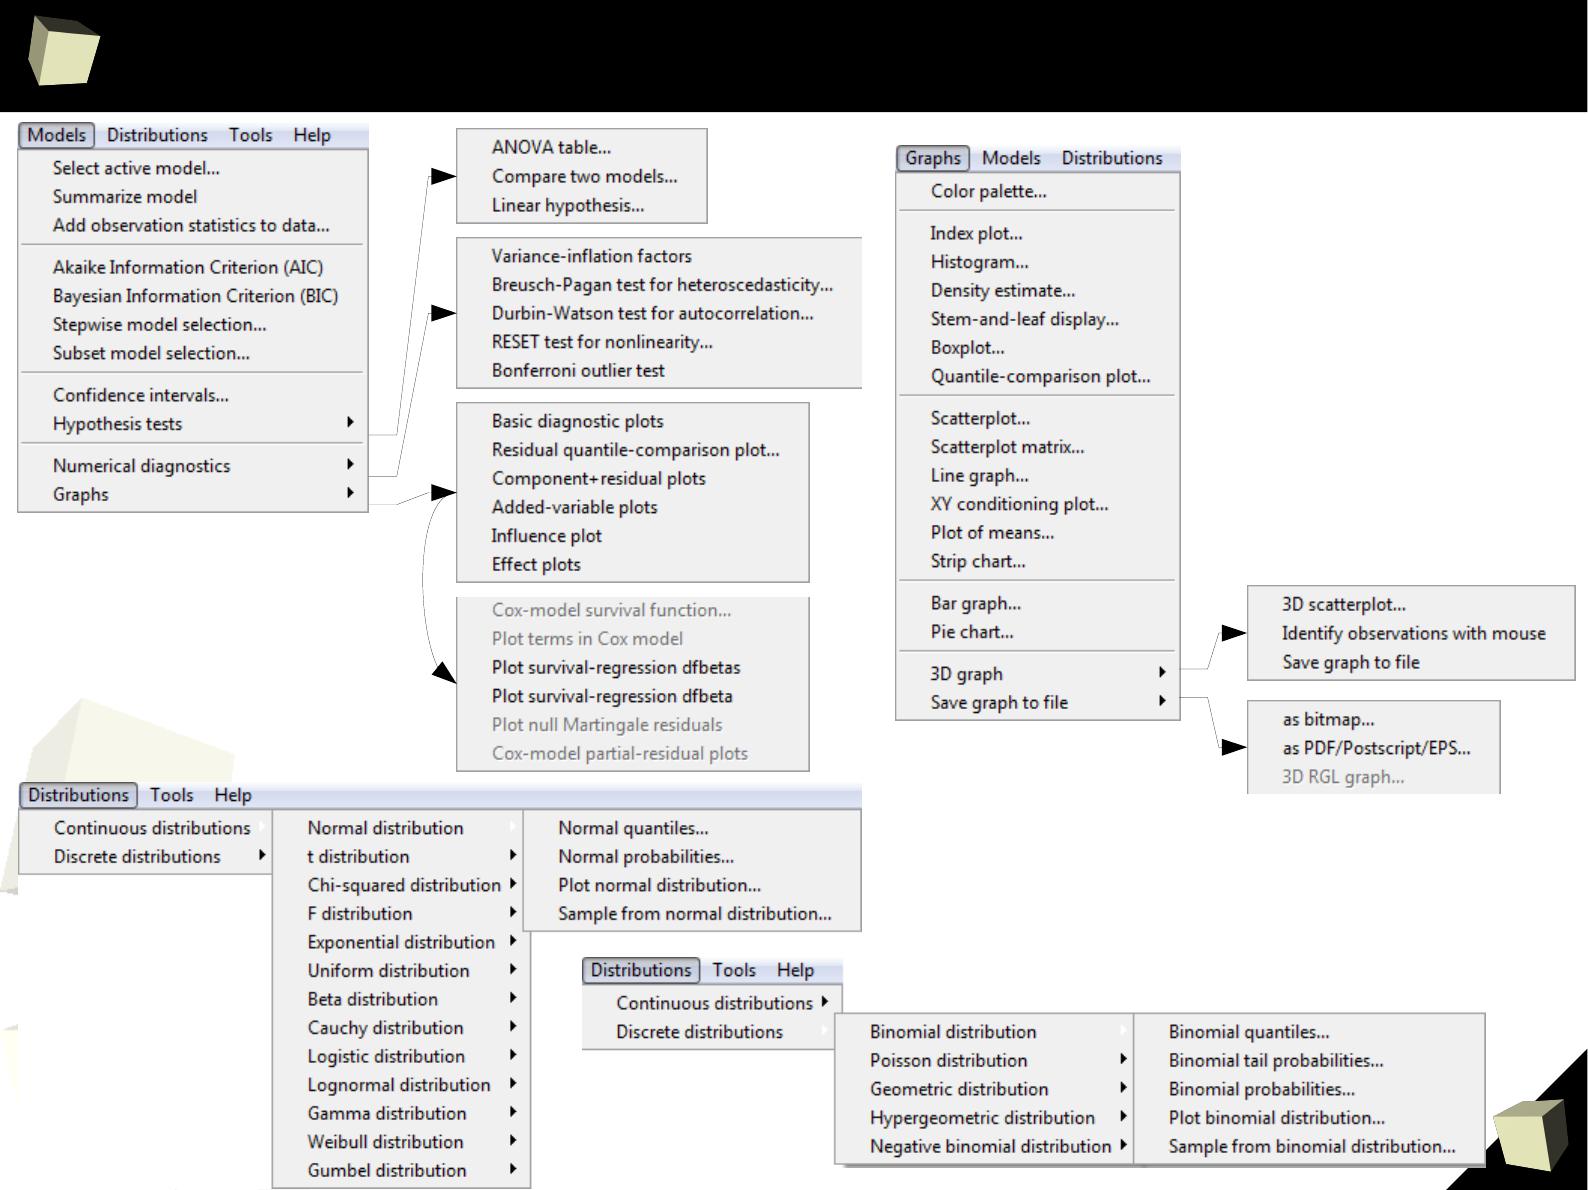
3
1
5
RCommander
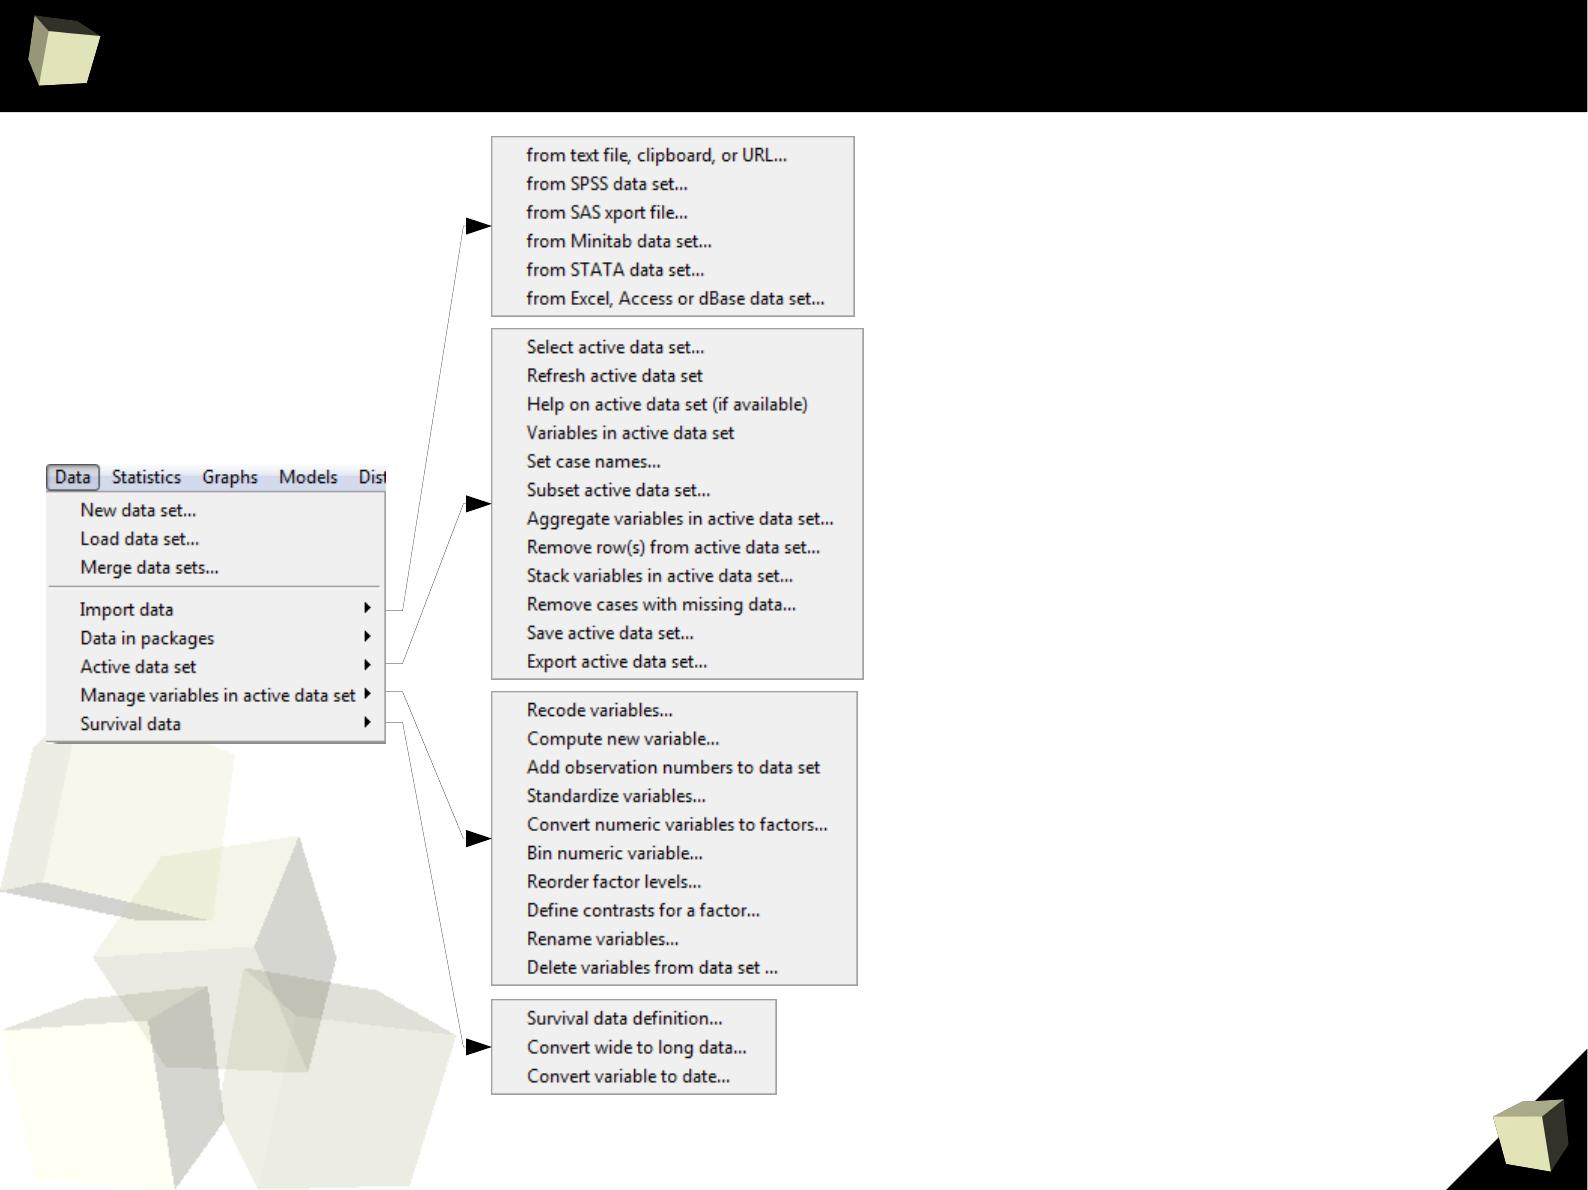
3
1
6
RCommander
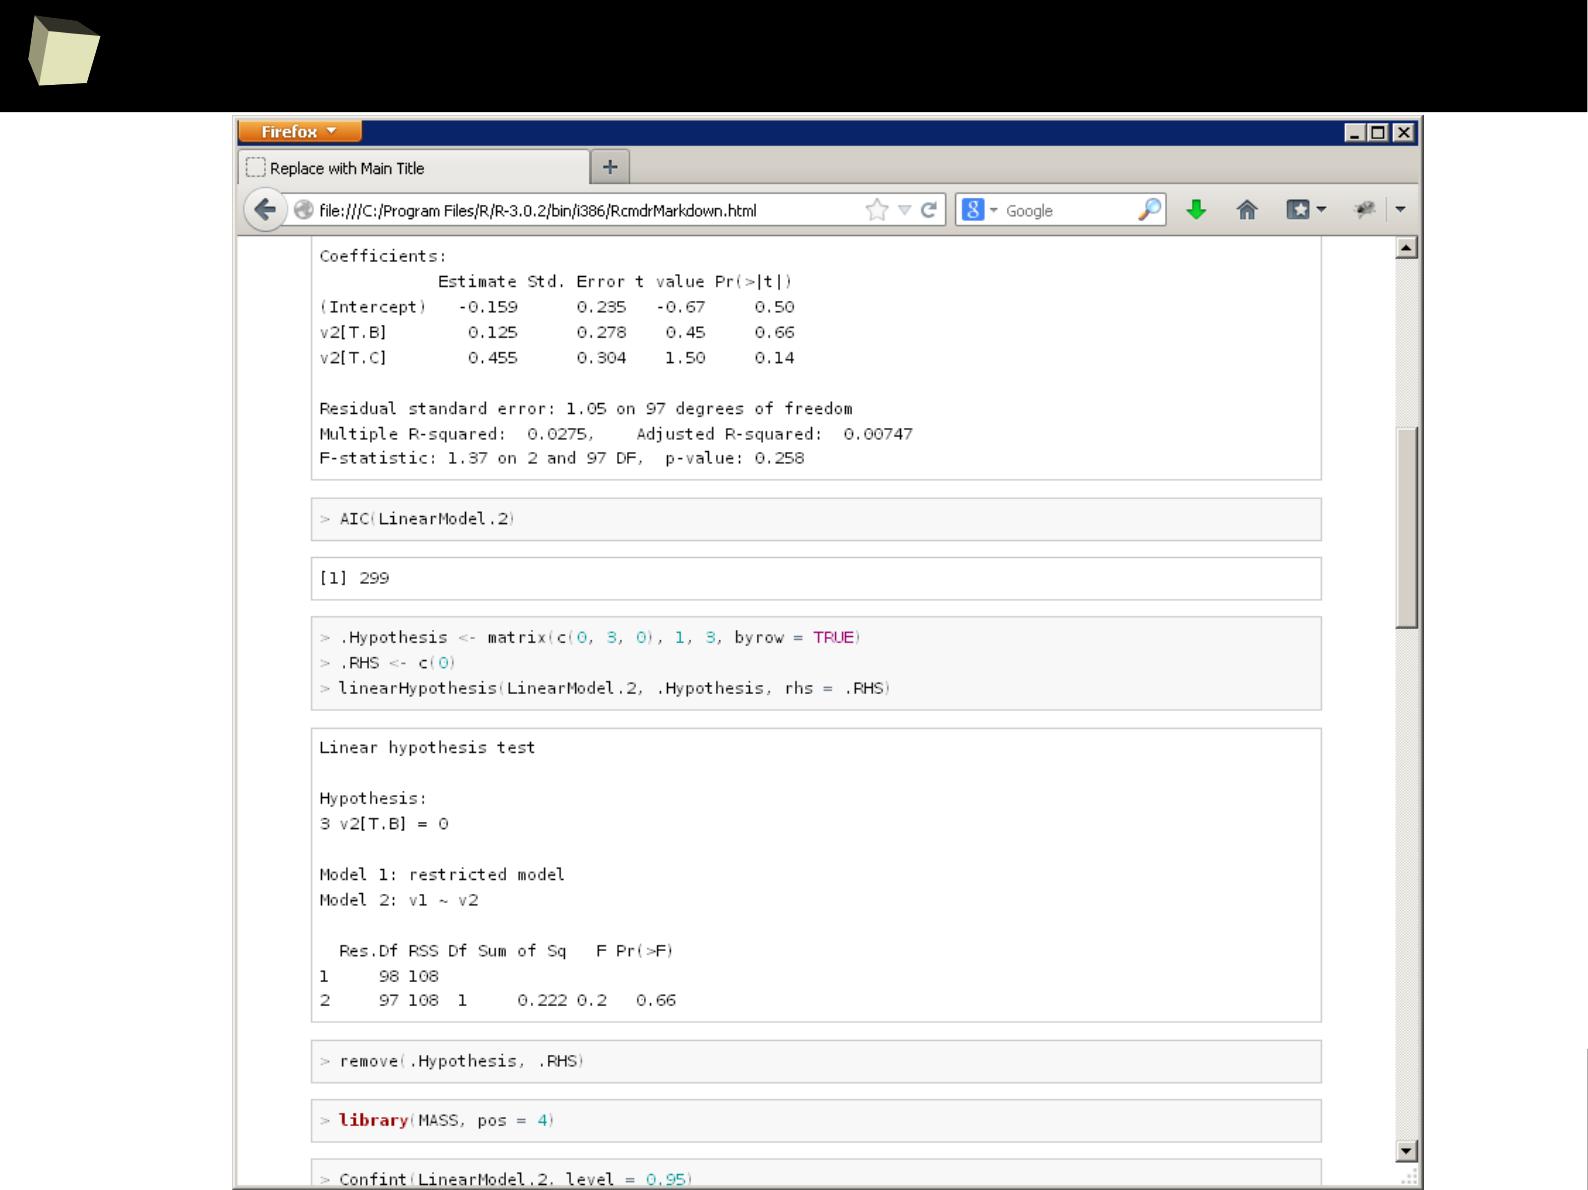
3
1
7
RCommander – the notebook (RMarkdown)
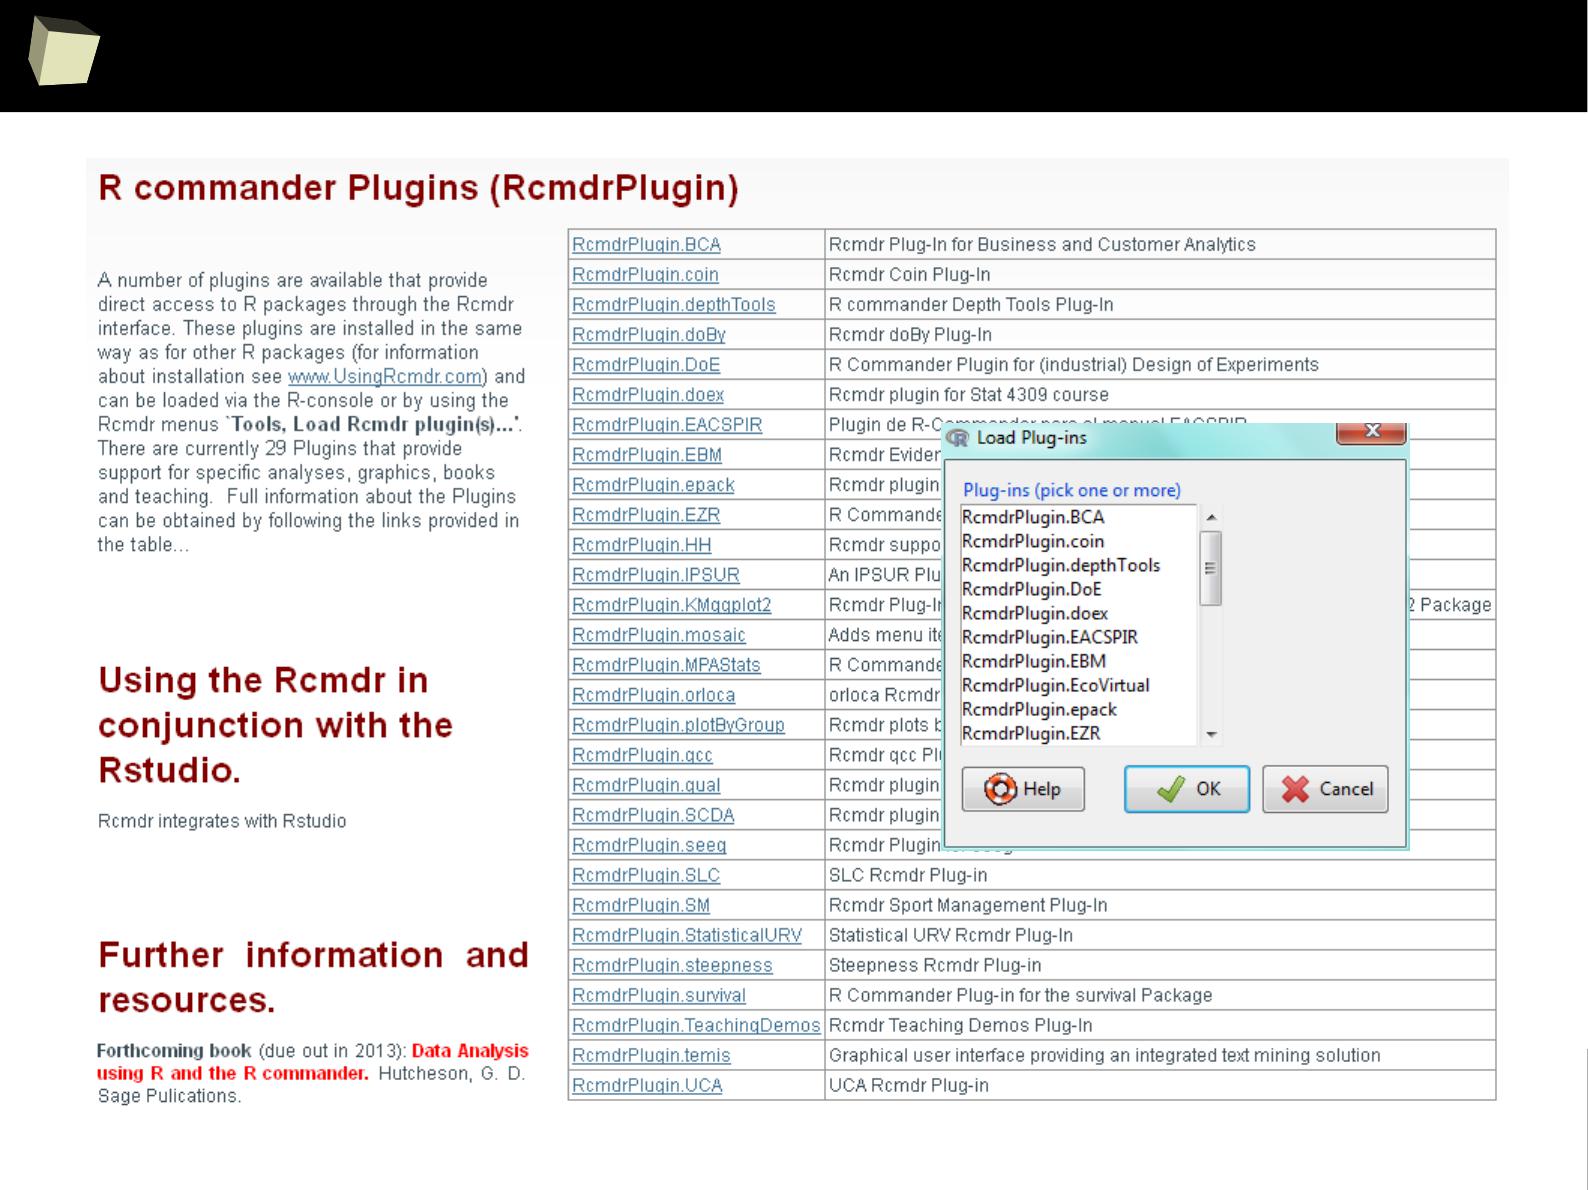
3
1
8
RCommander - plugins
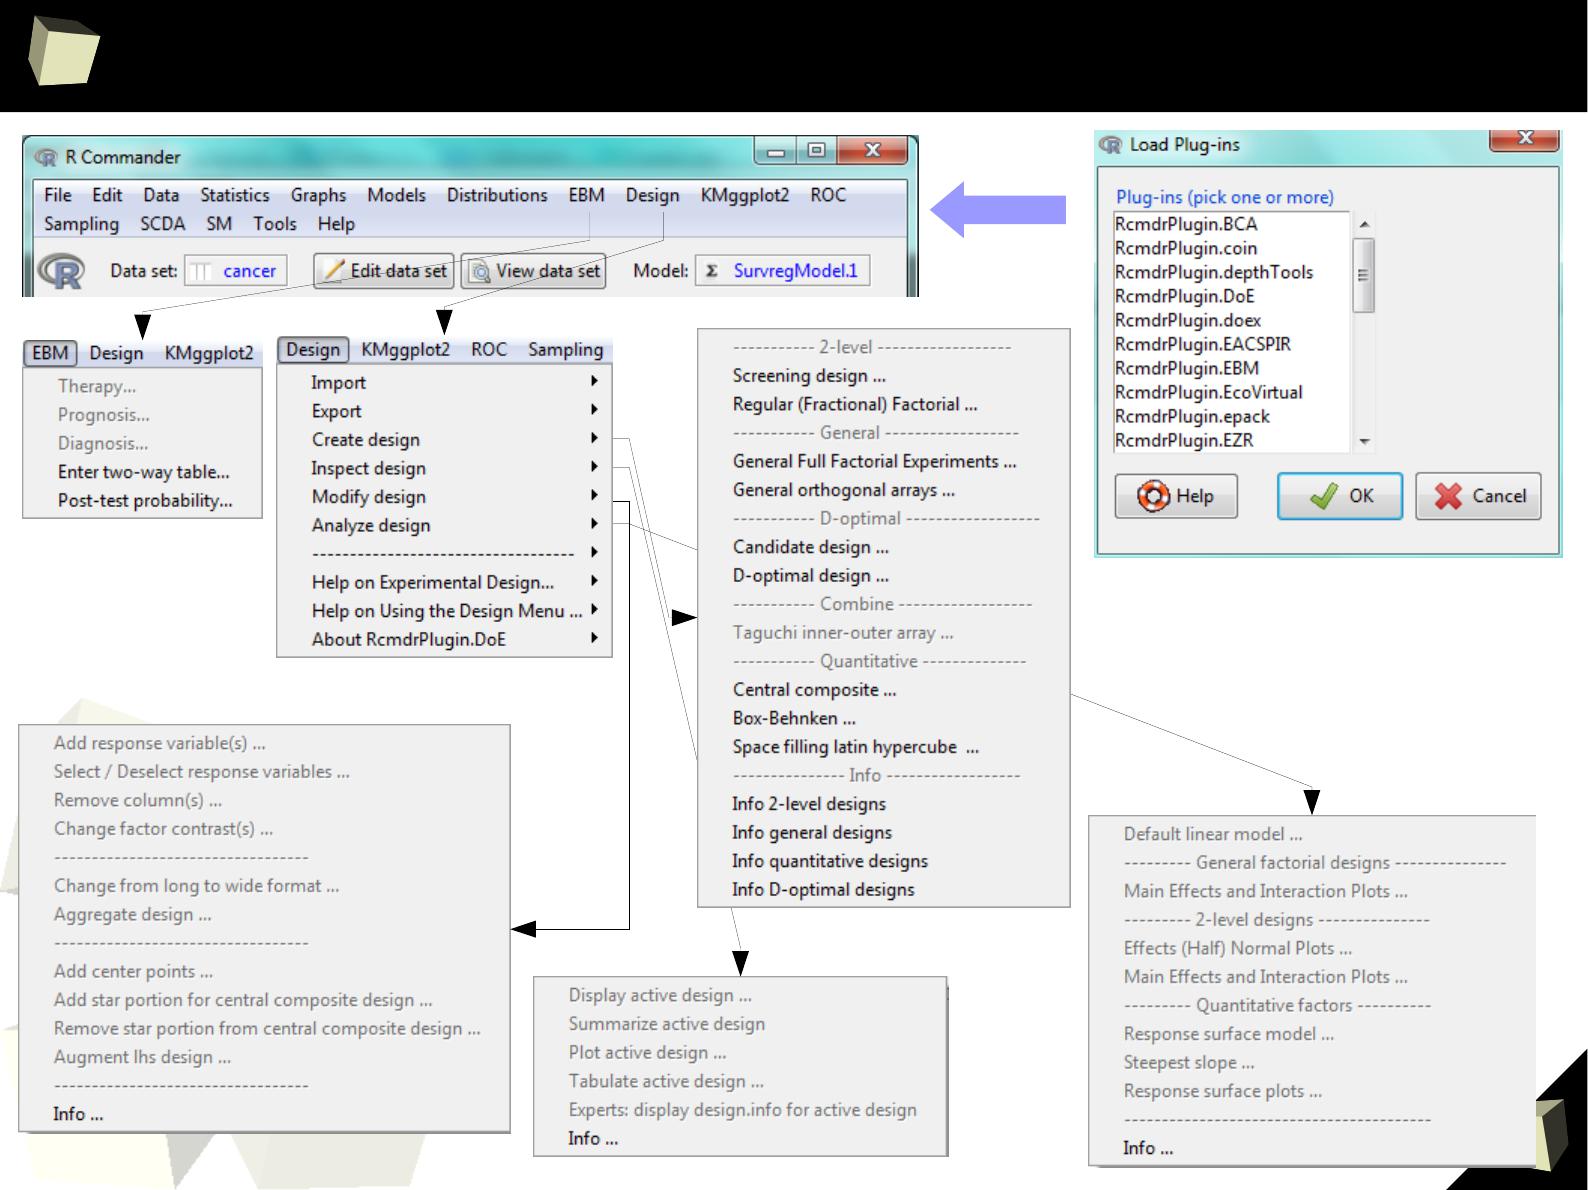
3
1
9
bio RCommander
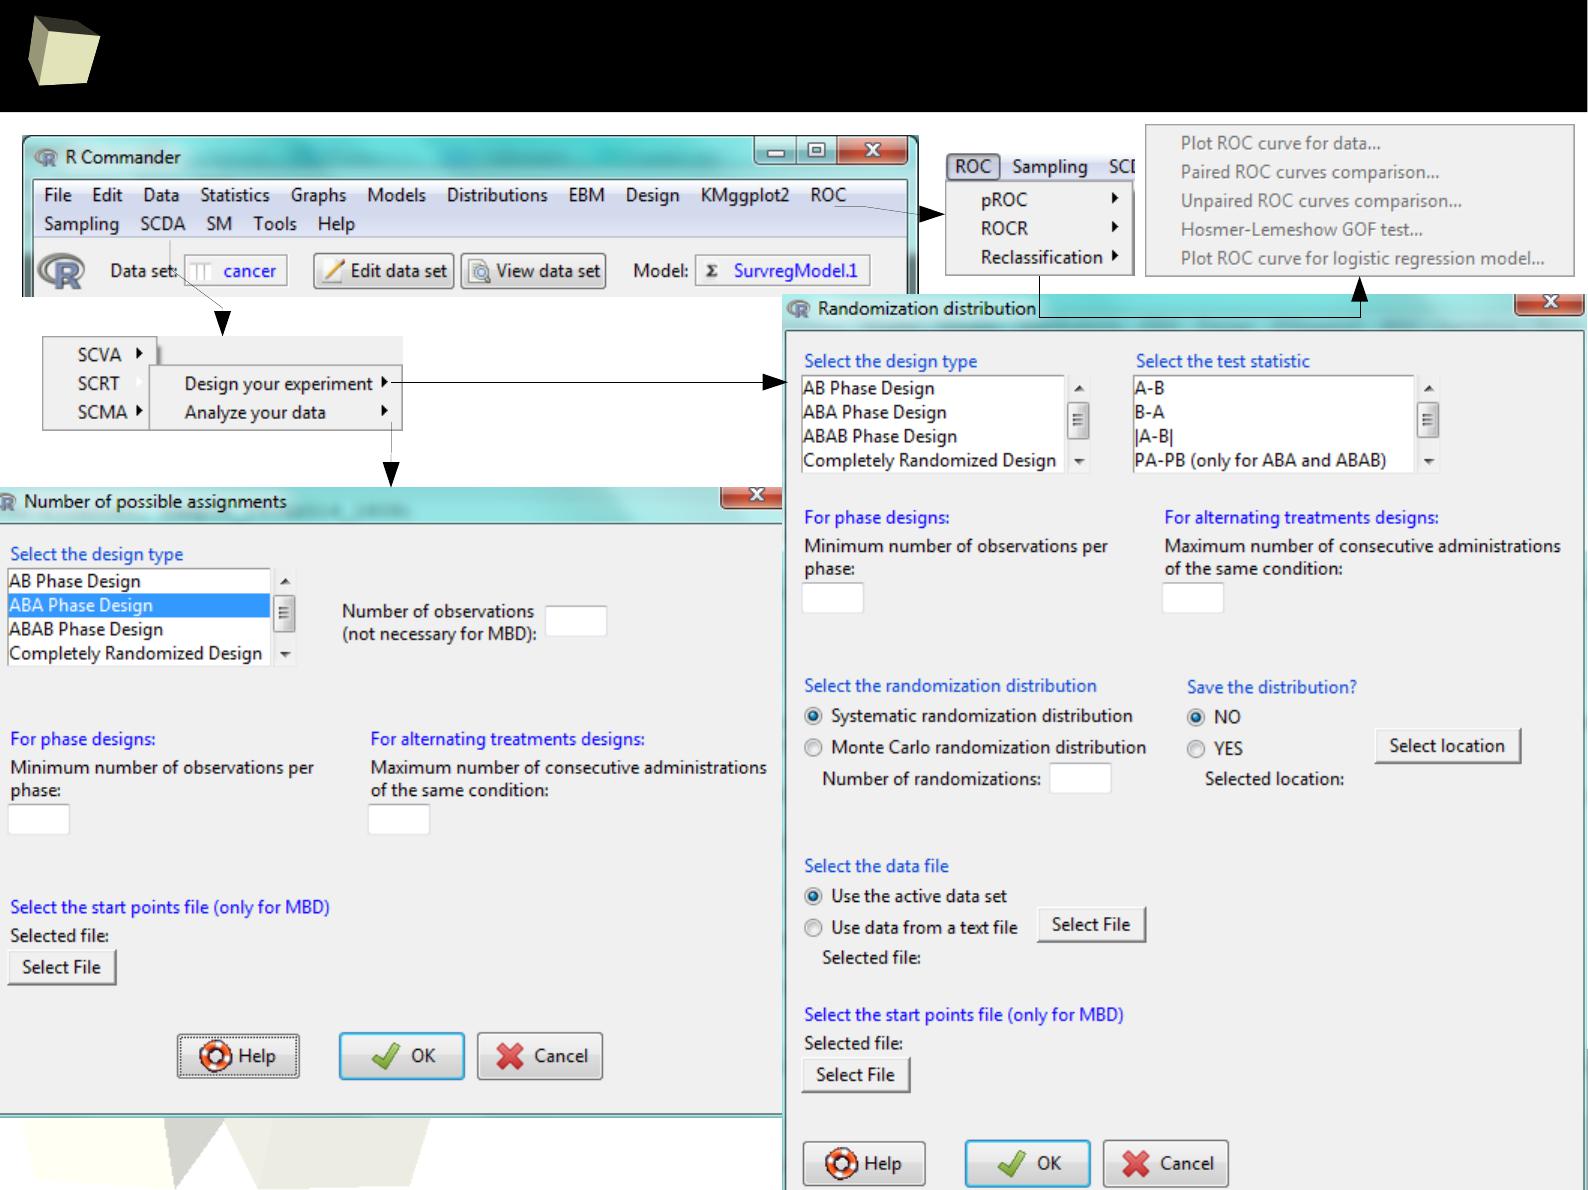
3
2
0
bio RCommander
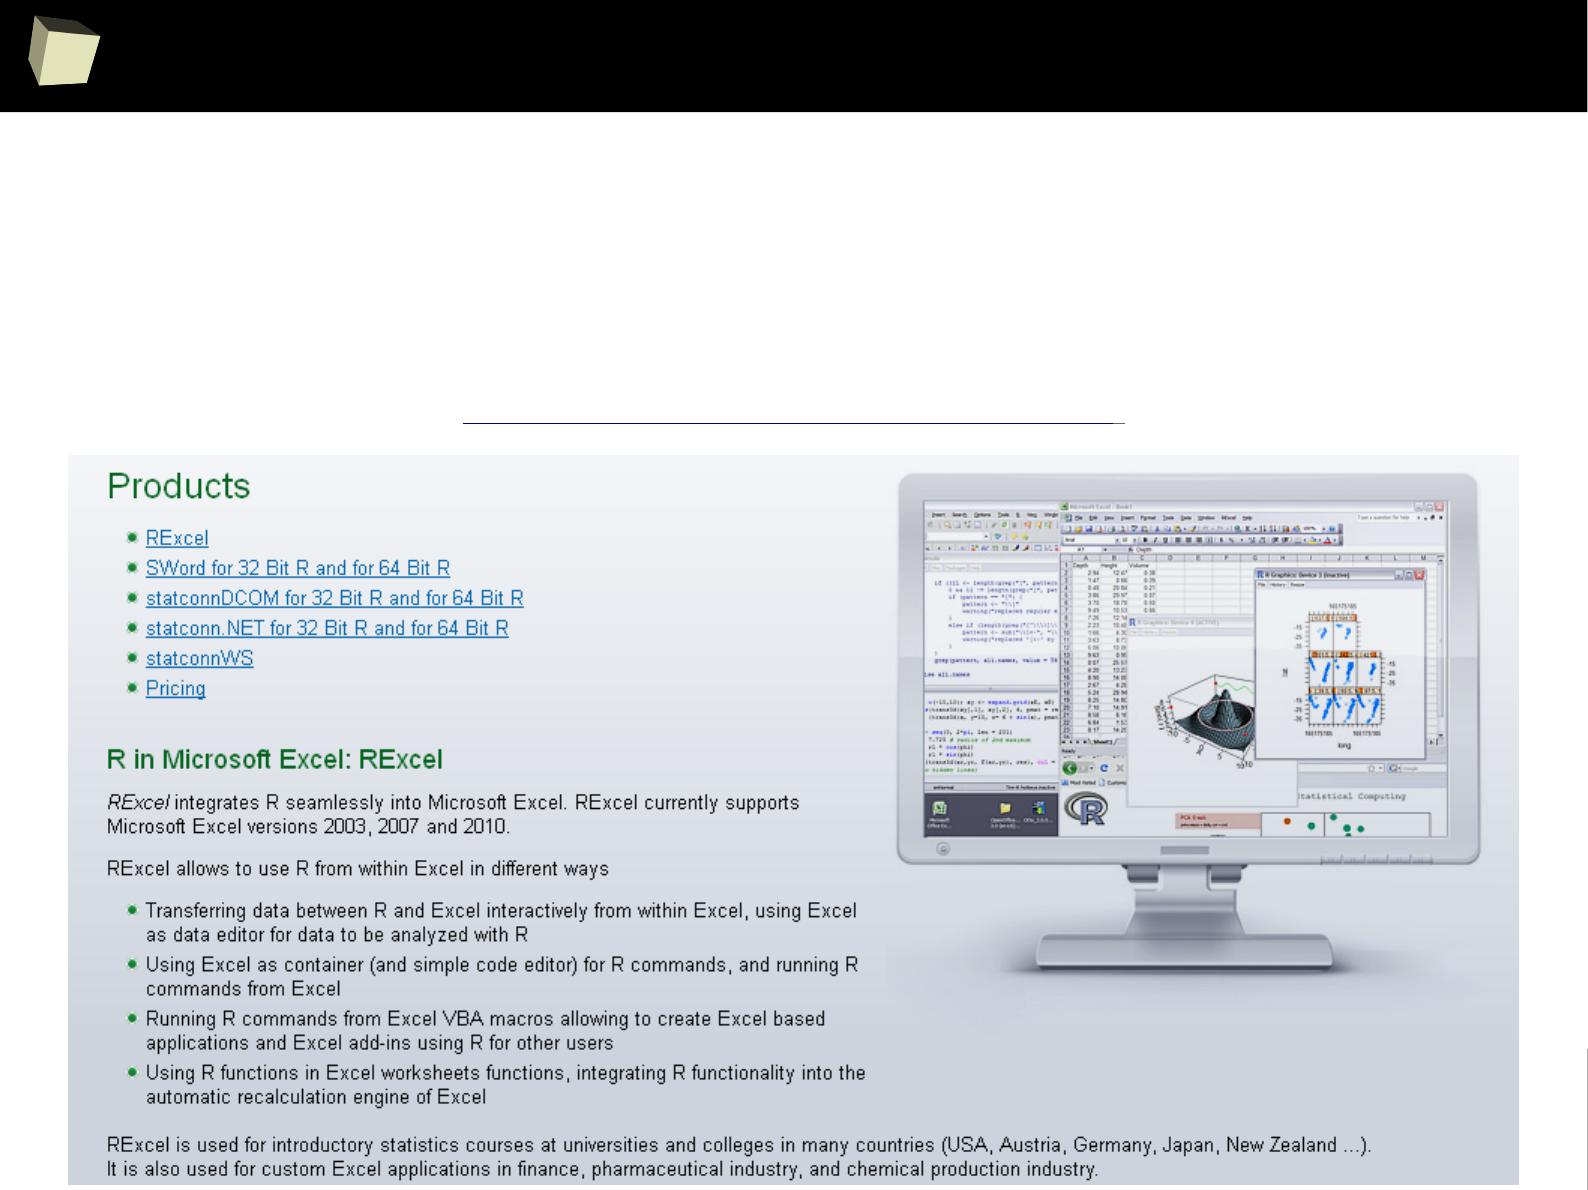
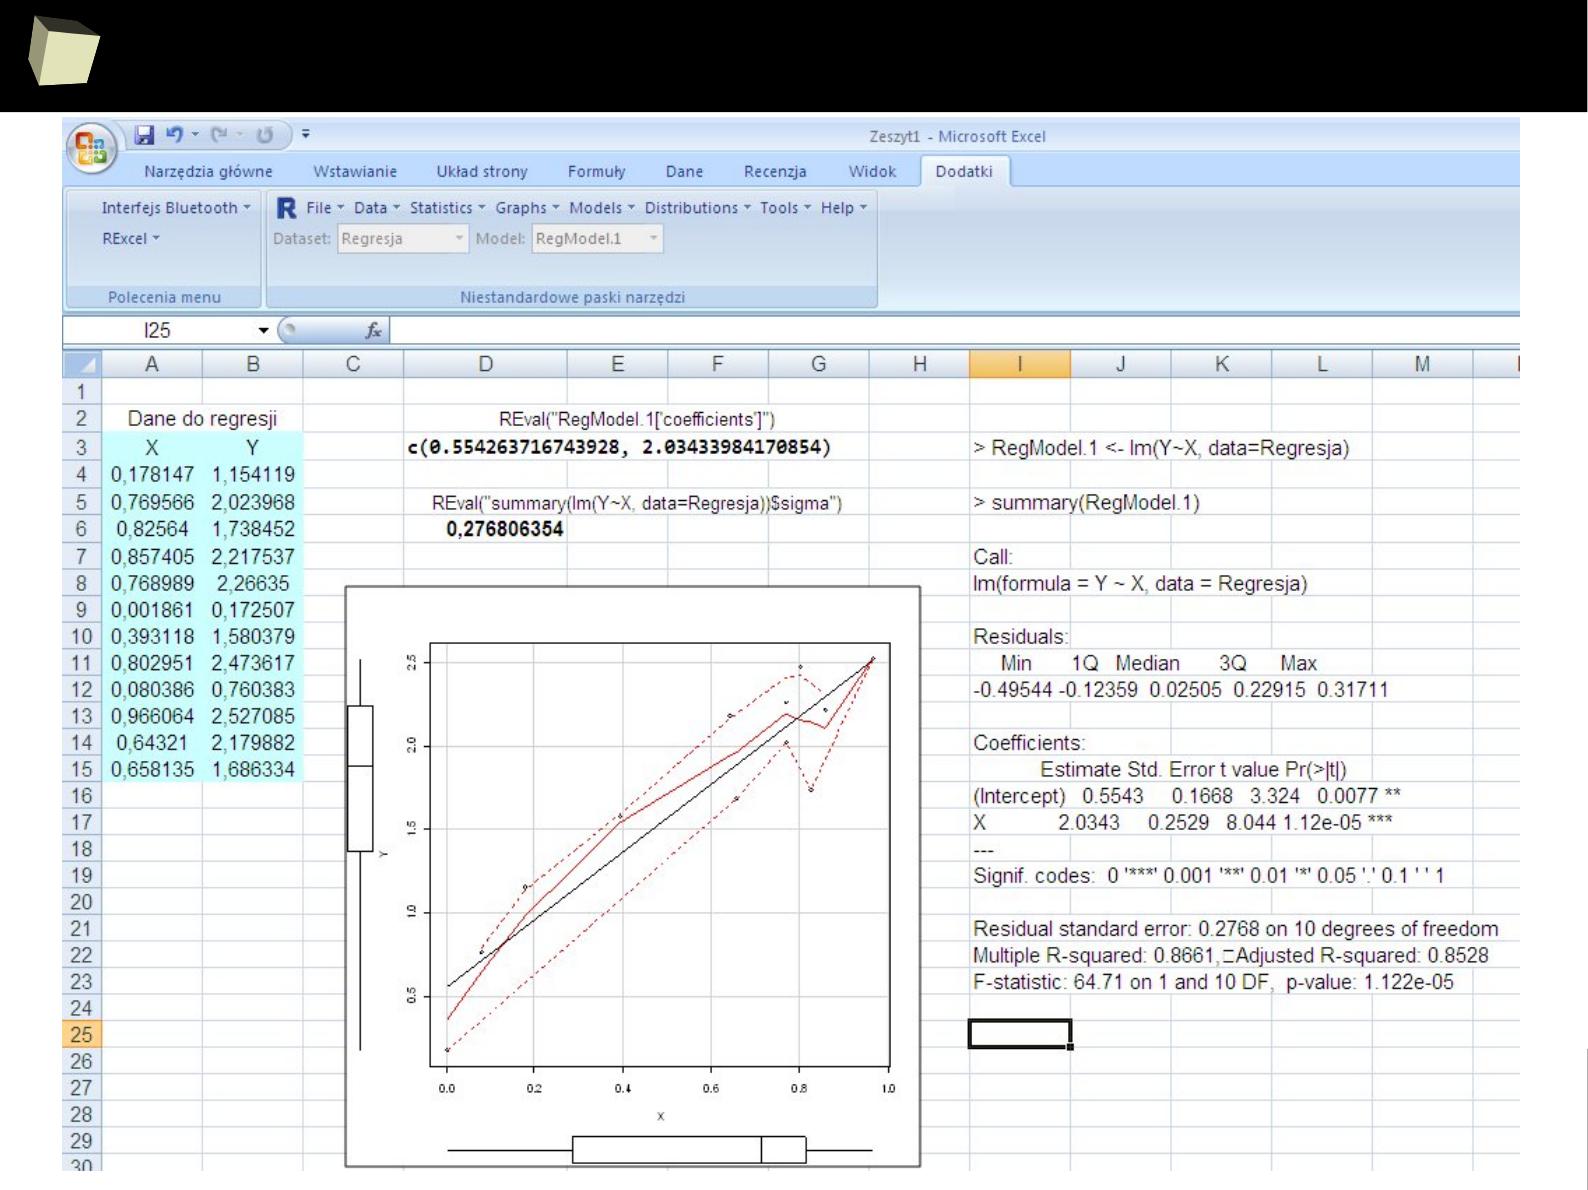
3
2
2
Excel + RExcel + RCommander
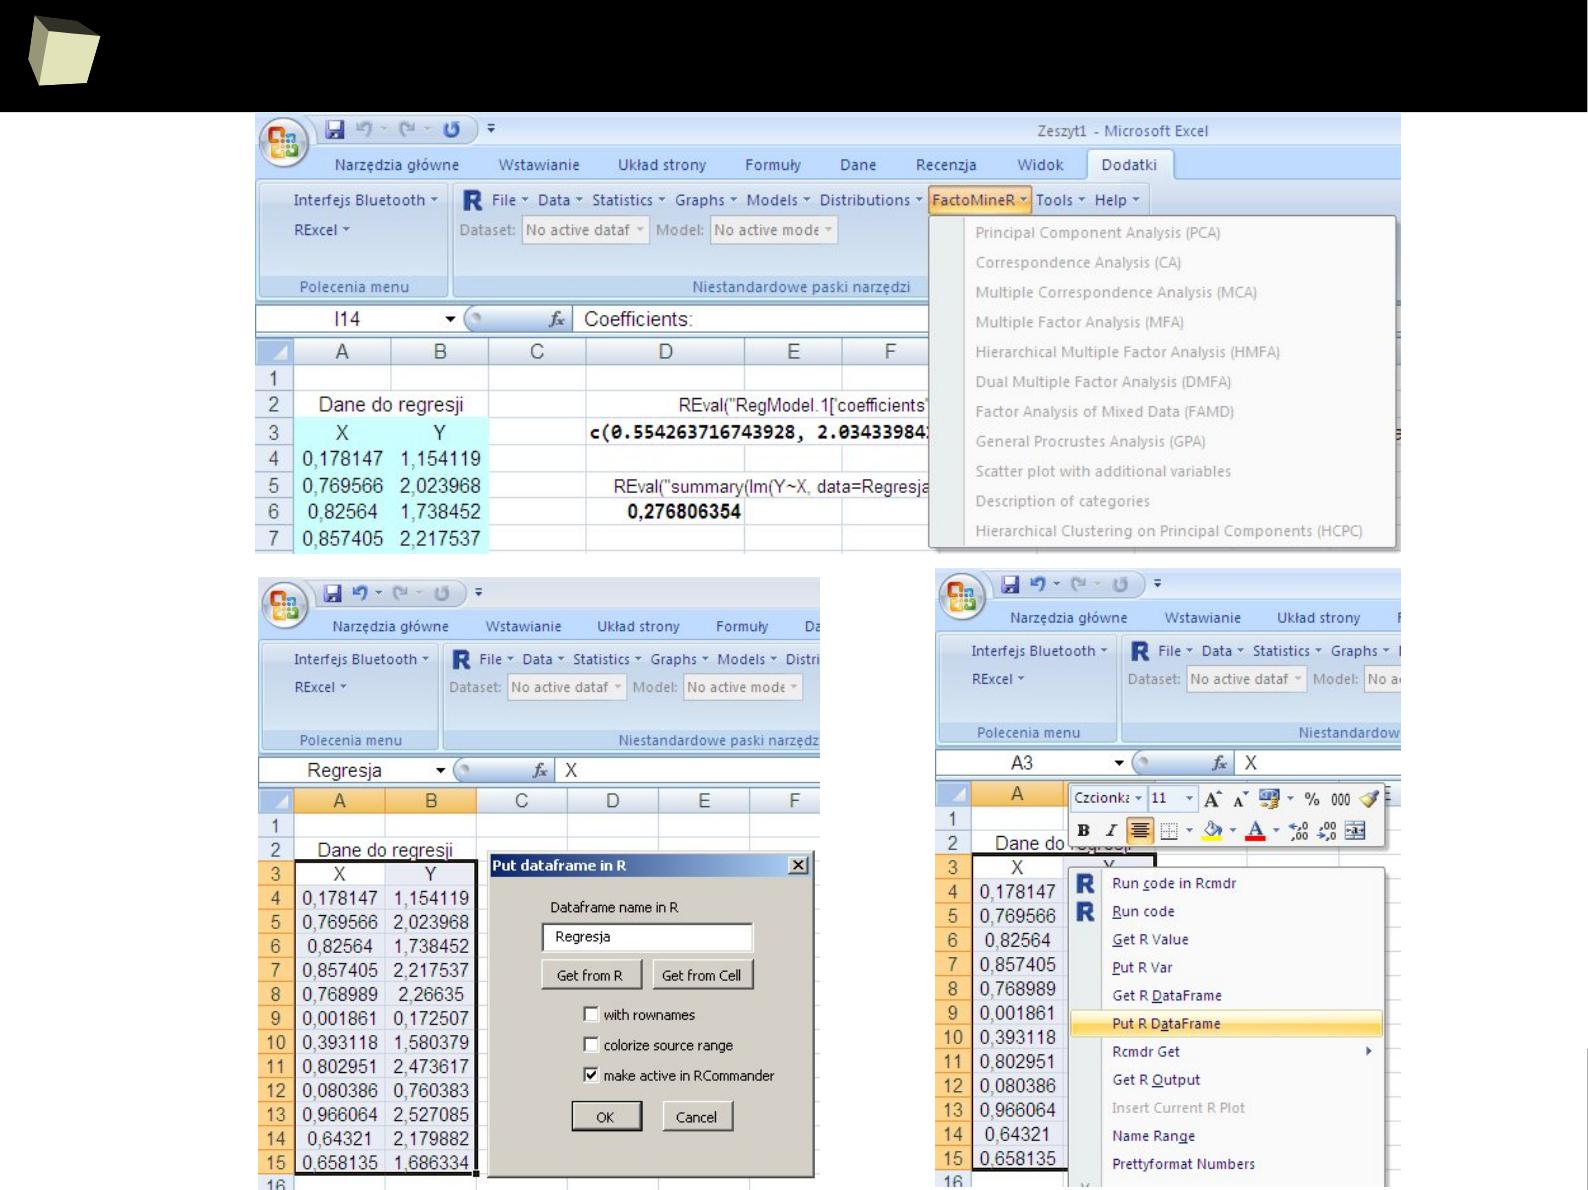
3
2
3
Excel + RExcel + RCommander
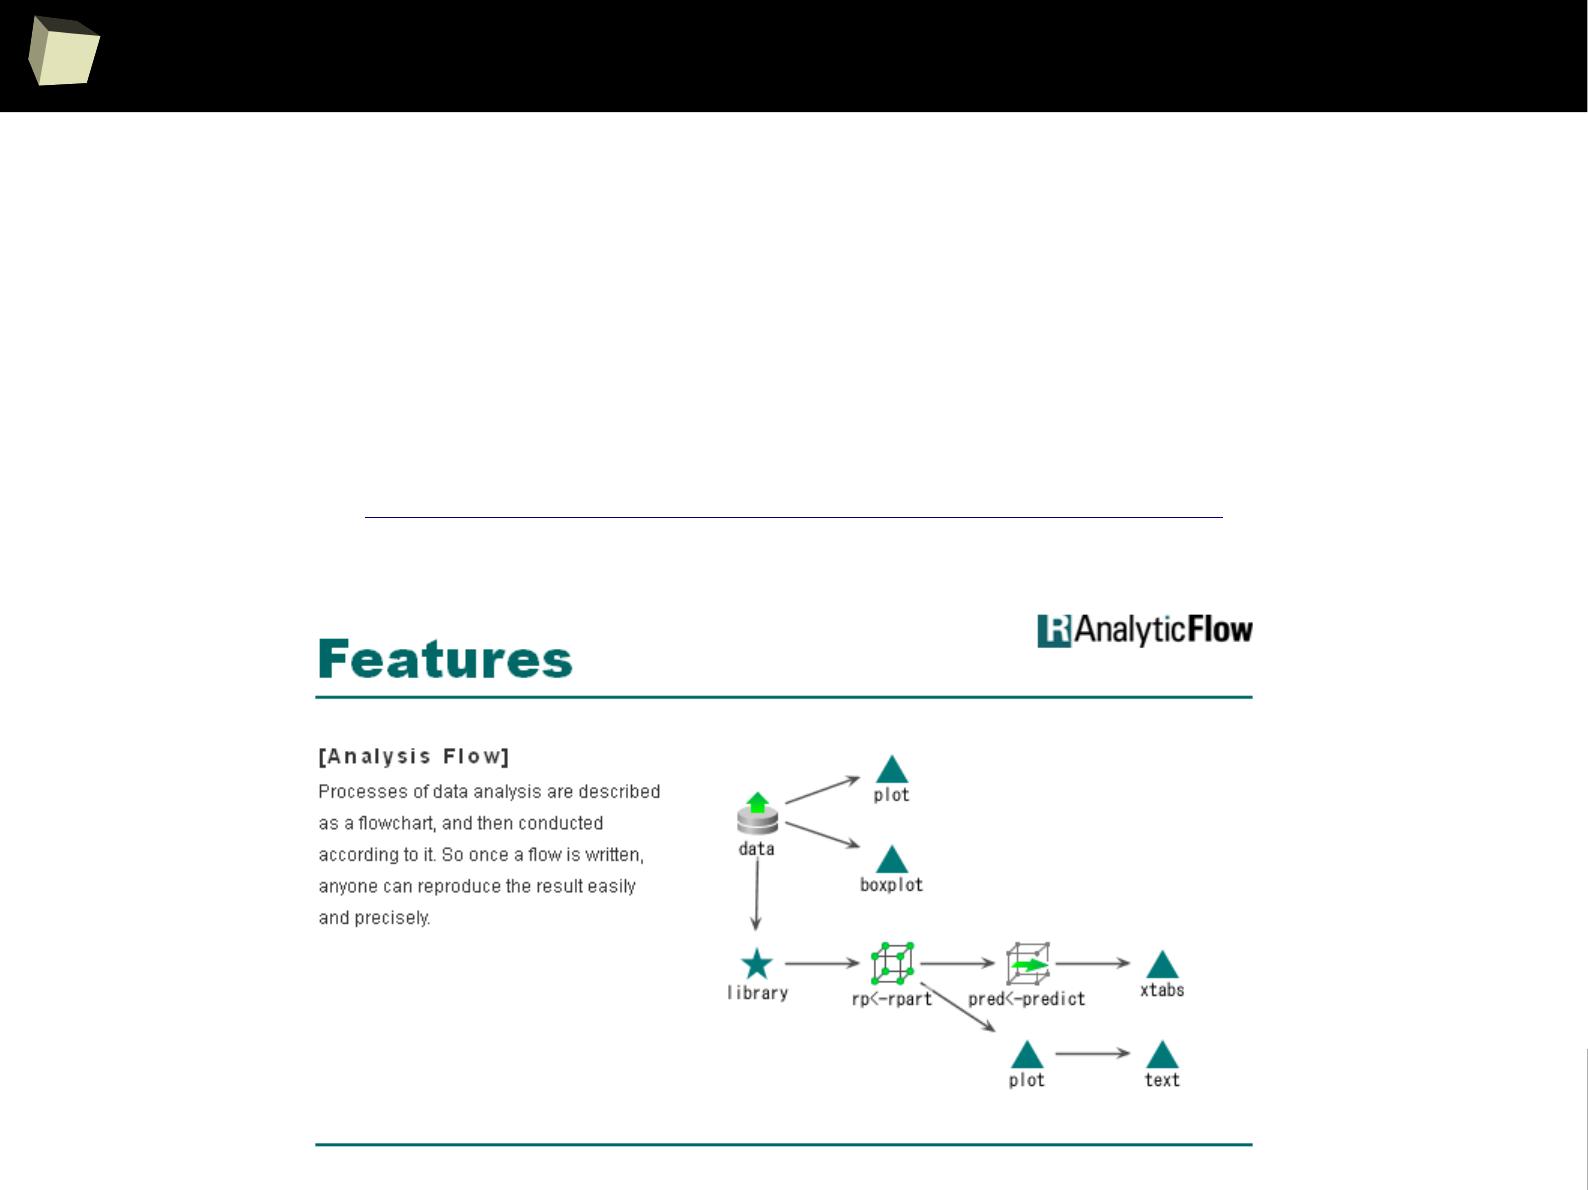
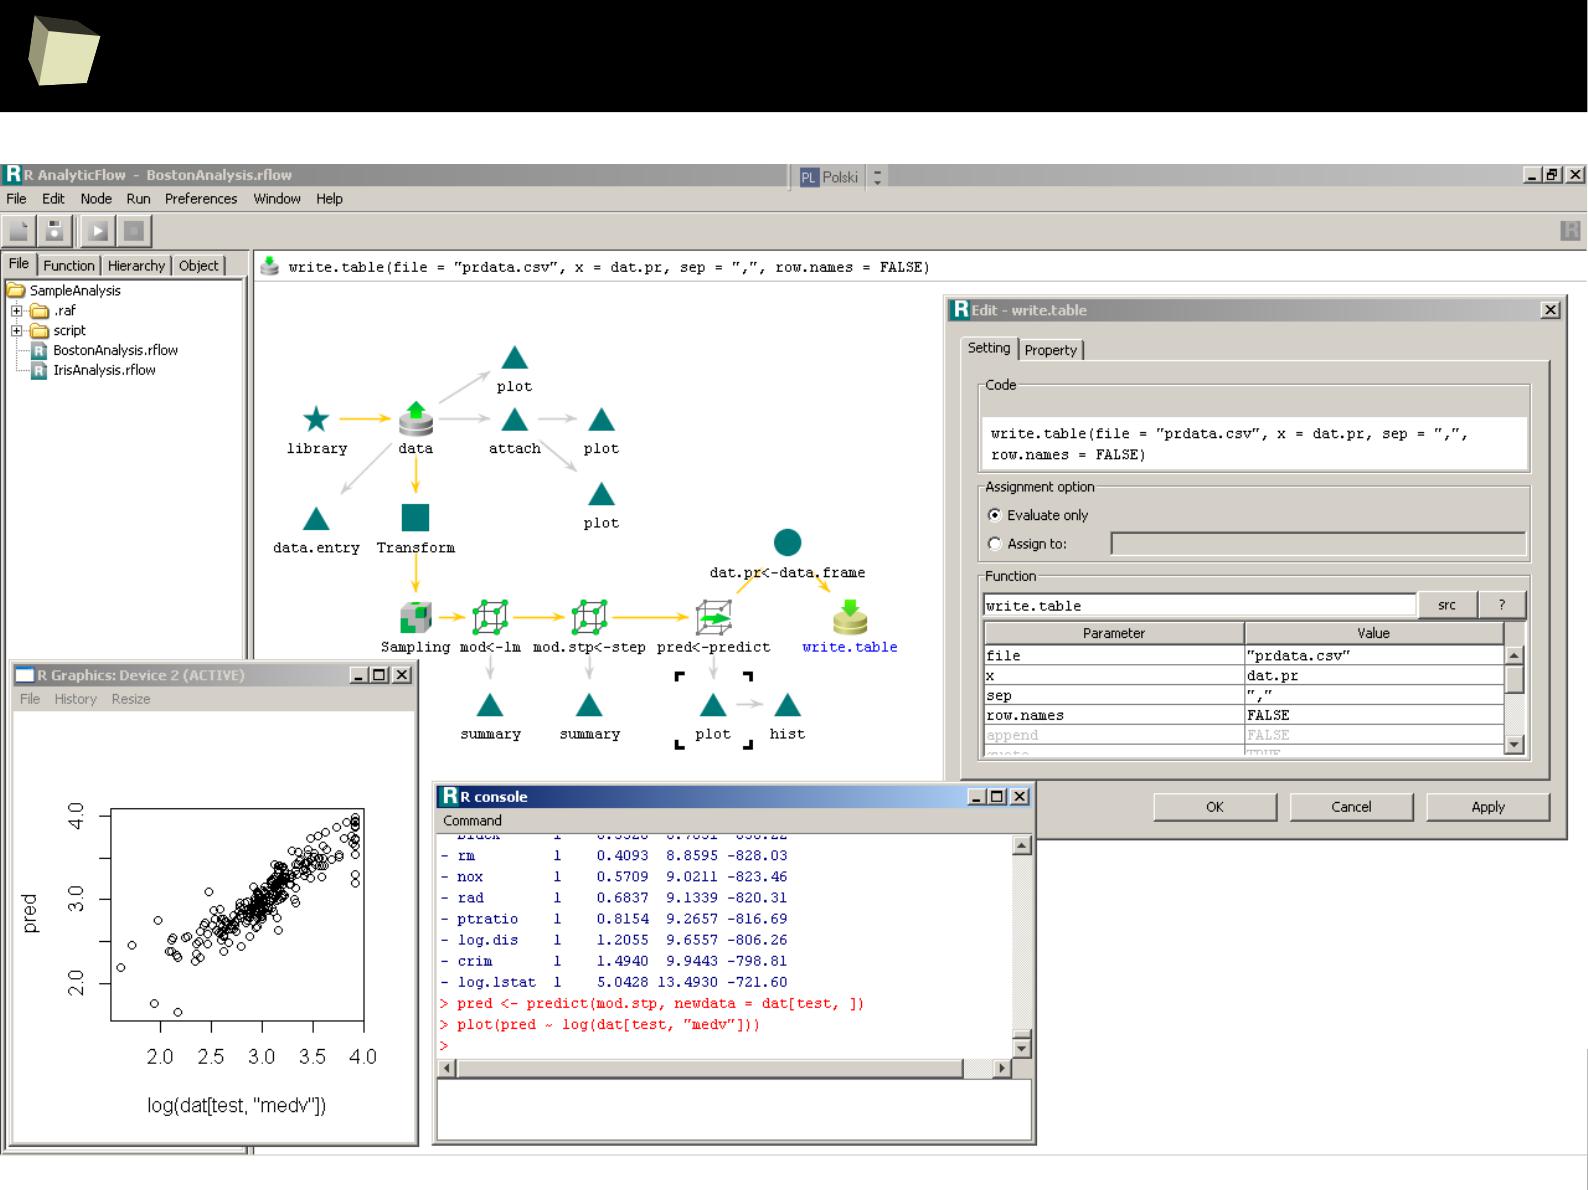
3
2
5
R Analaytic Flow
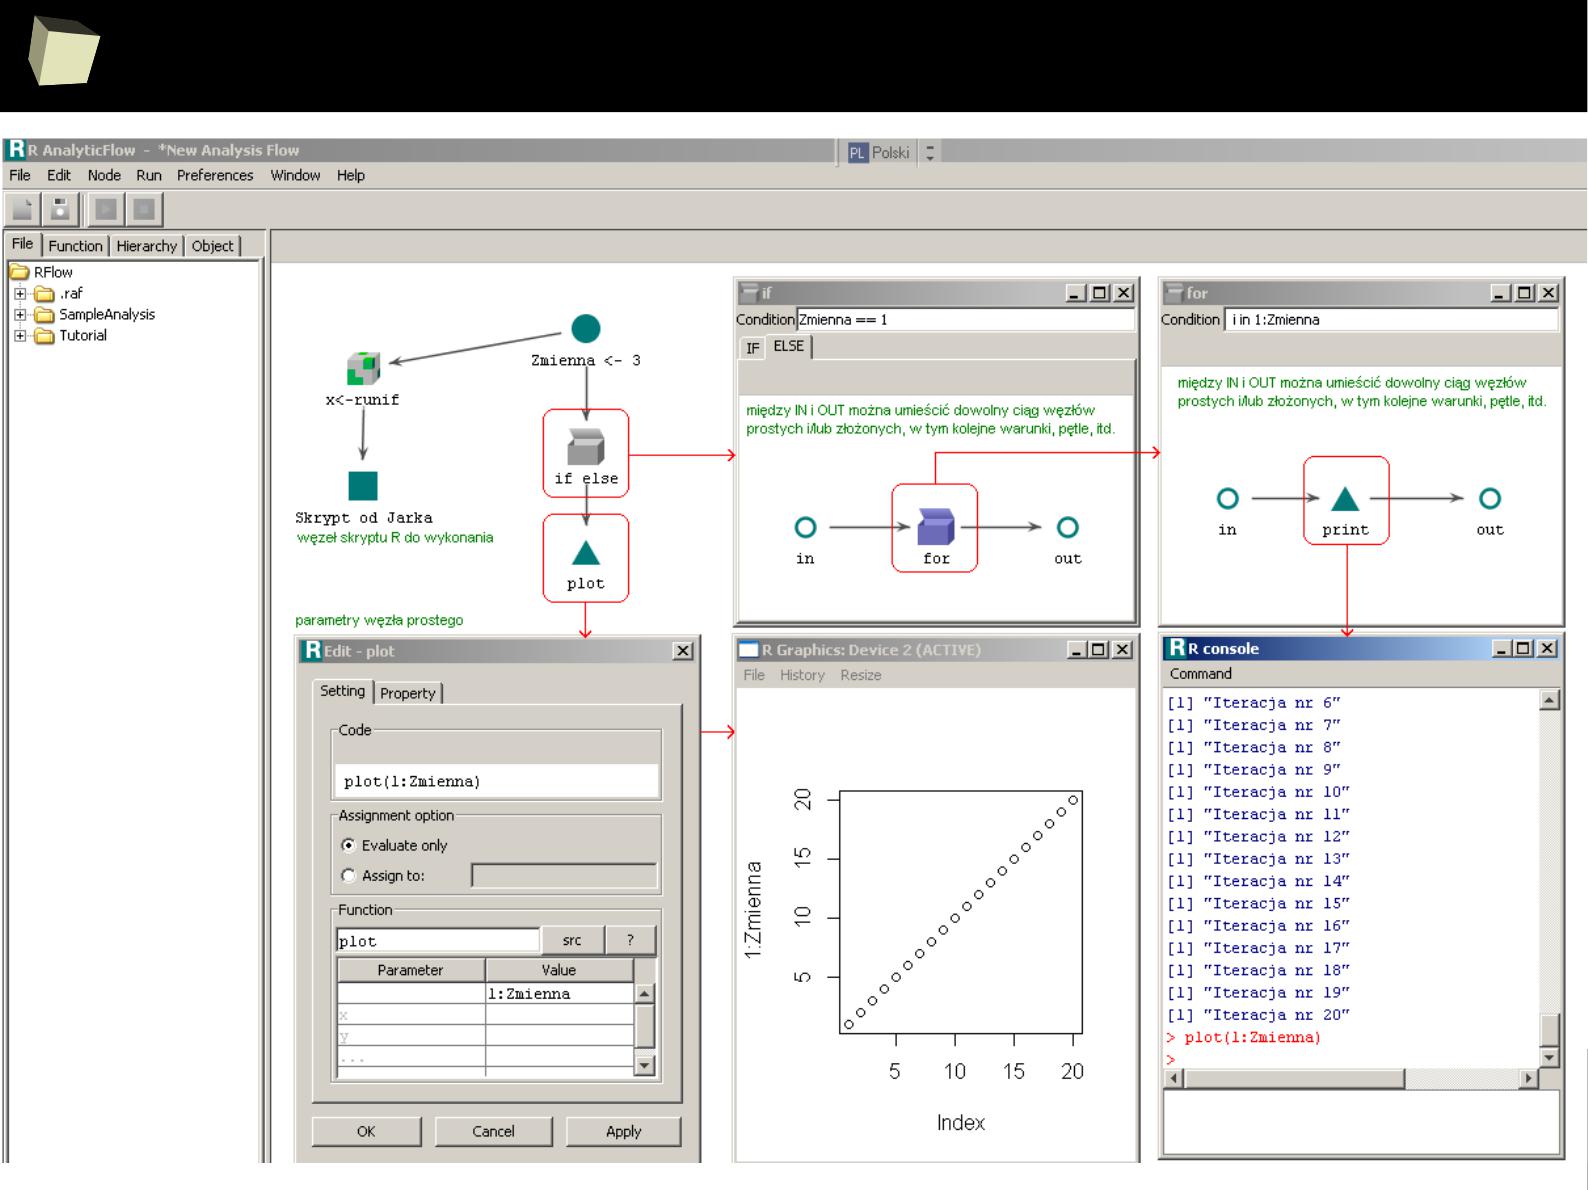
3
2
6
R Analaytic Flow
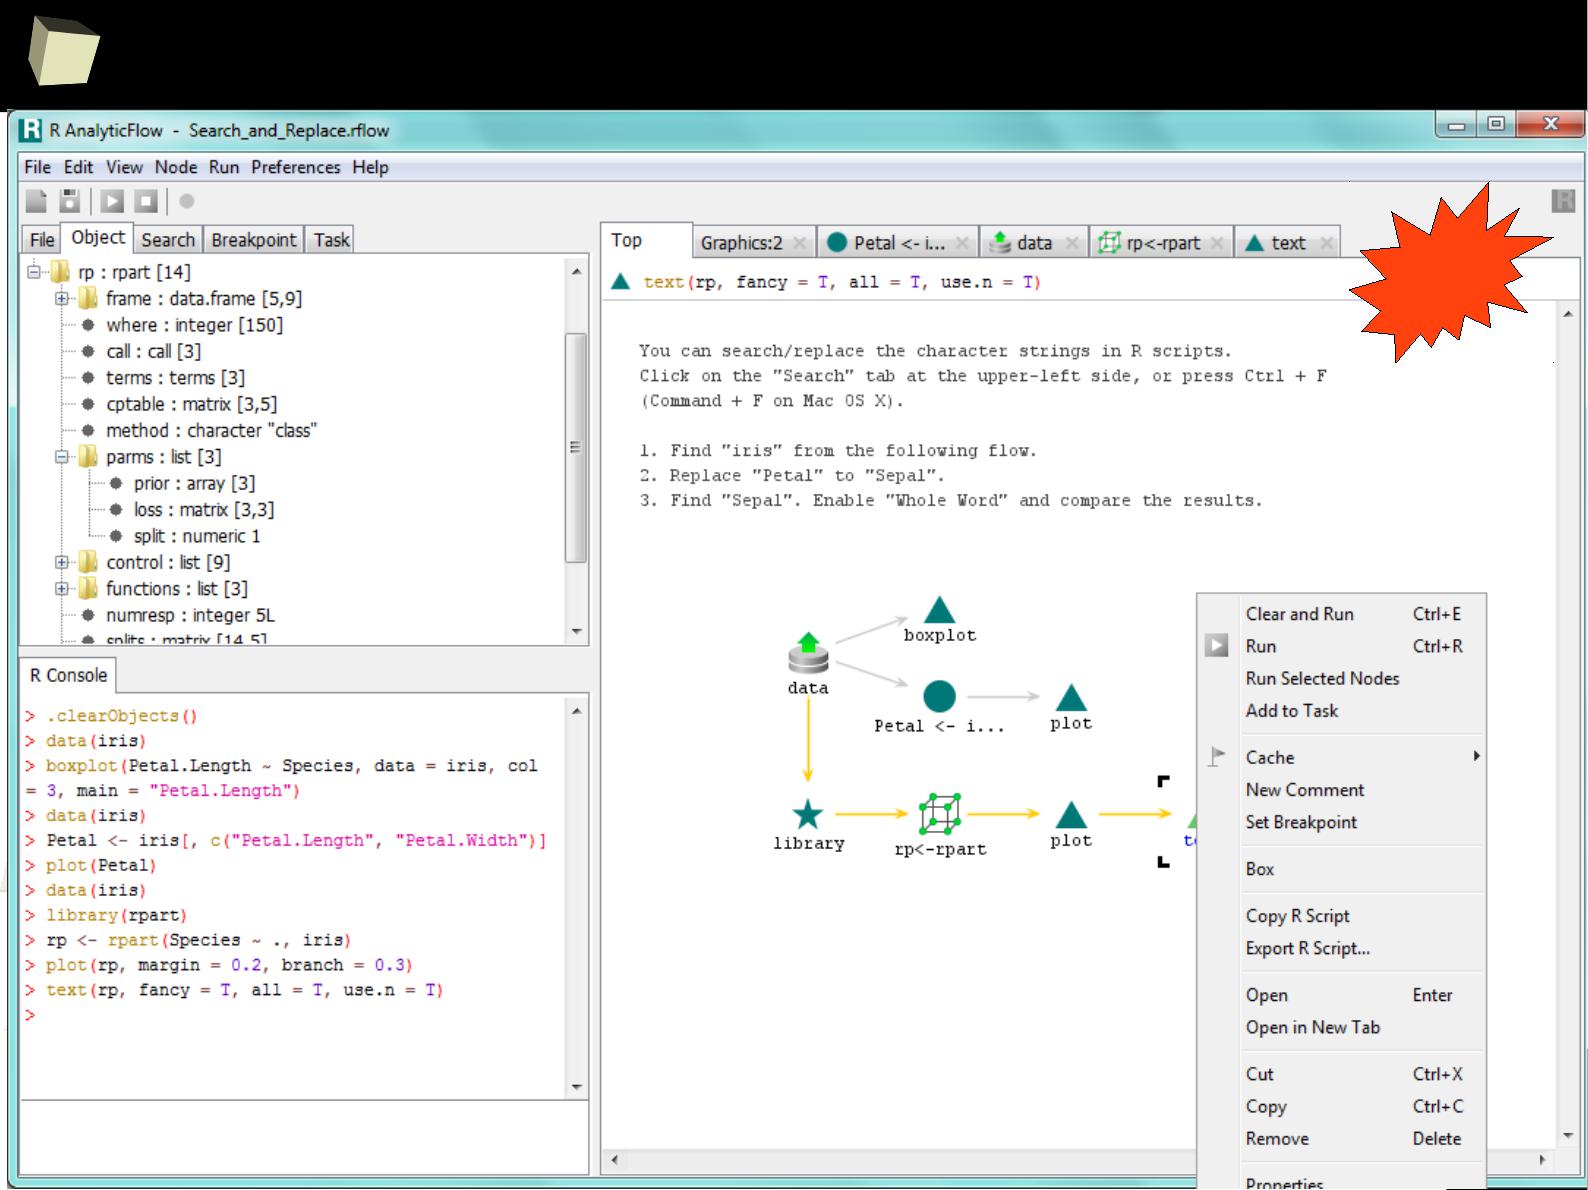
3
2
7
R Analaytic Flow
New!
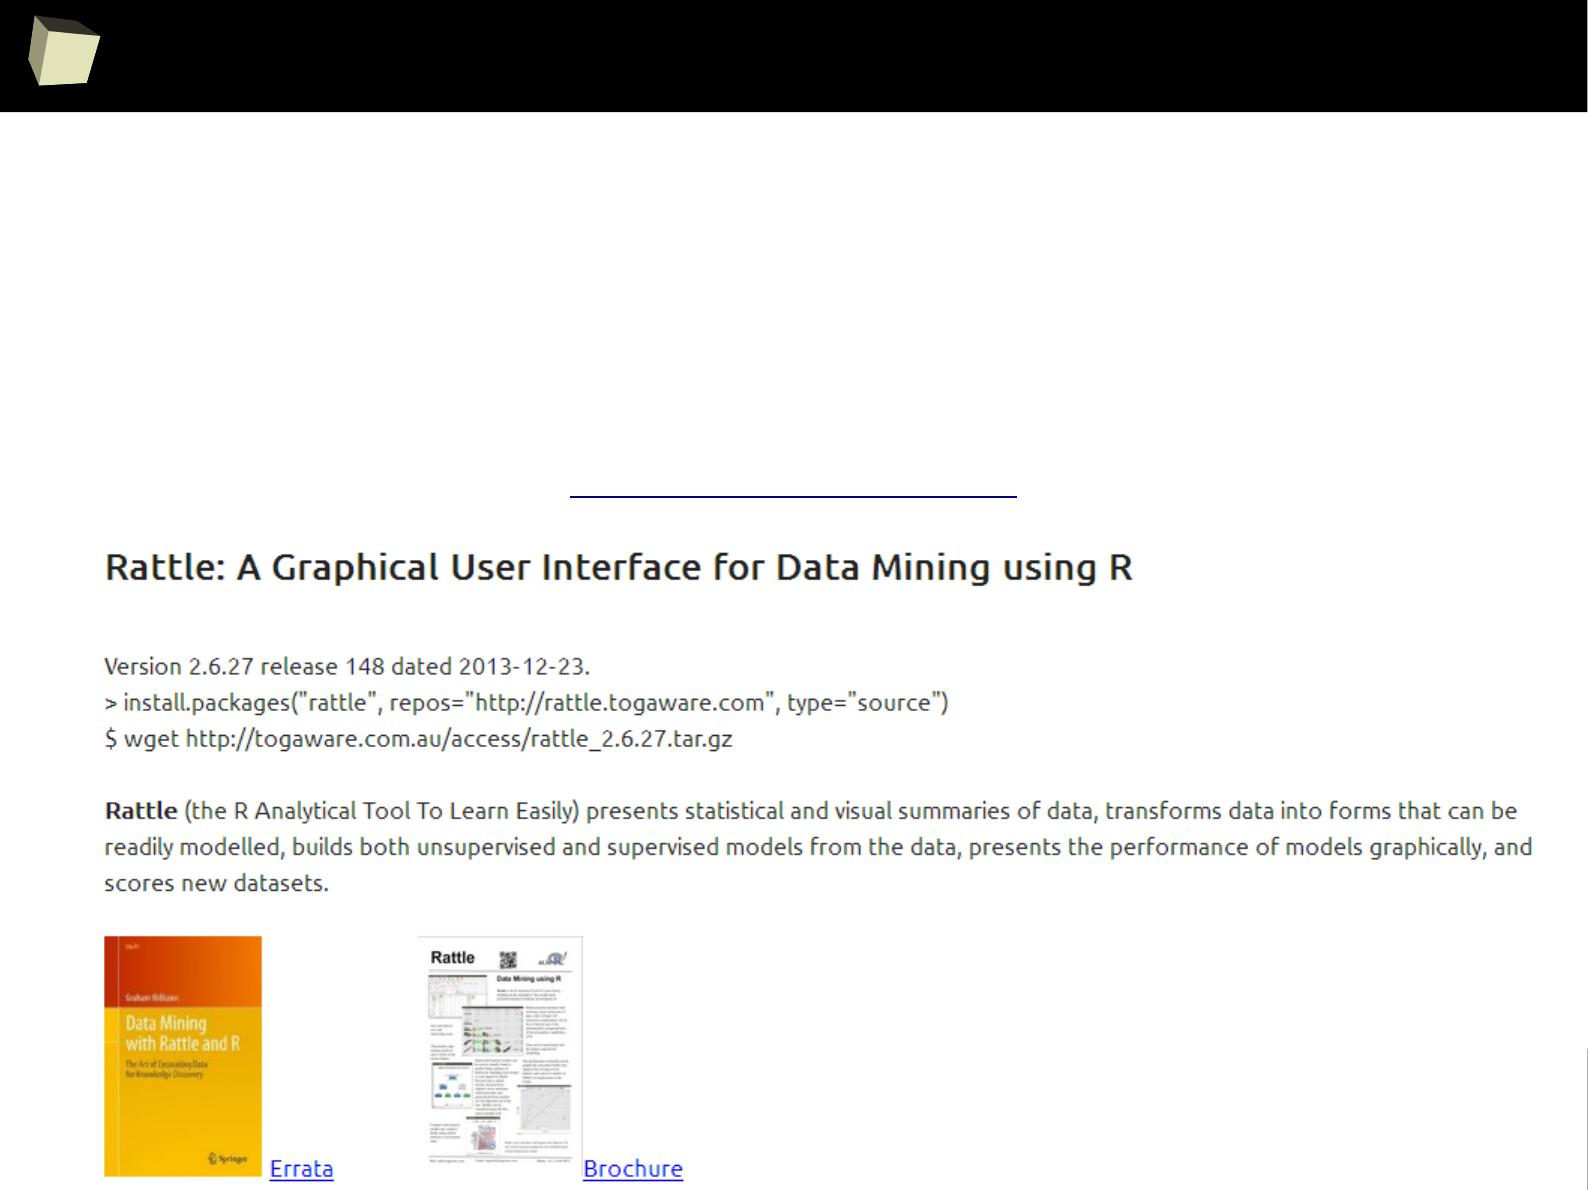
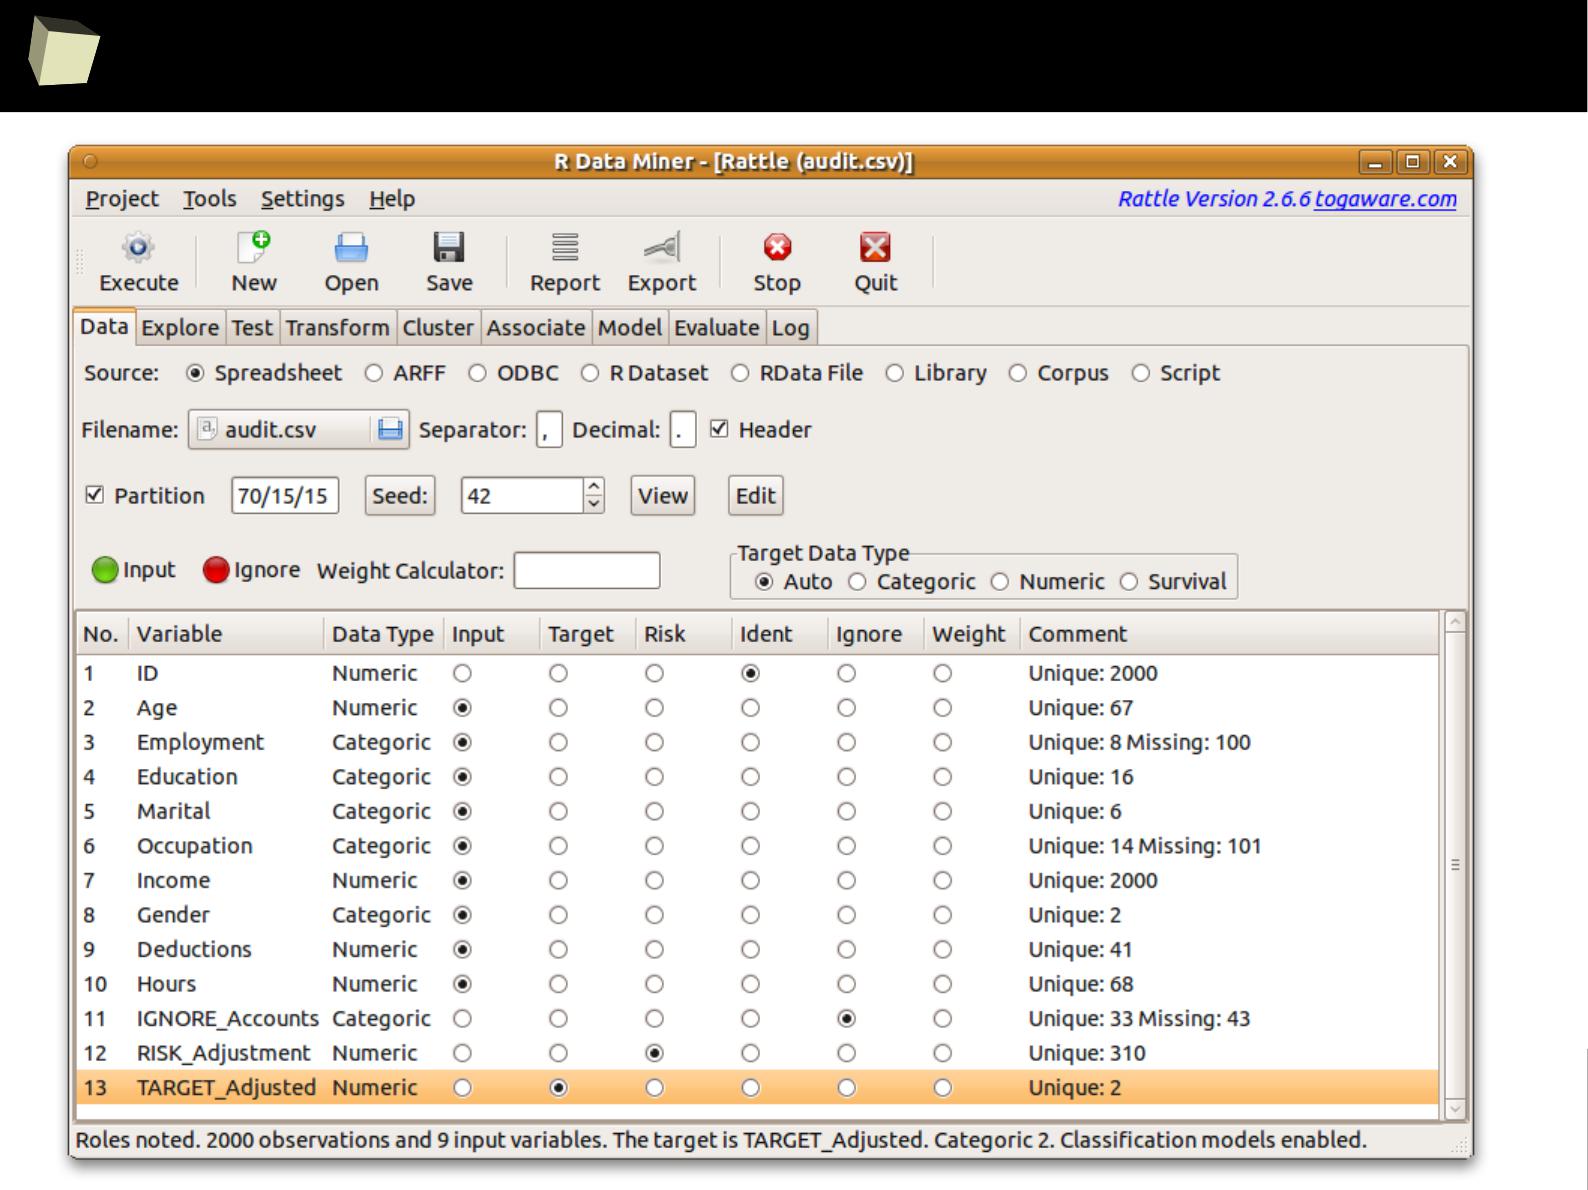
3
2
9
Rattle your data
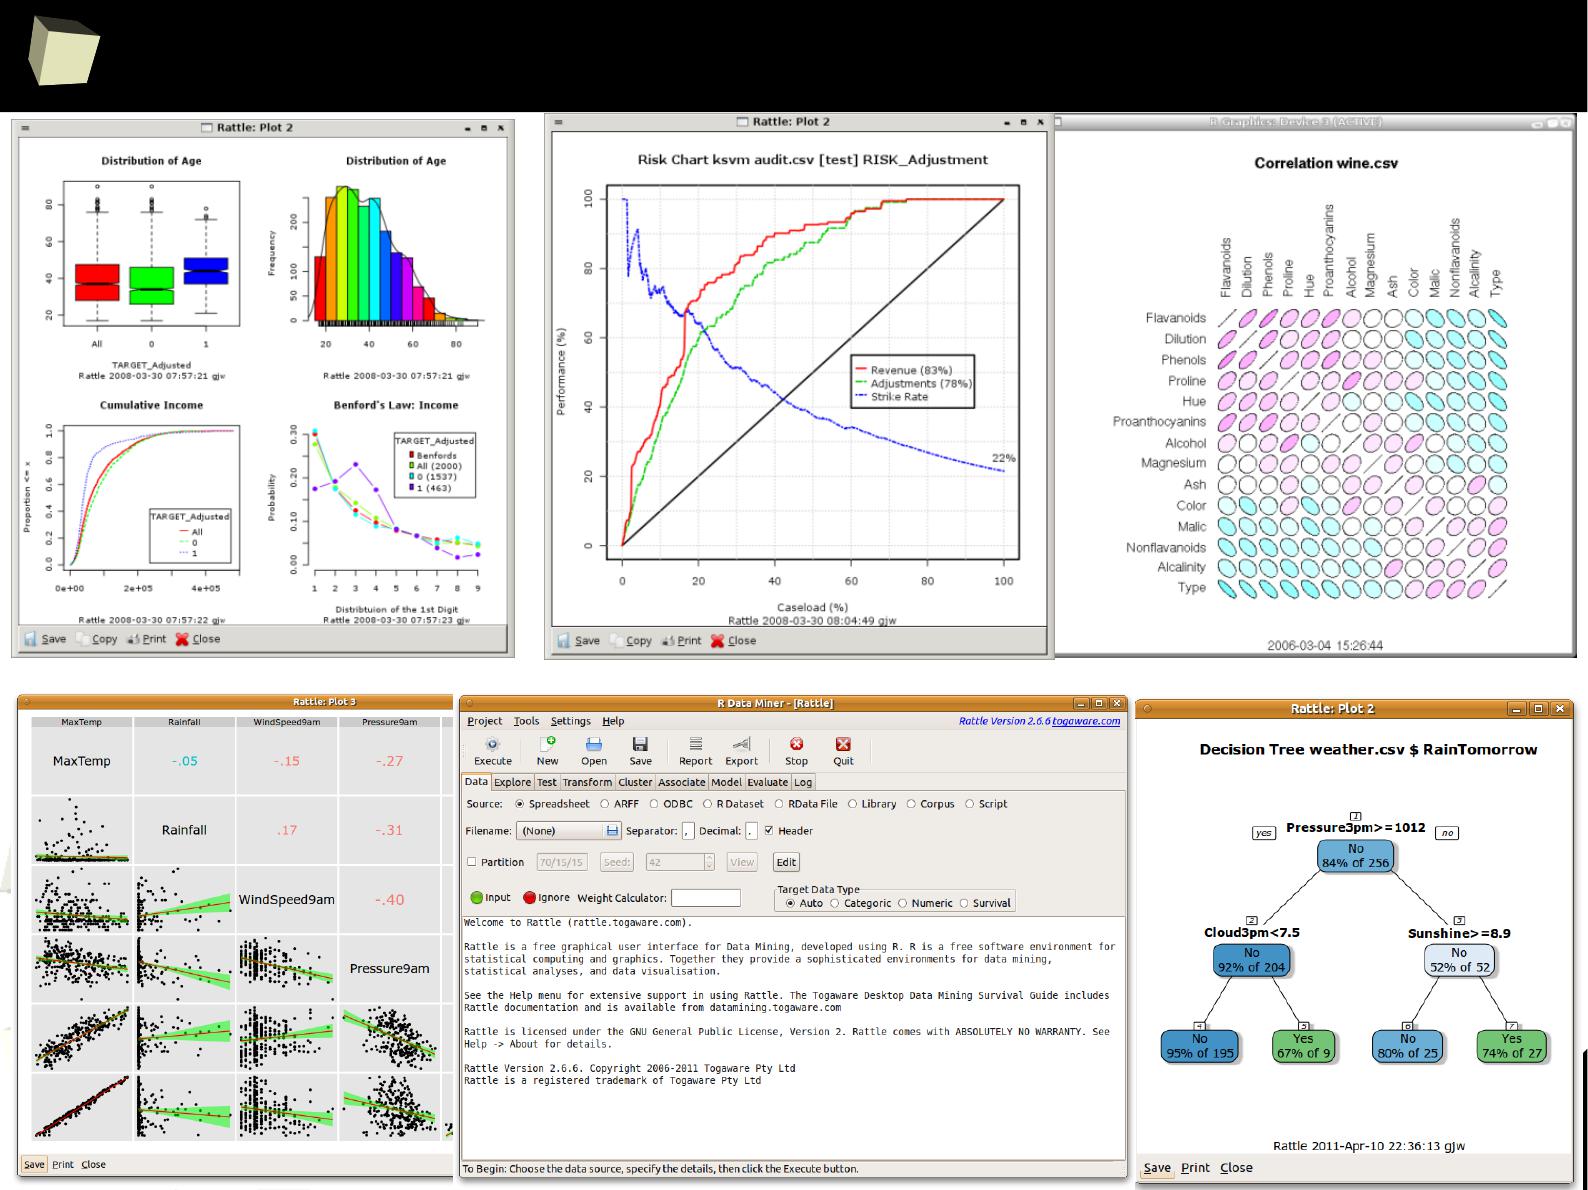
3
3
0
Rattle your data
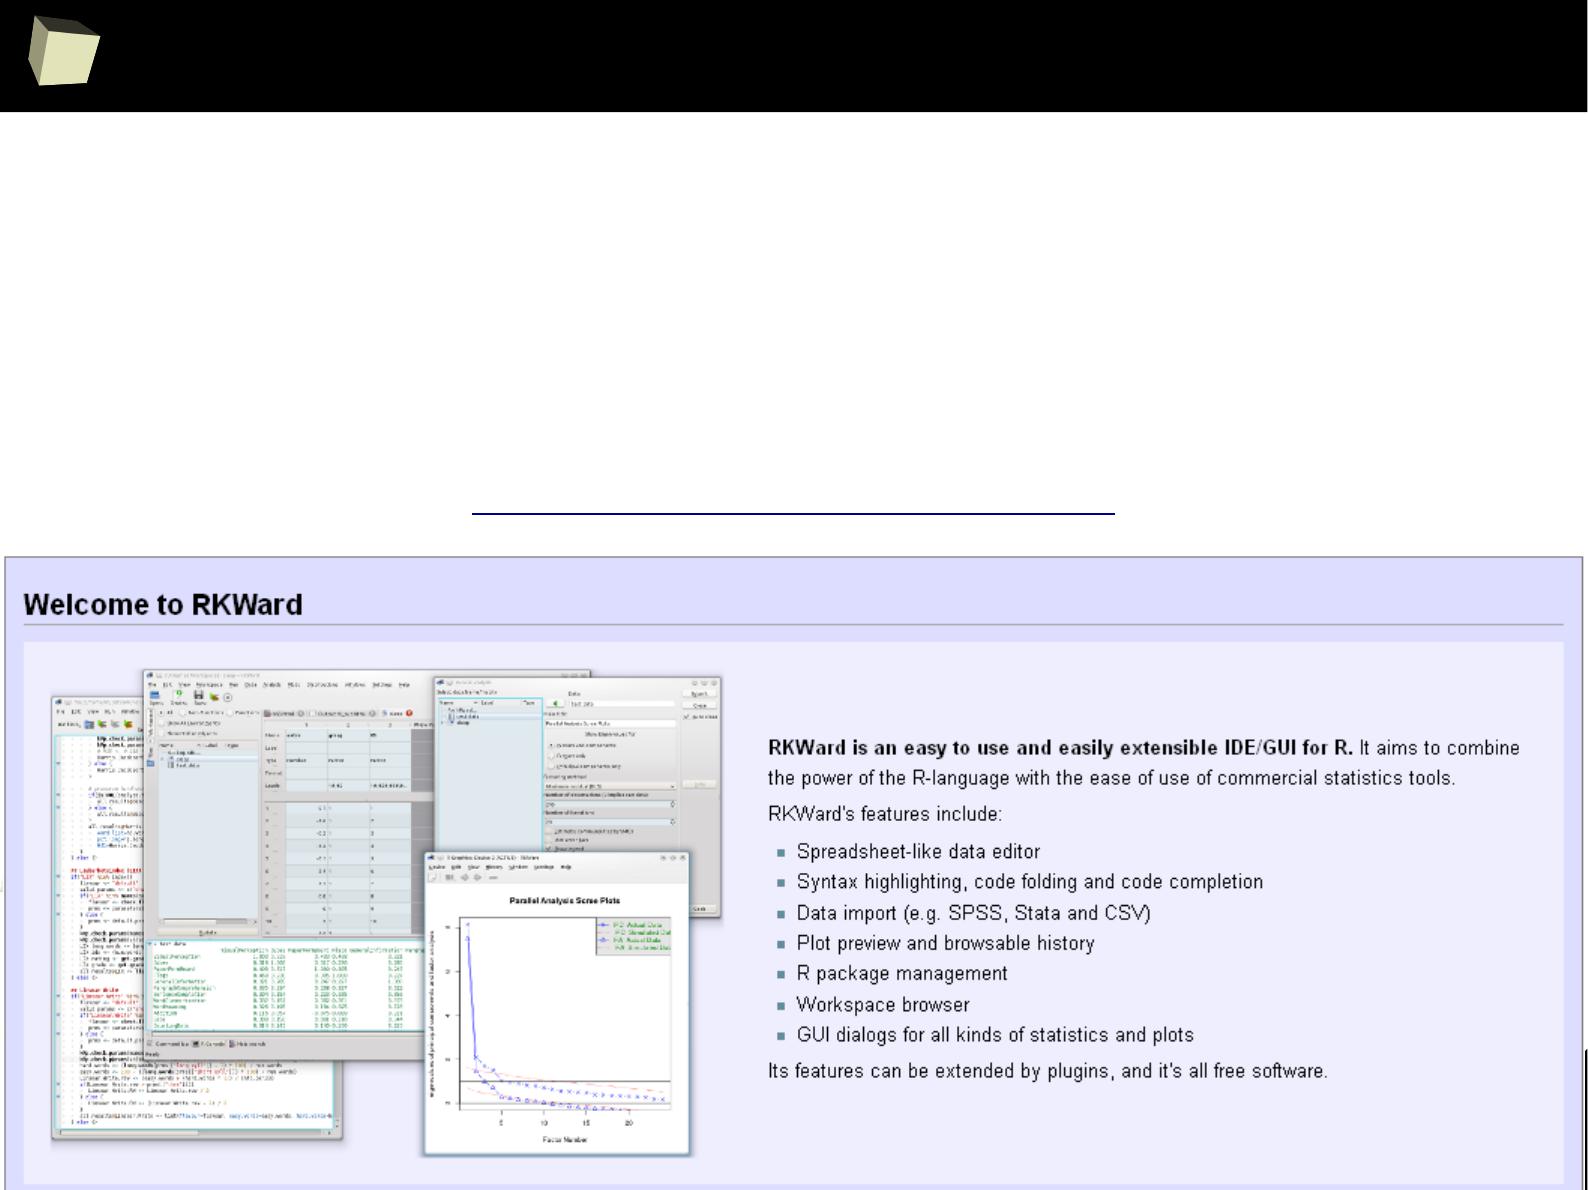
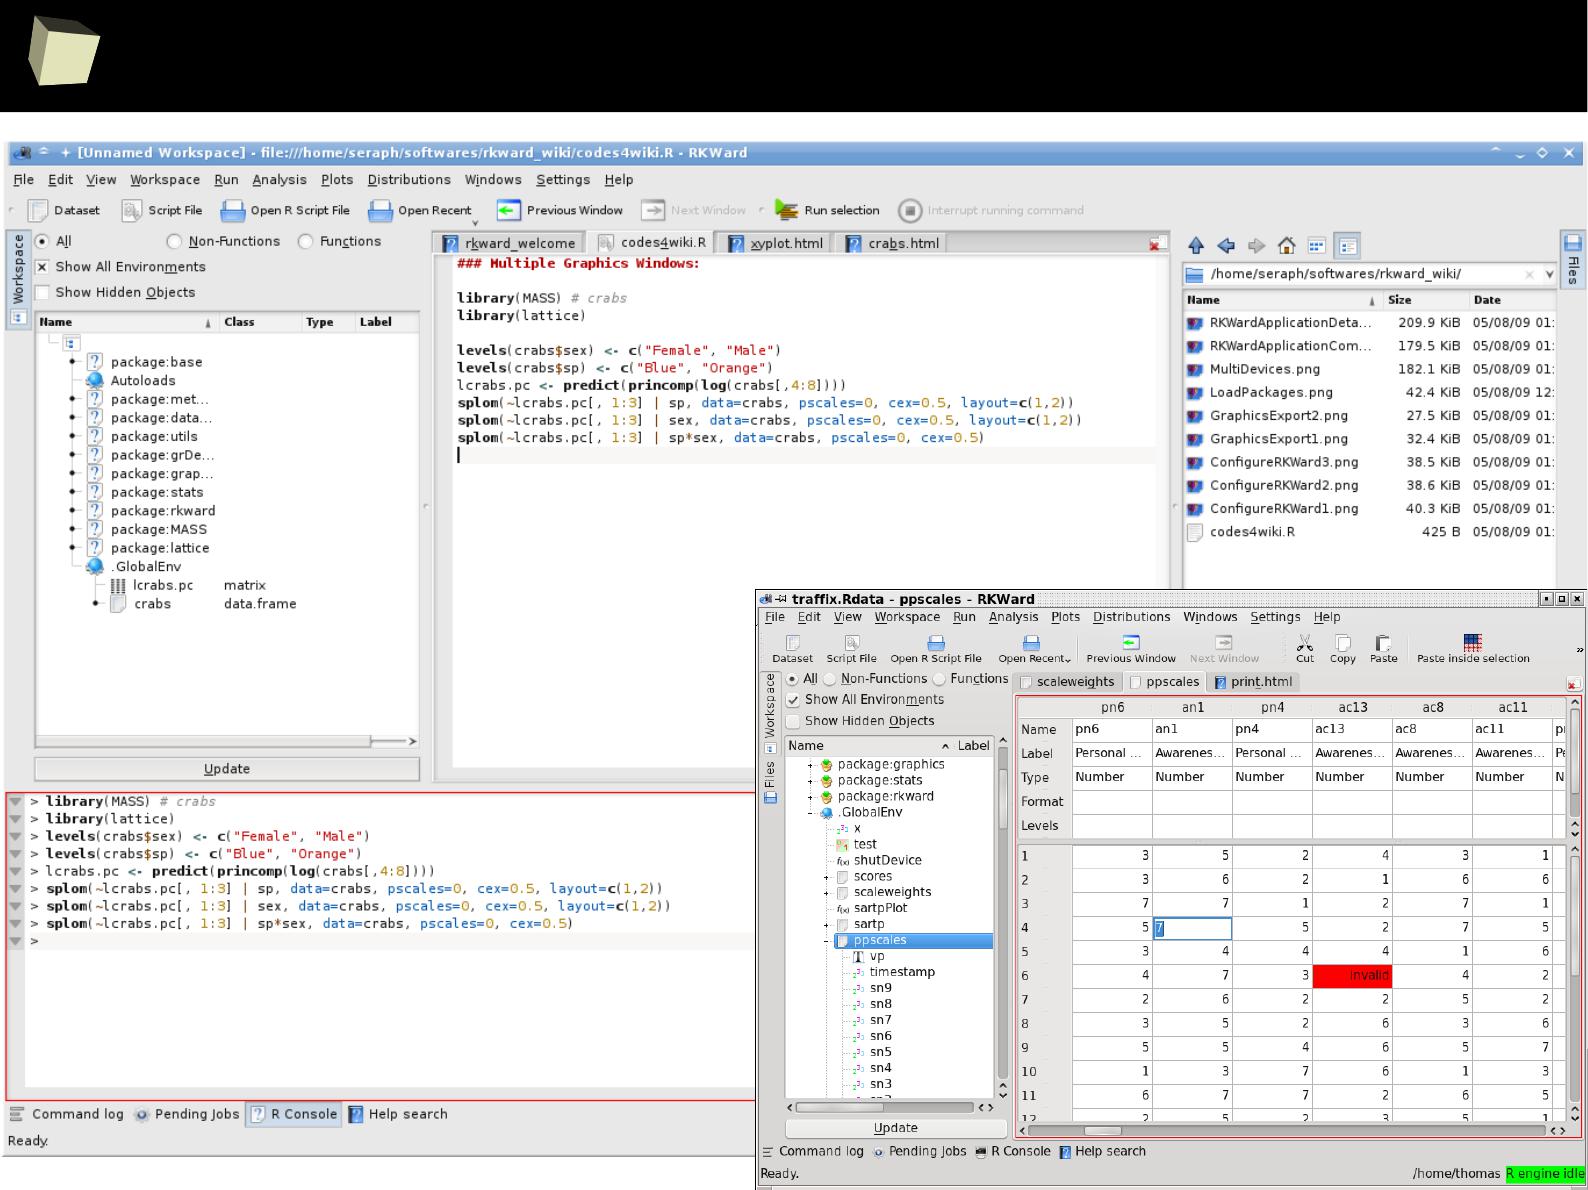
3
3
2
RKward
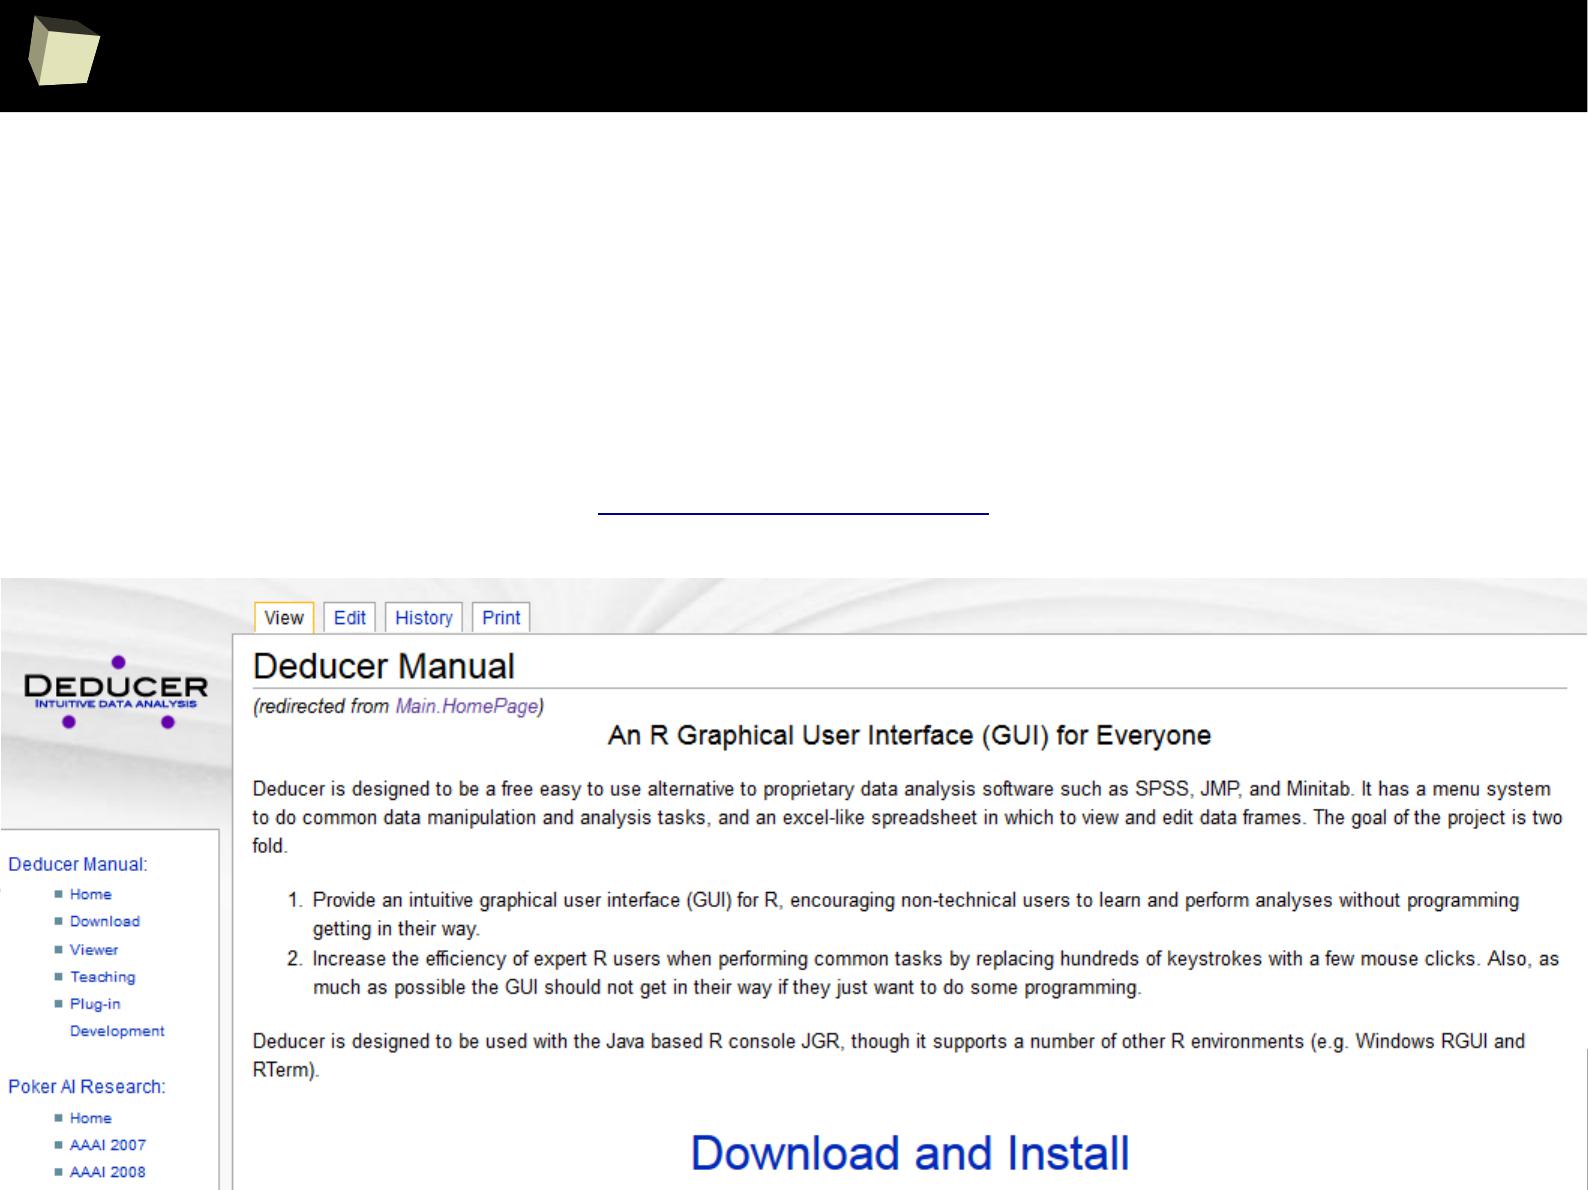
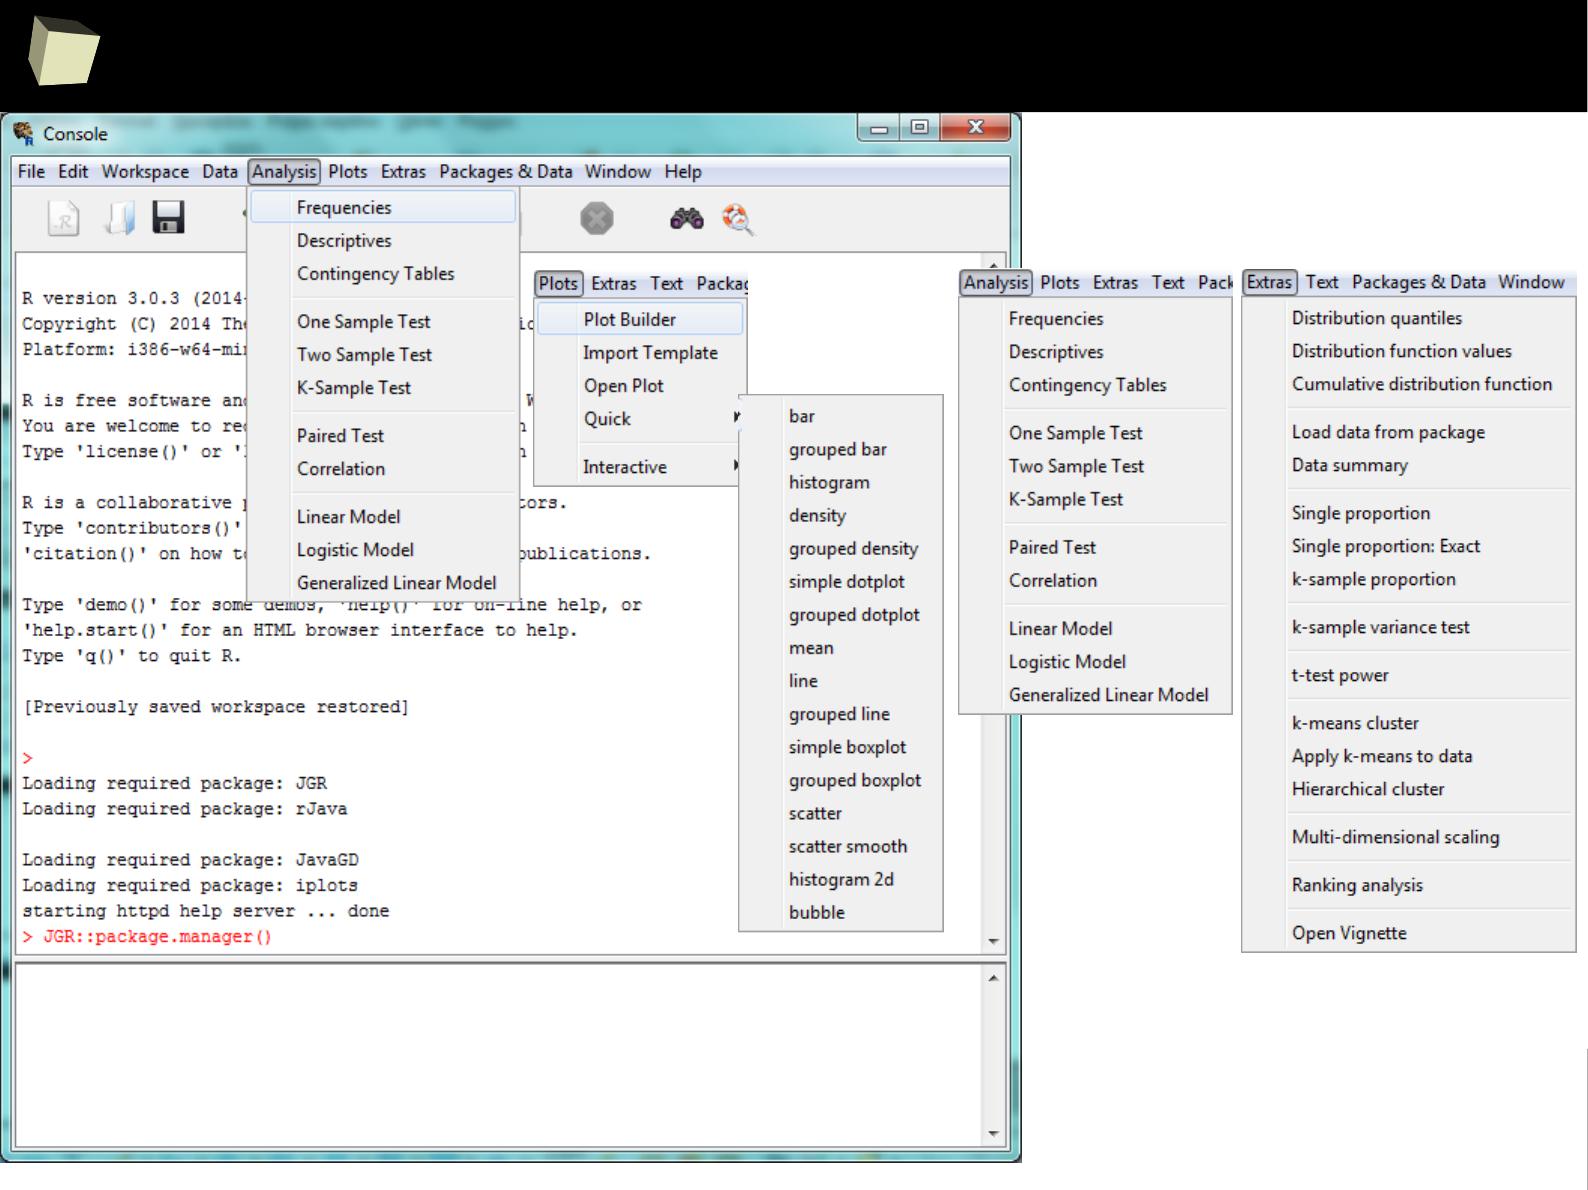
3
3
4
Deducer
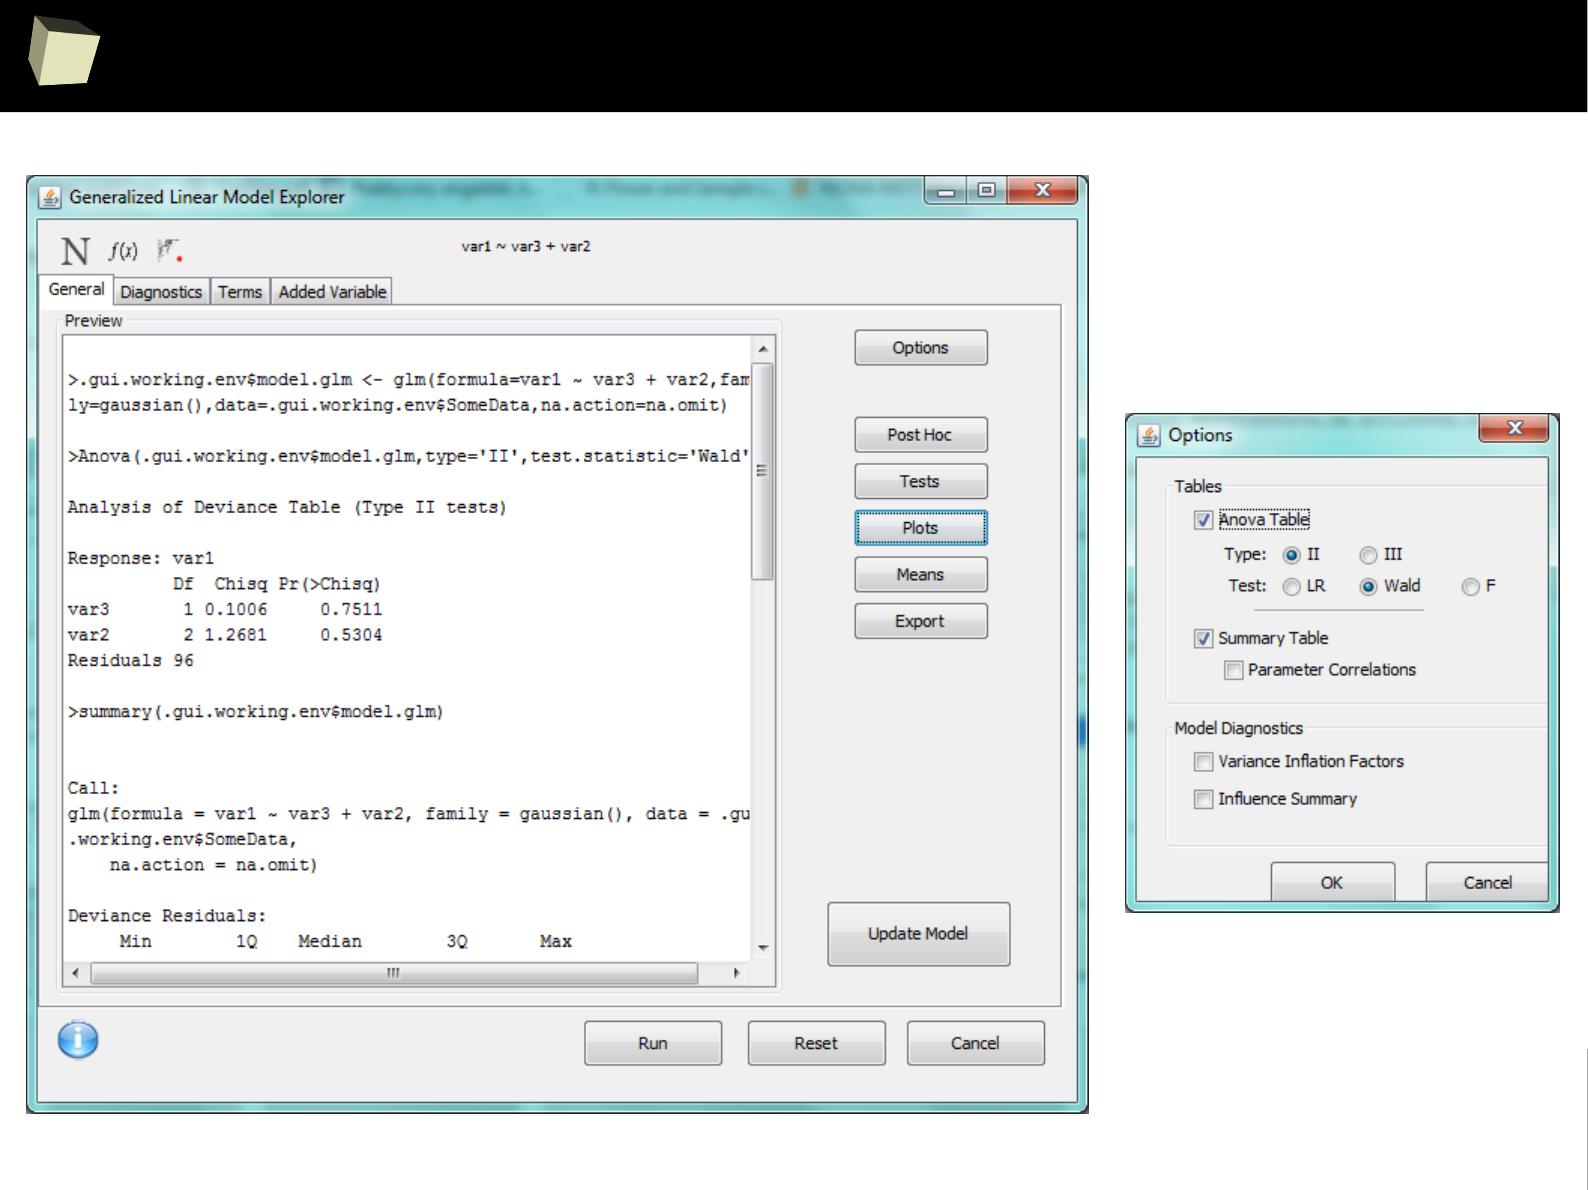
3
3
5
Deducer
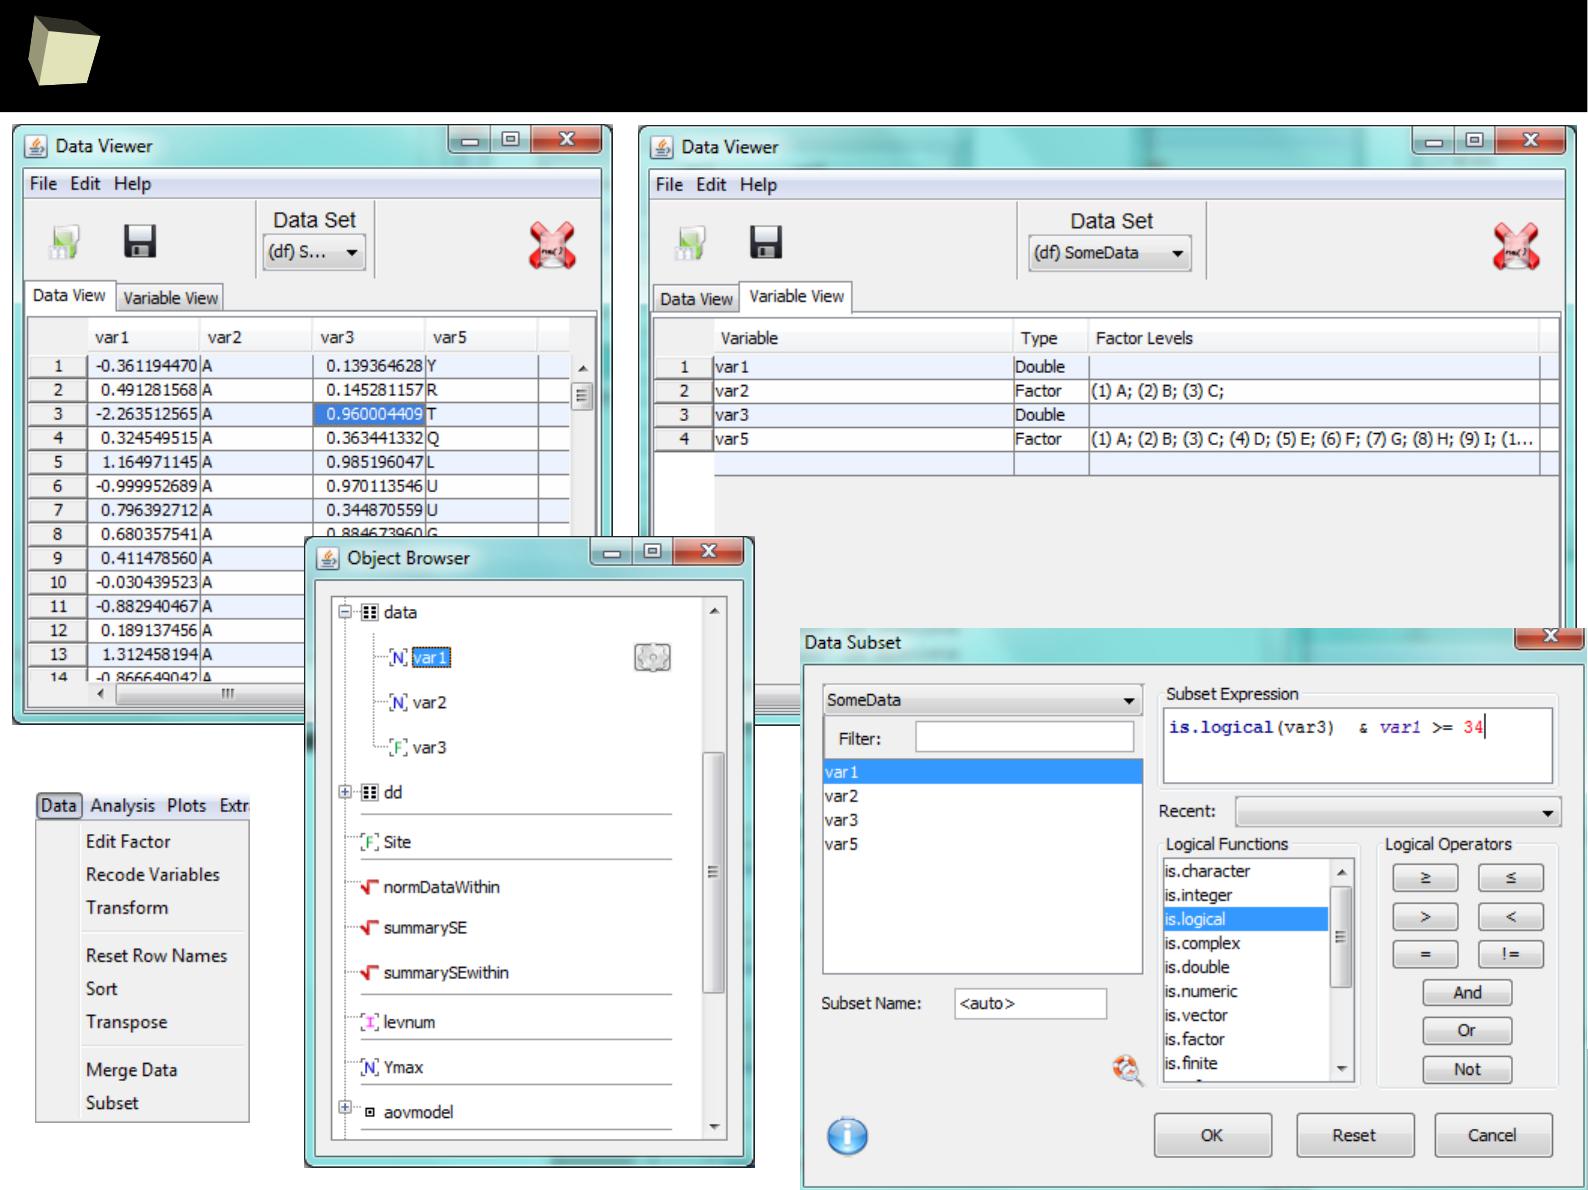
3
3
6
Deducer
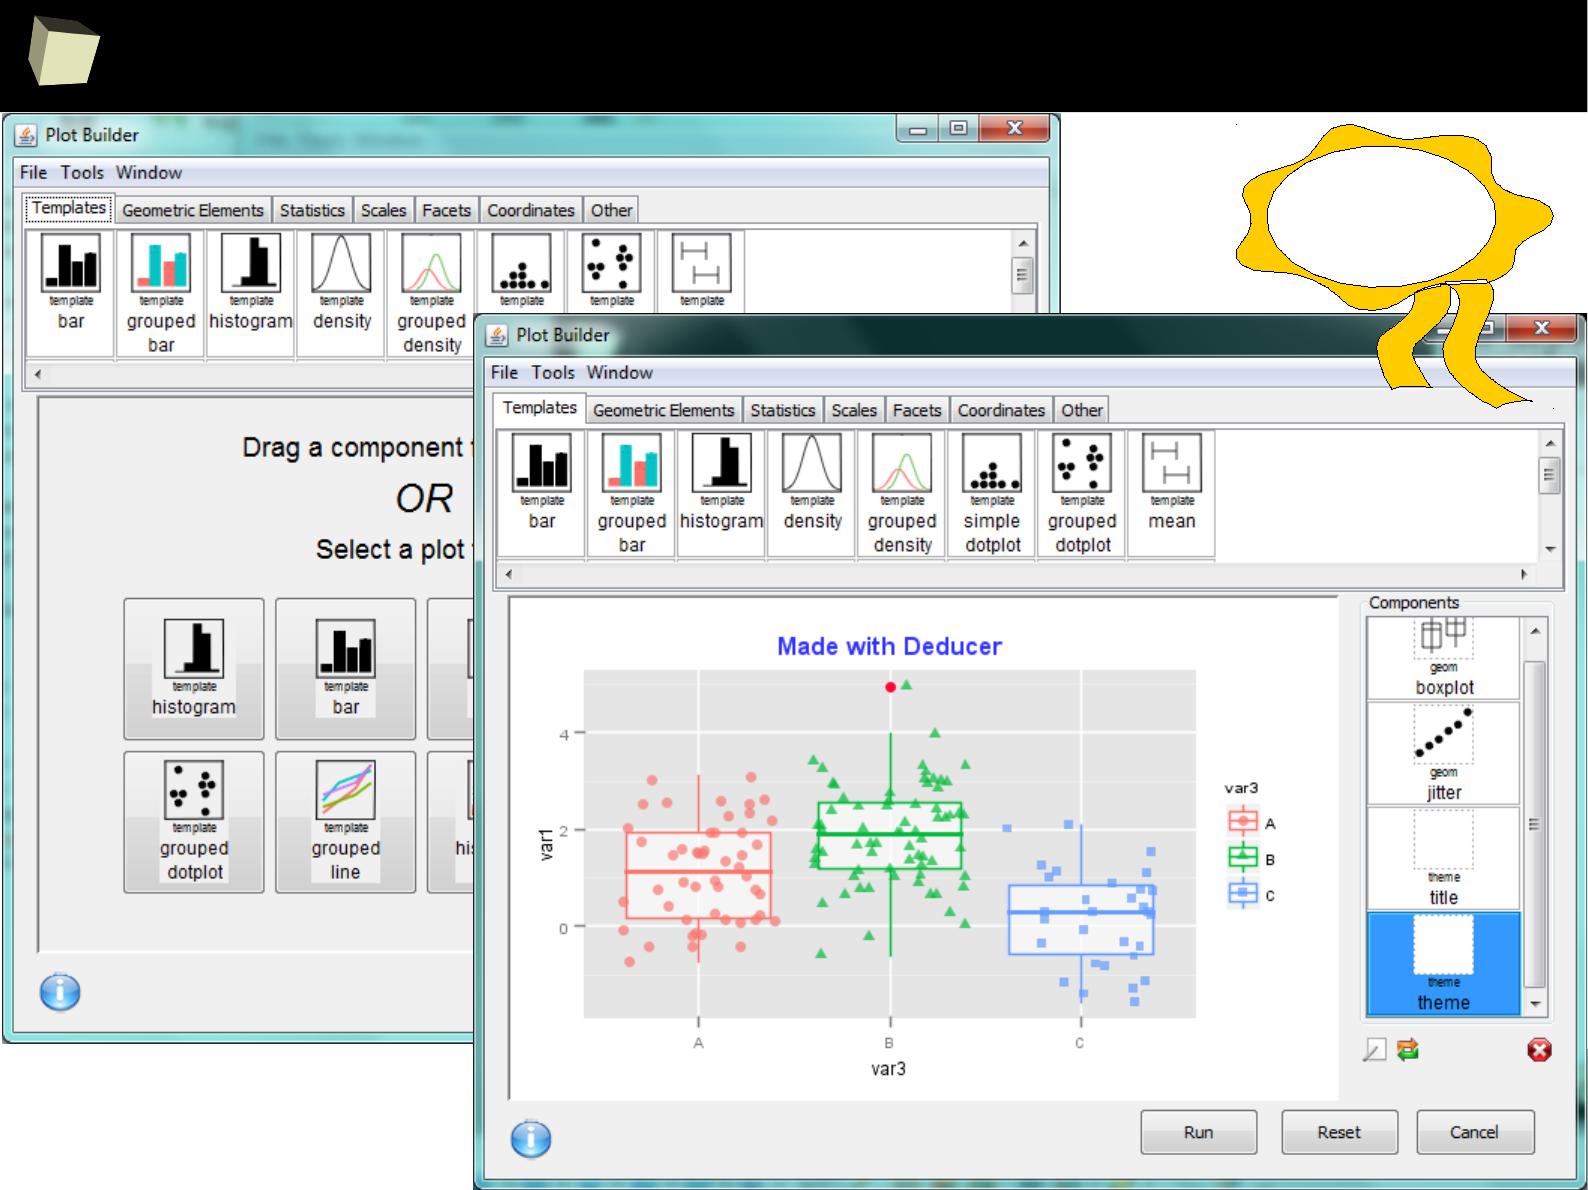
3
3
7
Deducer
Must have
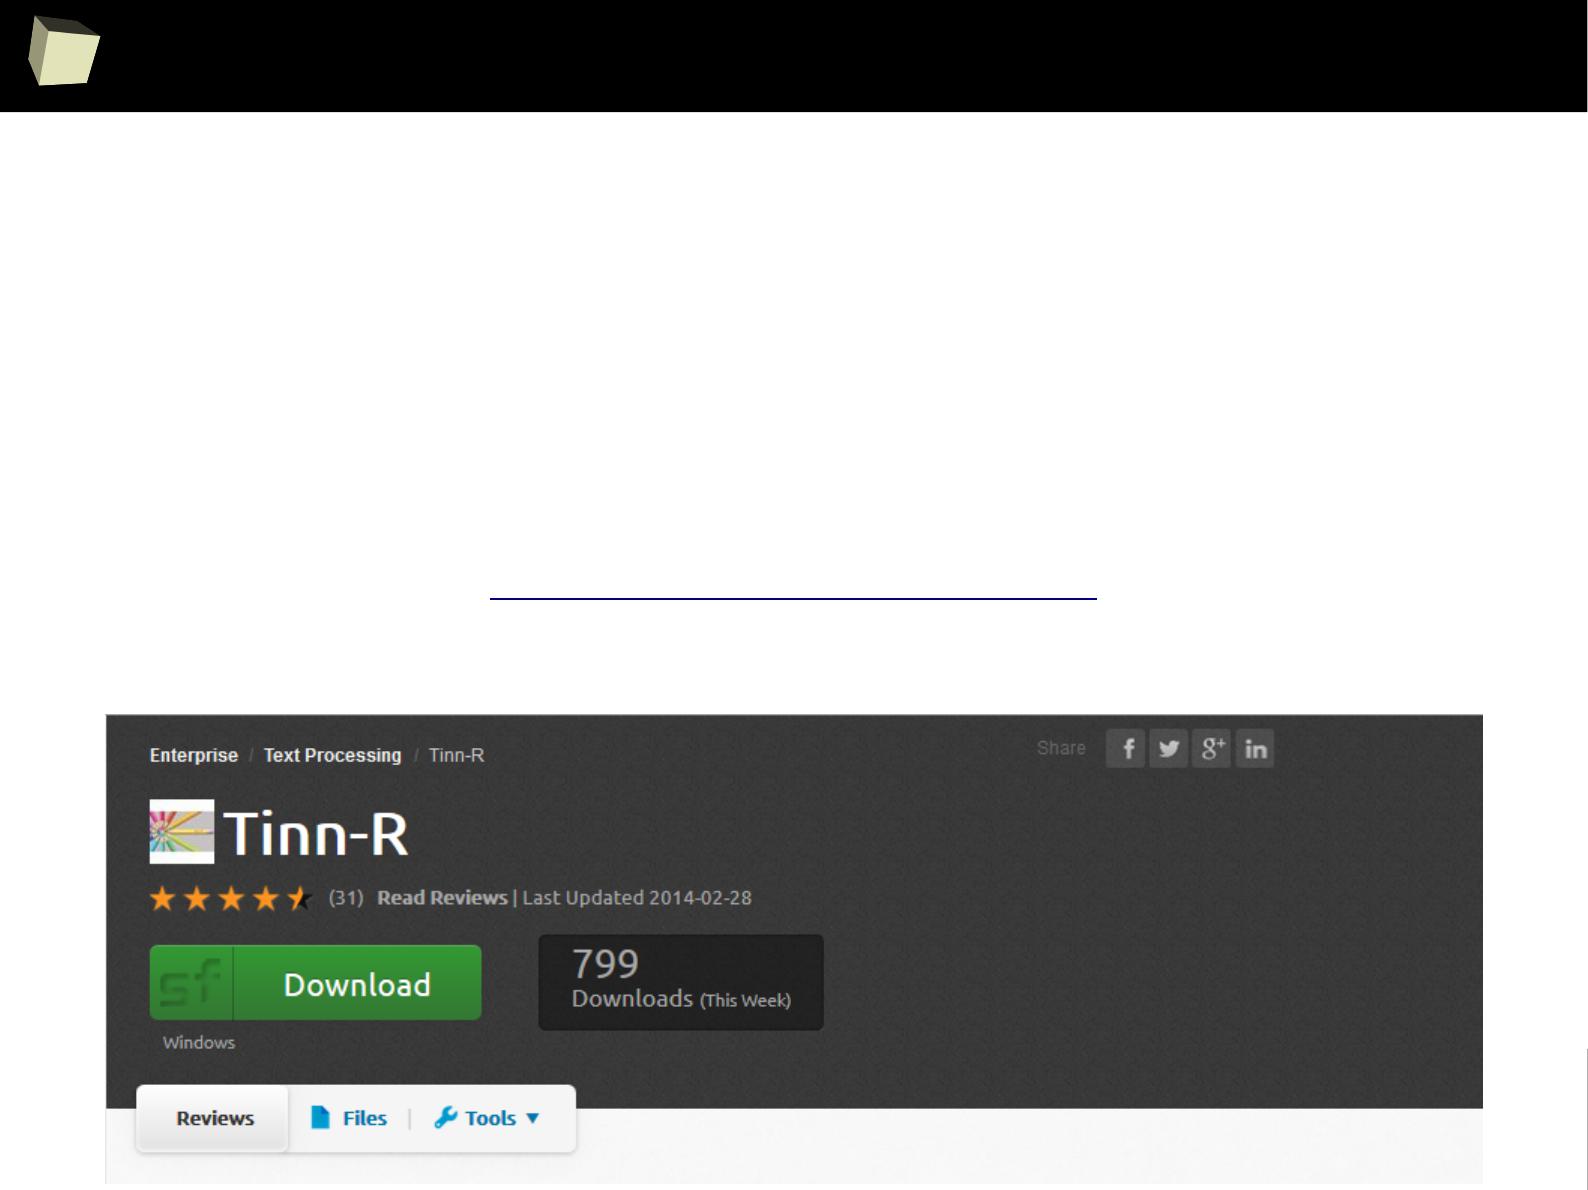
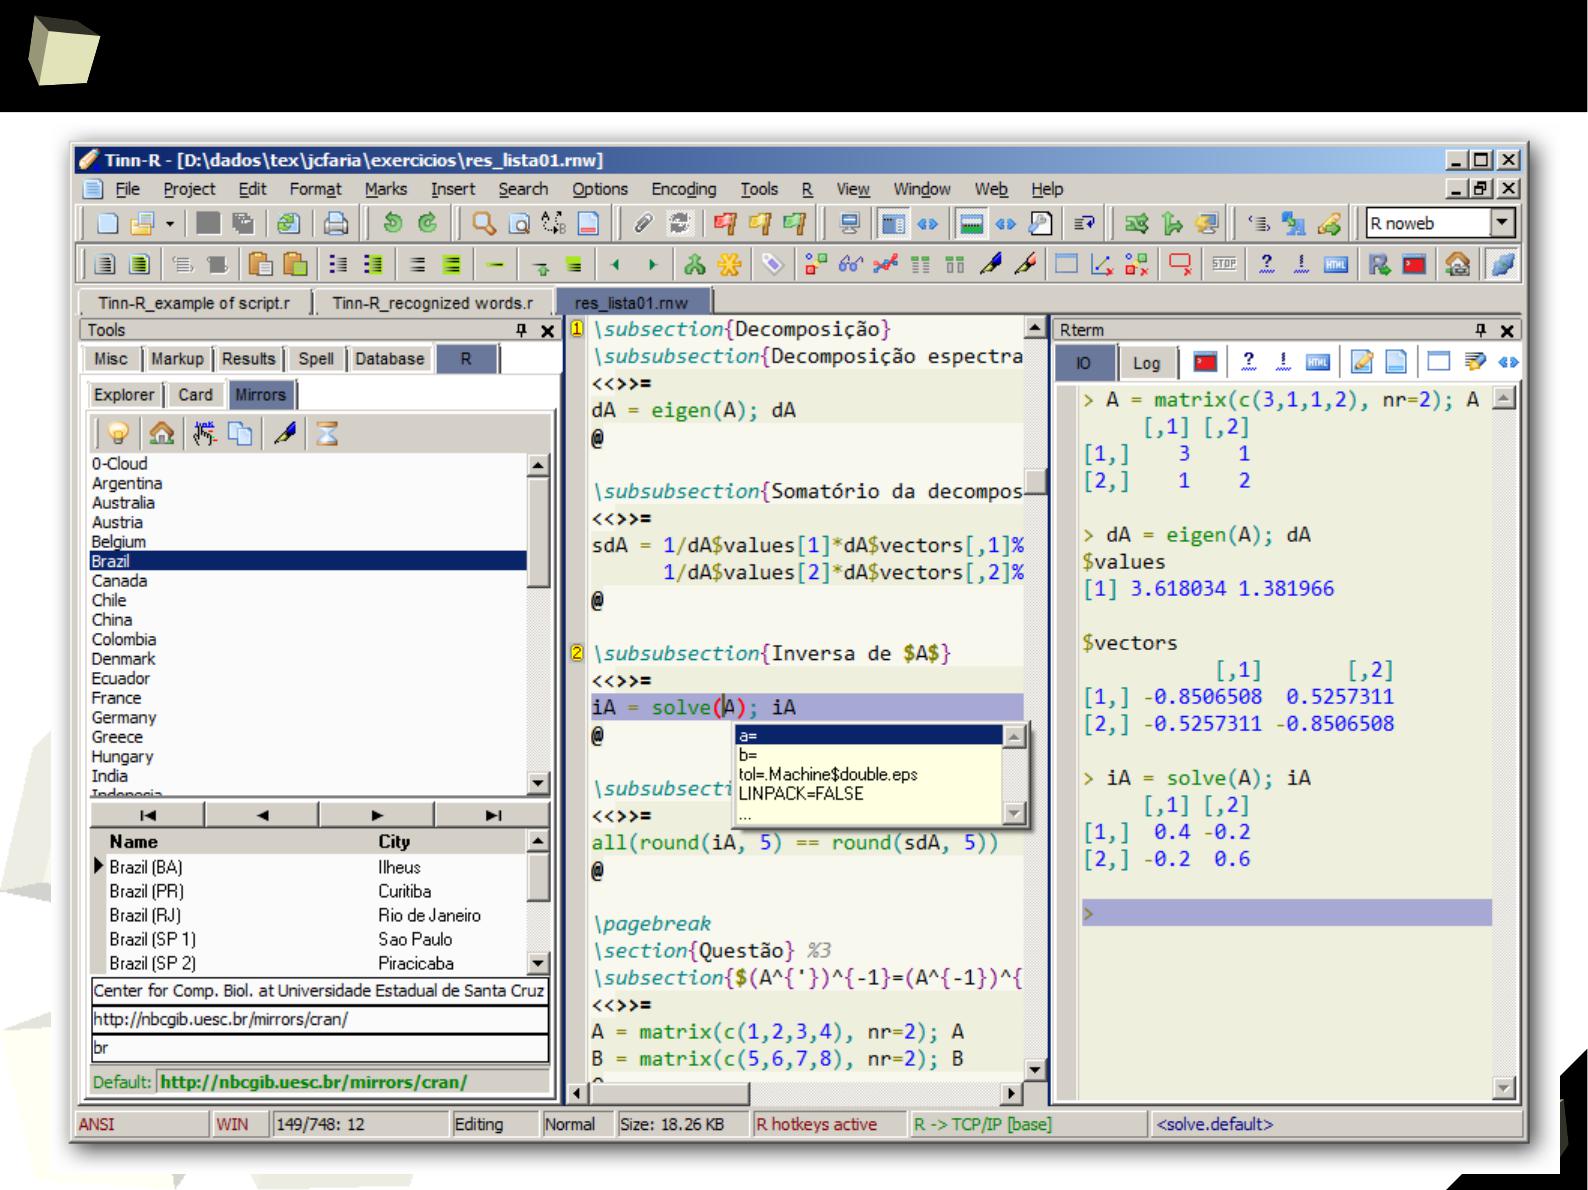
3
3
9
TinnR
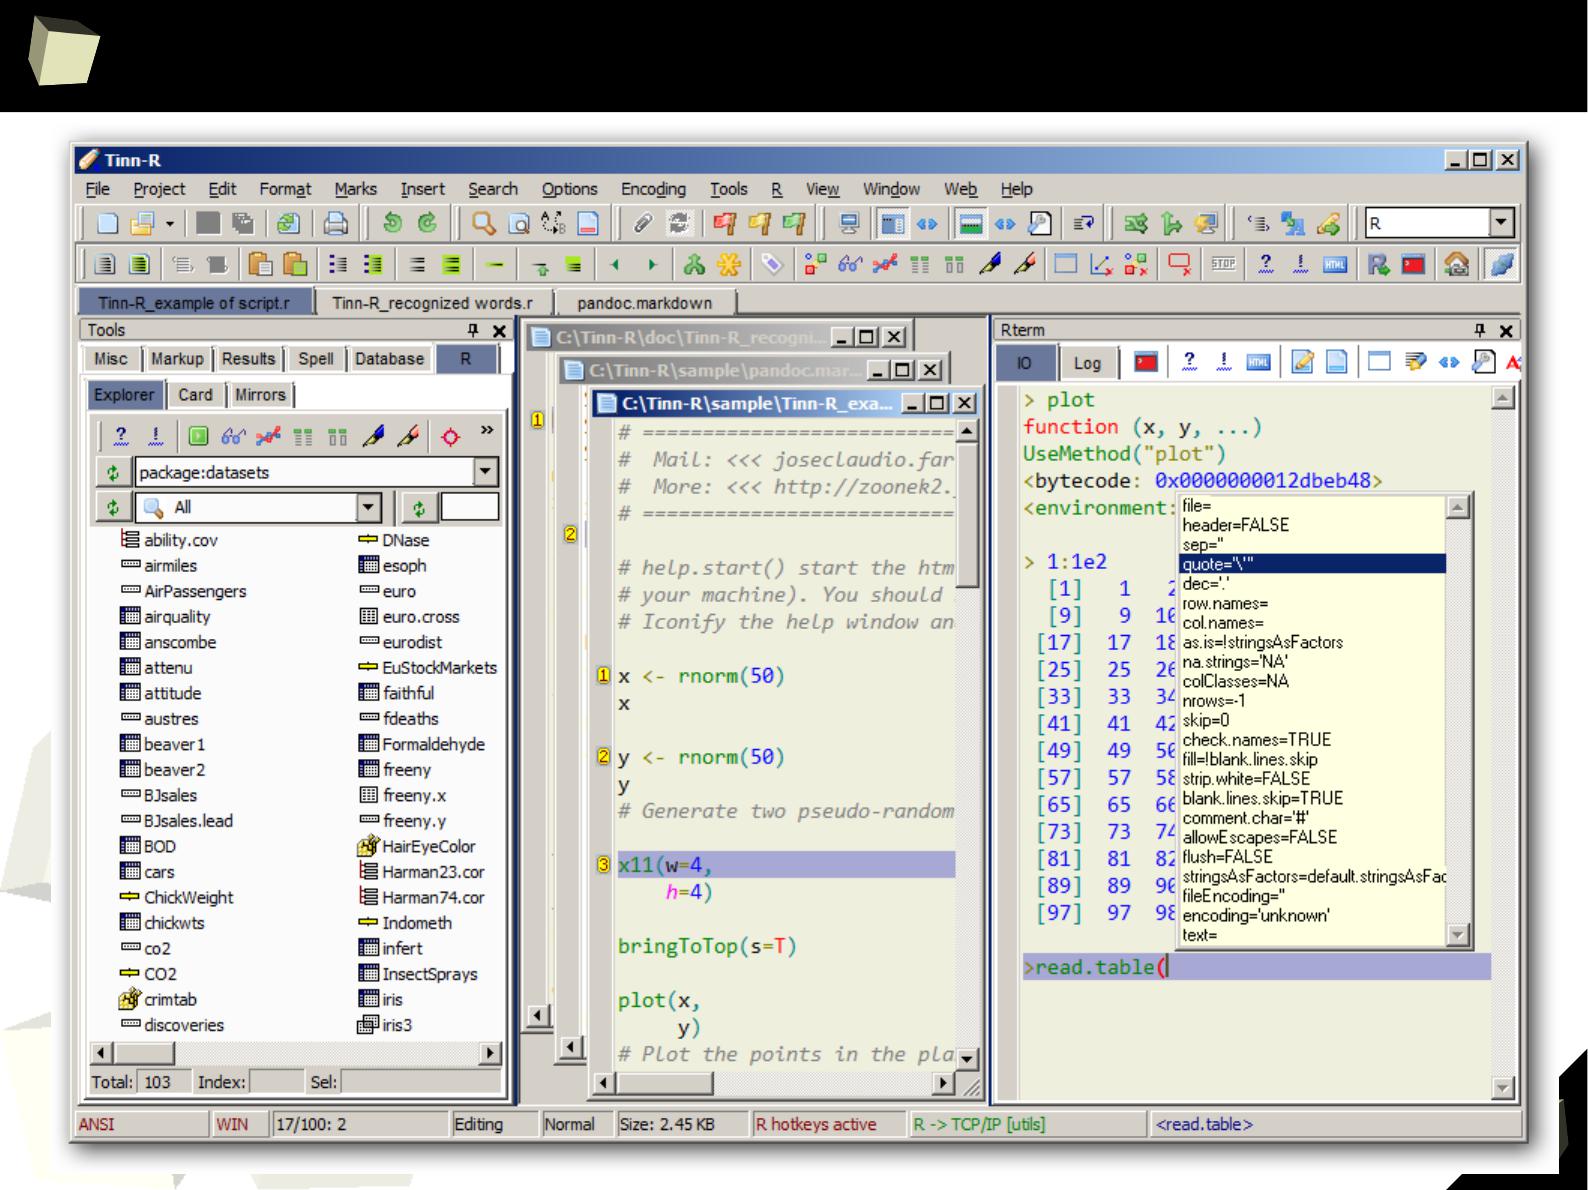
3
4
0
TinnR
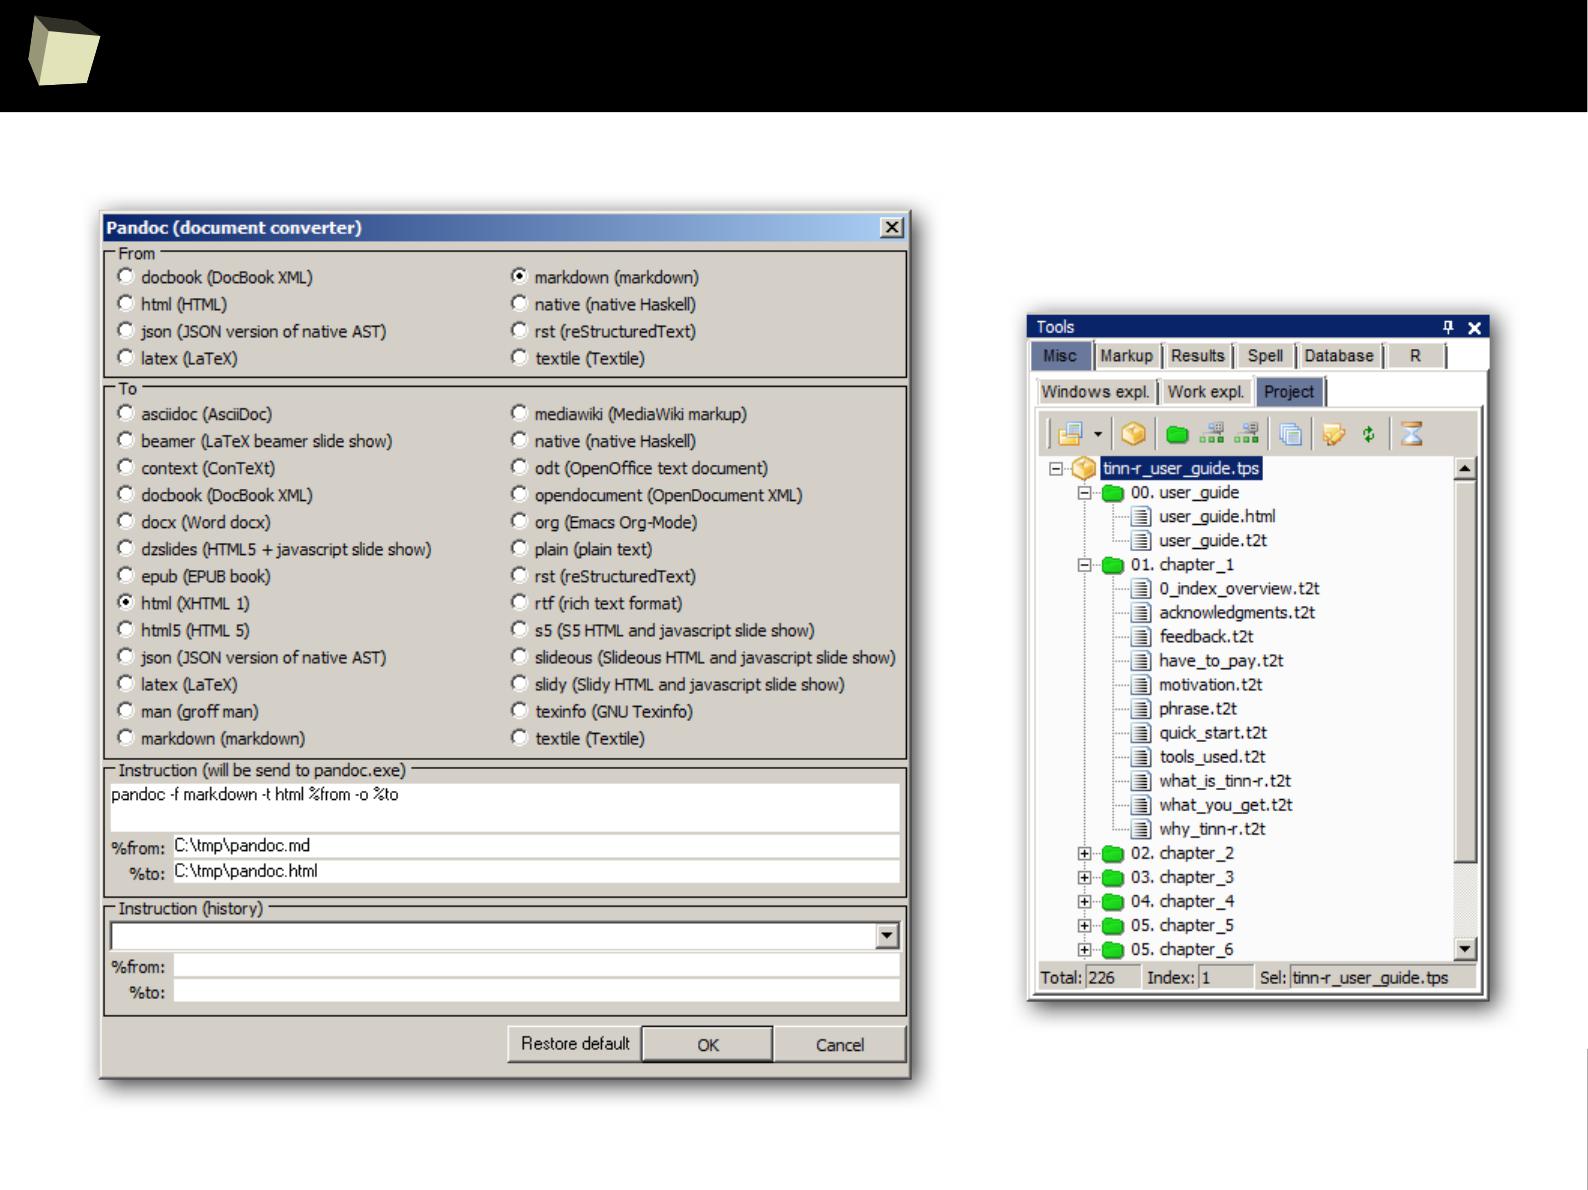
3
4
1
TinnR

3
4
2
13 reasons why you will love GNU R
I R is (extremely) cheap. In fact - it's free :)
II R has (extremely) wide range of capabilities
III R is (widely) supported by the world of science
IV R is supported by the community
V R is (increasingly) supported by the business
VI R is able to read data in many formats
VII Interoperability is easy to achieve
VIII R is truly cross-platform
IX R offers numerous ways of presenting data
X There are many options to optimize the code
XI R is able to handle large amount of data
XII R has a set of fancy tools and IDEs
XII FDA accepted using R for drug trials!
3
4
3
FDA: R is OK for drug trials!
http://tinyurl.com/fda-r-ok
In a poster presented at the UseR 2012 conference, FDA biostatistician Jae
Brodsky reiterated the FDA policy regarding software used to prepare
submissions for drug approvals with clinical trials: Sponsors may use R in their
submissions. […] SAS is not required to be used for clinical trials.
The FDA does not endorse or require any particular software to be used for
clinical trial submissions, and there are no regulations that restrict the use
of open source software (including R) at the FDA.
Nonetheless, any software (R included) used to prepare data analysis from
clinical trials must comply with the various FDA regulations and guidances
(e.g. 21 CFR Part 11). Even MS Excel can be made “21 CFR 11 Compliant”.
The R Foundation helpfully provides a guidance document for the use of R in
regulated clinical trial environments, which provides details of the specific FDA
regulations and how R complies with them.
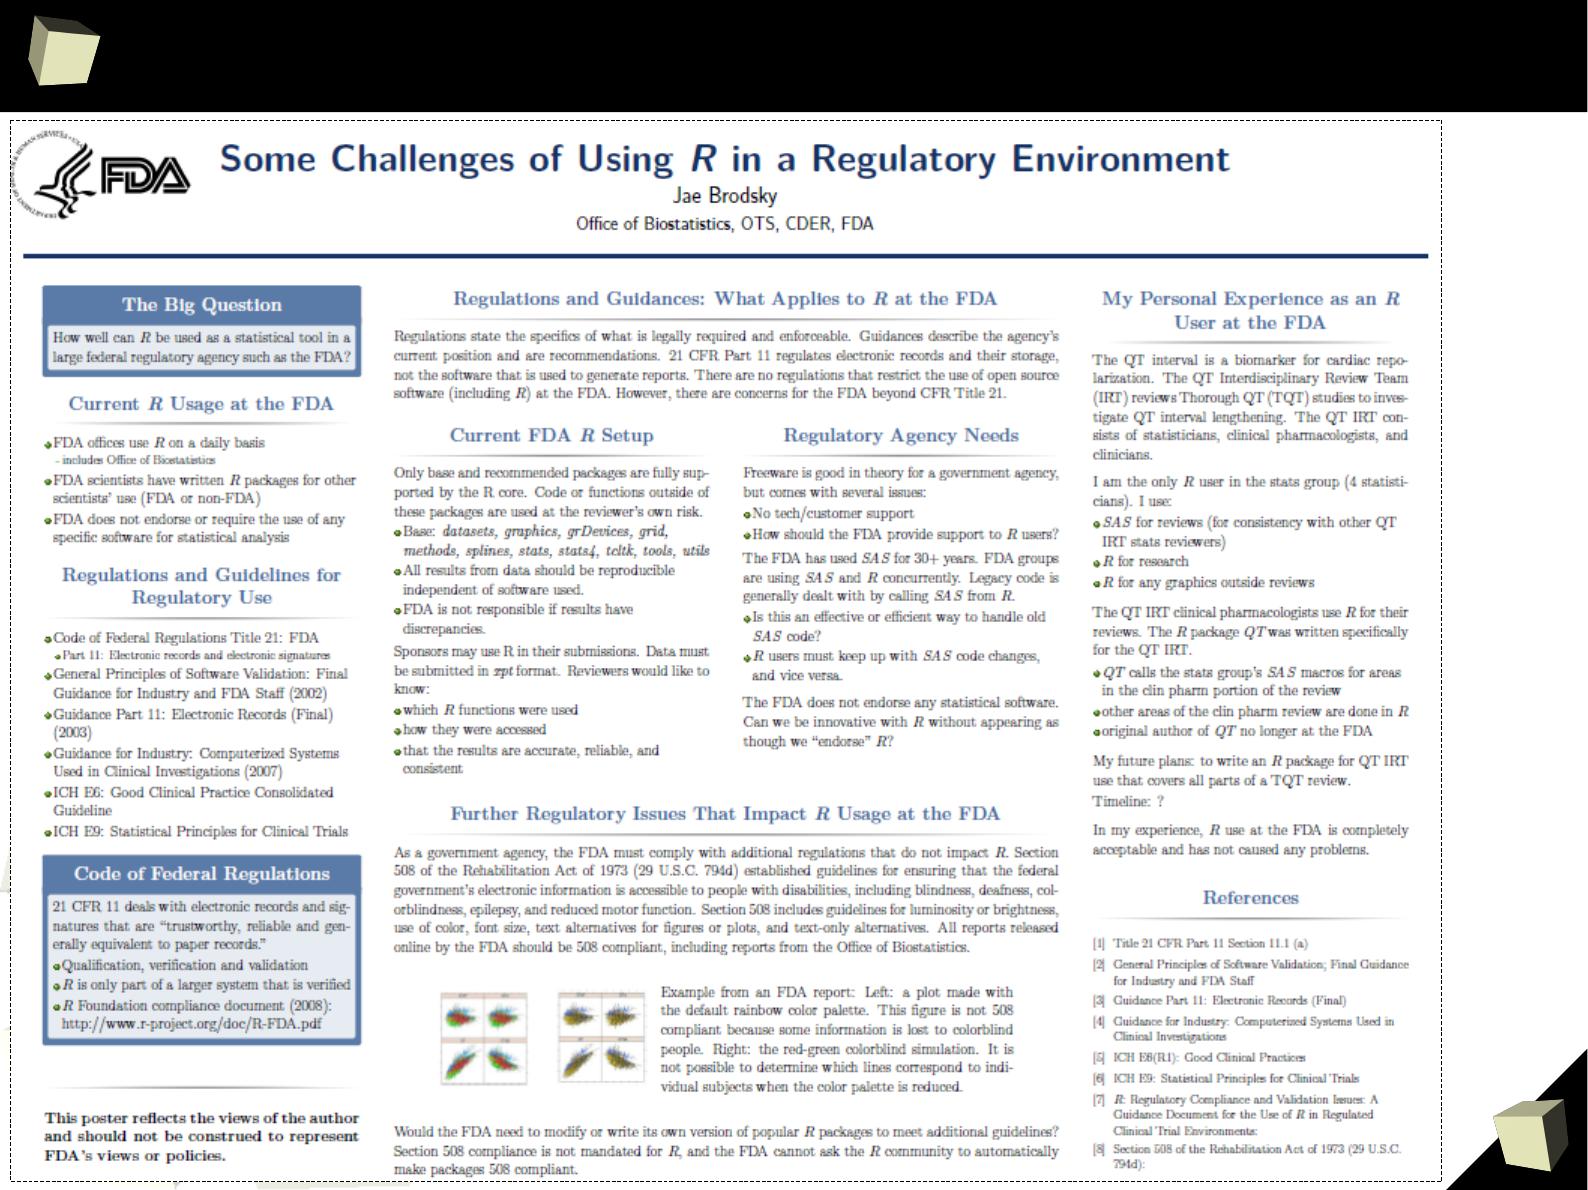
3
4
5
the (veRy important) poster
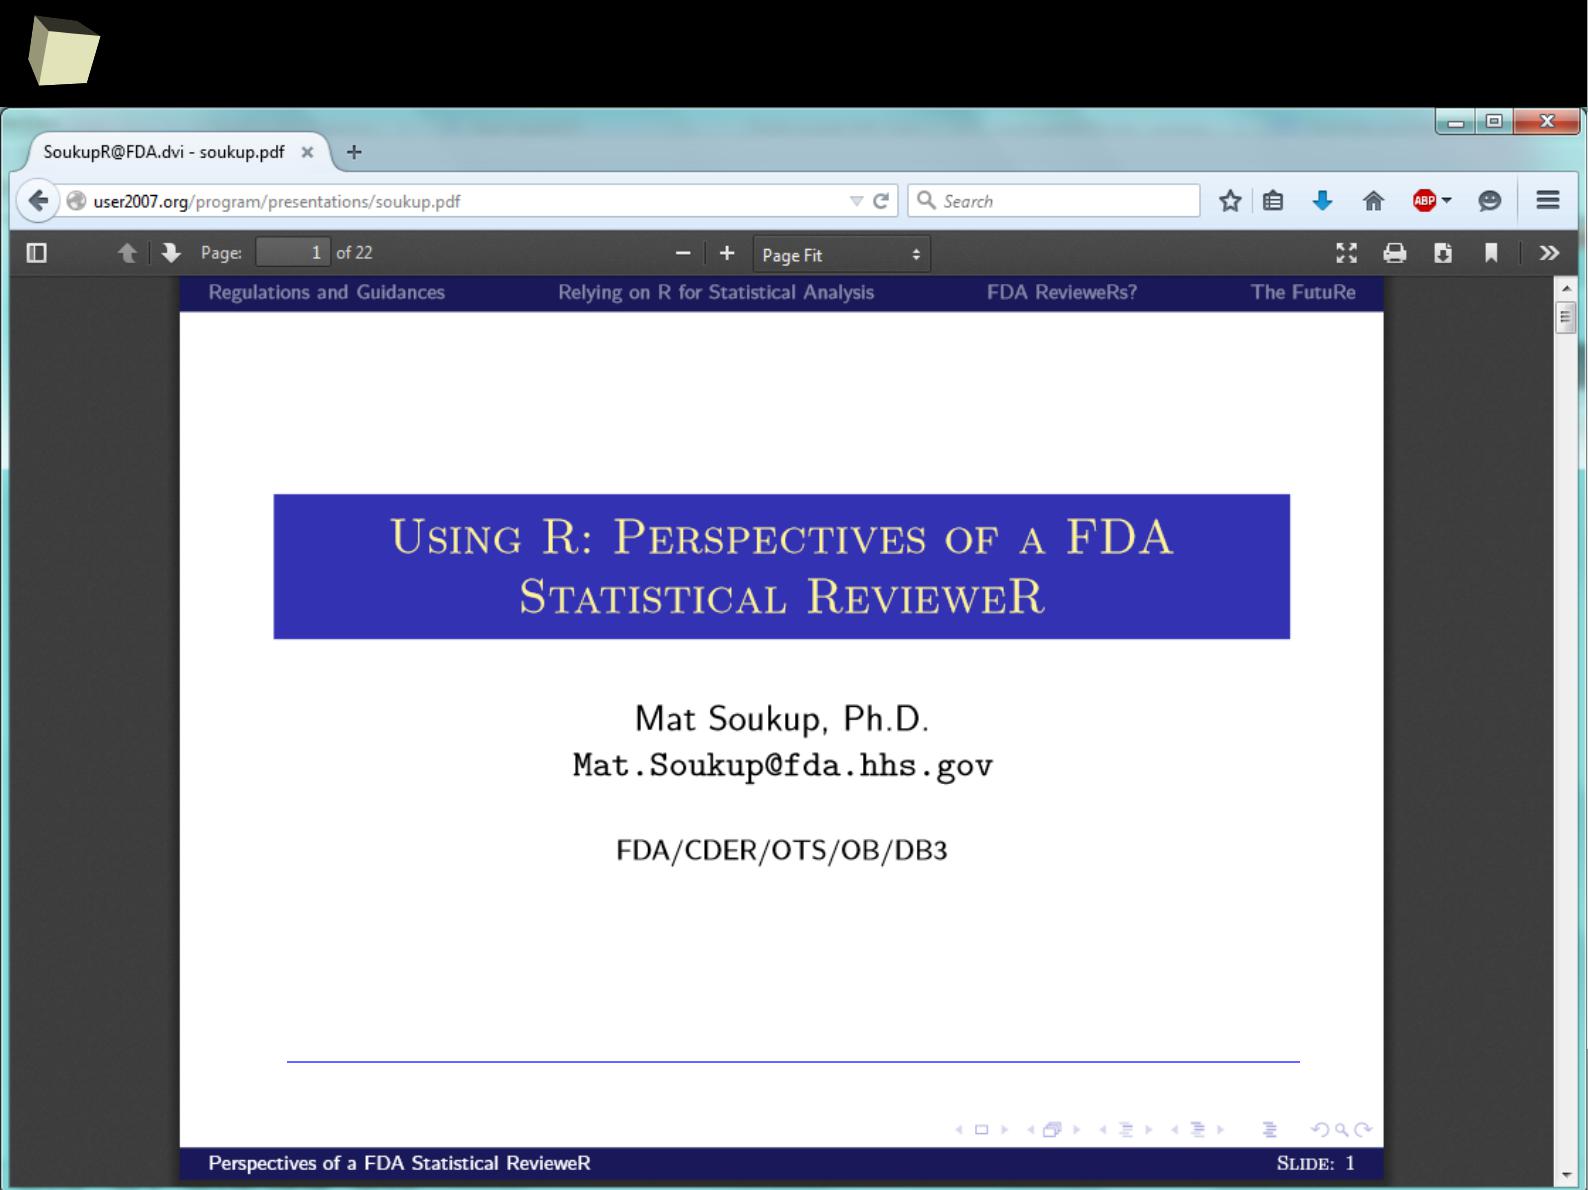
3
4
6
some important information
http://user2007.org/program/presentations/soukup.pdf

3
4
7
FurtheR impoRtant issues

3
4
8
furtheR impoRtant issues
I Handling metadata
II Handling ODM and CDA metadata
III Issue with multilingual data
IV Differences between SAS and R
V Implementation of useful SAS functions

3
4
9
Handling metadata
Briefly, metadata is data that describes other data.
Metadata can be used for:
●
Commenting and labeling (titling) objects (datasets, functions, graphs, tables)
●
Adding instructions of how the content of a variable should be rendered, e.g.:
●
number of decimal digits, format of dates and times, length of texts
●
format of outputted text: font name, color, size, style
●
dictionary of which values should appear instead of raw data (translation)
●
Searching purposes (keywords, tags)
Note: metadata doesn't change the underlying, raw value, it is just additional information.

3
5
0
Handling metadata
SAS uses metadata extensively to control how data is displayed. There are dozens of
formats and “informats” specific to literals, numbers, currencies, dates and times.
On the contrary, R doesn't use “formats”. There is no something like “numeric(10,2)”
or “char(20)”. Without additional efforts data is displayed “as is”.
There are only some options to control globally the number of decimal digits,
formatting dates or setting timezone.
> options("digits")$digit
[1] 7
> (x <- 12.3456789)
[1] 12.34568
> options(digits = 4)
> x
[1] 12.35
> x == 12.3456789
[1] TRUE
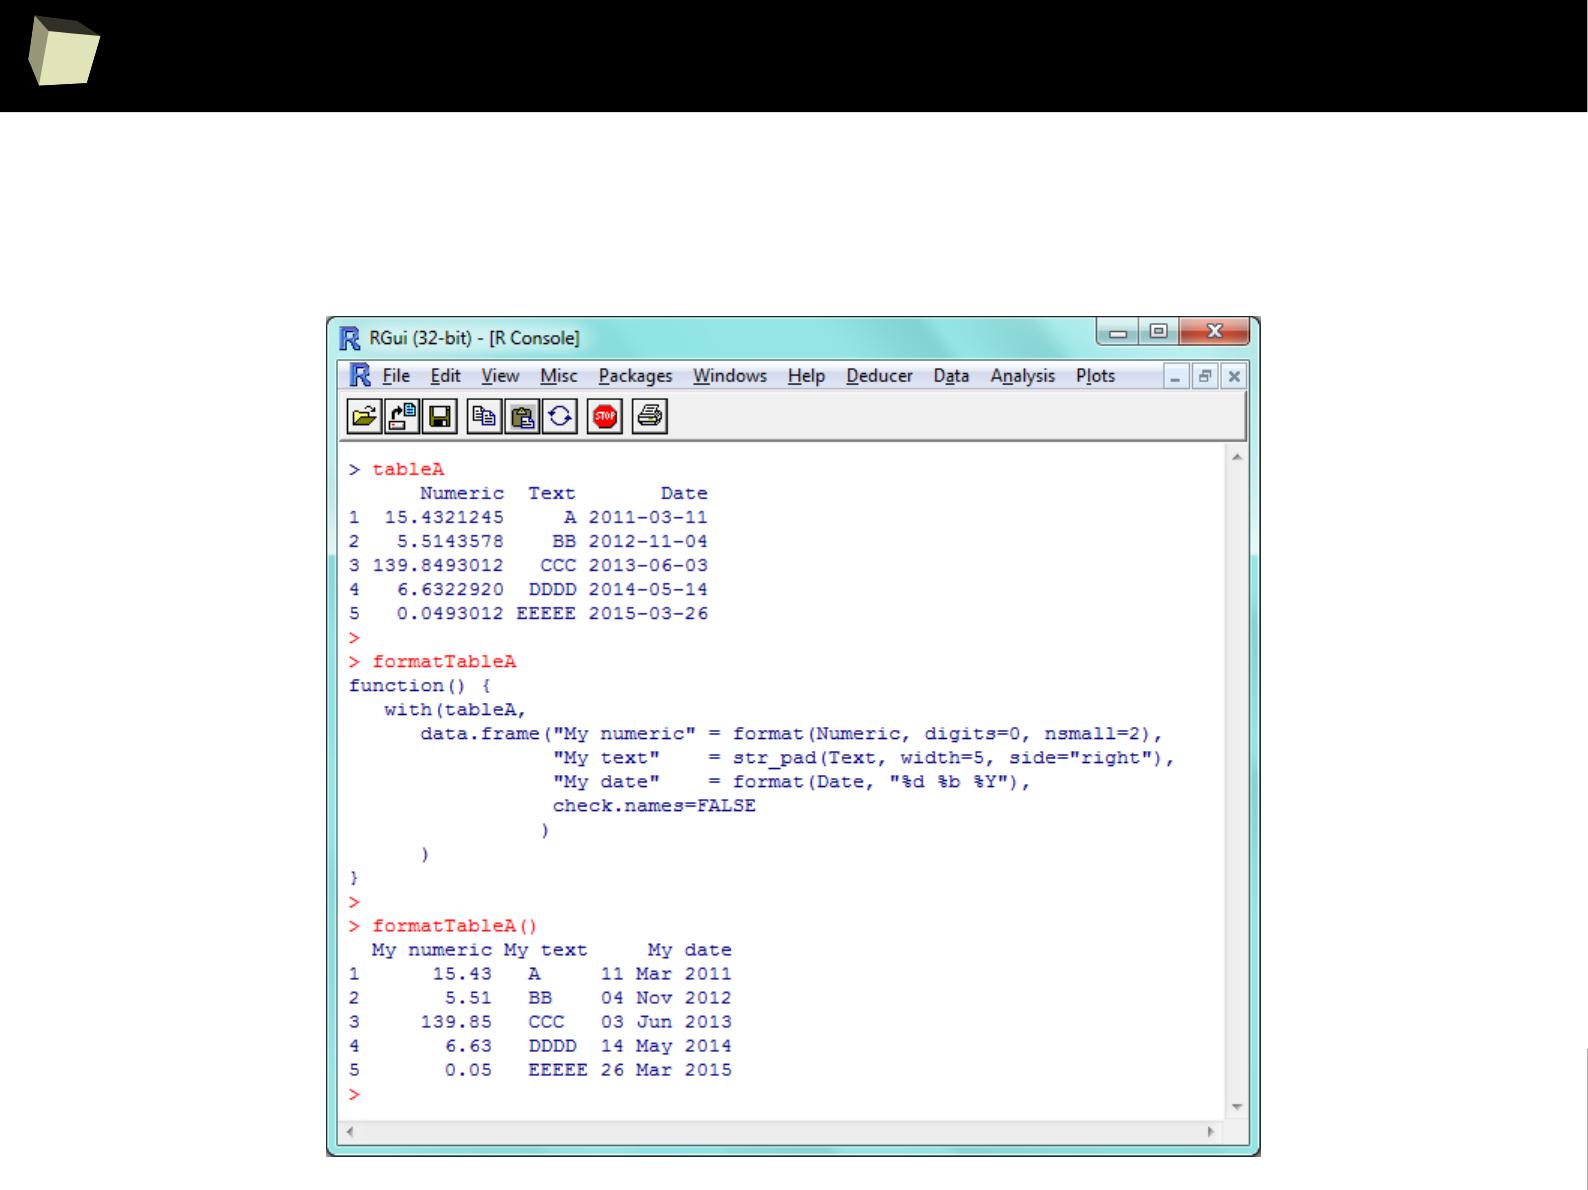
3
5
1
Handling metadata
To control formats on the column or cell level one must write additional formatting
code every time it is required (usually a function is created for this purpose).

3
5
2
Handling metadata
This separates metadata from data and is an anti-pattern leading to:
●
Creation of dedicated formatting code specific to a data object. Amount of the code
grows quickly as new variables are created (formatTableA, formatListB, etc.)
●
Errors, when someone mistakes one metadata for other. This happens easily for
large sets of variables.
The golden rule is that the data should be “self-describing”.
This indicates the need to introduce a separate, independent, intermediate metadata
layer between the data and the output rendering code, which consists of:
●
Set of attributes describing data objects
●
Functions assigning these attributes to data objects
●
Functions retrieving values of the attributes and applying them to the raw data
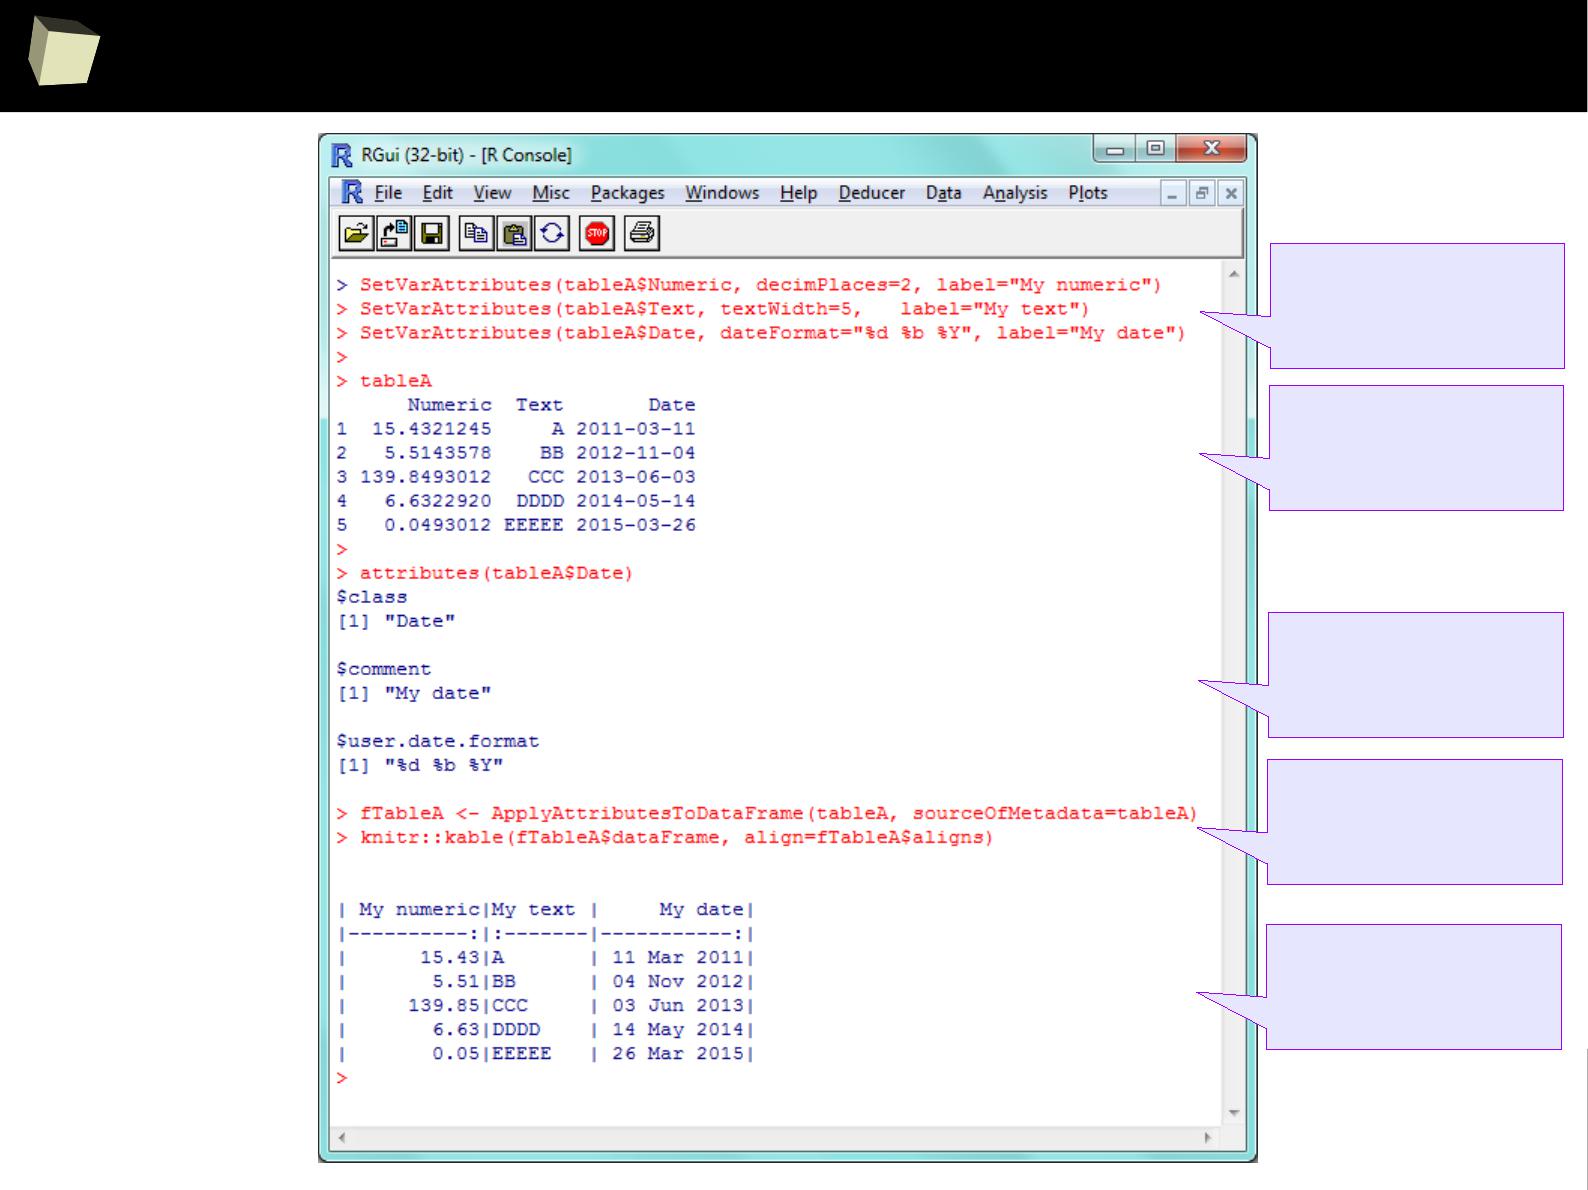
3
5
3
Metadata in use
Assigning attributes
(metadata) to the
original table
Original data stays
unchanged
Metadata bound to
a column of
the original table
Applying metadata
to the table
Displaying formatted
result

3
5
4
Handling metadata
Fortunately, it is possible to create one's own metadata layer by using R attributes.
Author of this presentation wrote for his own use a set of functions for:
●
Managing and using dictionaries (code lists)
●
Binding metadata to objects
●
Controlling the way data is displayed (applying metadata to datasets)
●
Displaying the data with metadata overlapped
●
Copying metadata between objects (when attributes were wiped out)
●
Describing datasets in detail
●
Reading labels of variables from sasXmlMap file
●
Creating SAS Transport Files (XPT) using the attached metadata
They are supposed to be released as an R package in future.

3
5
5
Own metadata layer - example
> x <- c(5L,NA,6L,7L,1L)
> data <- data.frame(
unlabeled = c(NA, "A", "B", "C", "D"),
vlt = c("This is a long string", "Another long string", "Much longer string than previous",
"A short string", NA),
dv = c(NA, rnorm(4)),
pct = x/sum(na.omit(x)),
int = x,
dt = as.POSIXct(c("2011-02-01 08:00", "2010-04-21 12:30", NA, "1999-11-02 14:15", "2000-10-15 07:30")),
dat = as.POSIXct(c("2011-02-01 08:00", "2010-04-21 12:30", NA, "1999-11-02 14:15", "2000-10-15 07:30")),
tim = as.POSIXct(c("2011-02-01 08:00", "2010-04-21 12:30", NA, "1999-11-02 14:15", "2000-10-15 07:30")),
trt = c(1,NA,2,4,3))
> # raw, unformatted data
> data
unlabeled vlt dv pct int dt dat tim trt
1 <NA> This is a long string NA 0.26315789 5 2011-02-01 08:00:00 2011-02-01 08:00:00 2011-02-01 08:00:00 1
2 A Another long string -1.4286644 NA NA 2010-04-21 12:30:00 2010-04-21 12:30:00 2010-04-21 12:30:00 NA
3 B Much longer than previous 1.5035051 0.31578947 6 <NA> <NA> <NA> 2
4 C A short string -1.3464709 0.36842105 7 1999-11-02 14:15:00 1999-11-02 14:15:00 1999-11-02 14:15:00 4
5 D <NA> -0.7571589 0.05263158 1 2000-10-15 07:30:00 2000-10-15 07:30:00 2000-10-15 07:30:00 3
Definition of an exemplary dataset:

3
5
6
Metadata - example
# Look how a definition in SAS format can be used directly
> AddUserDictFromDef(definitions = 'value MyDict
1 = "Treatment A"
2 = "Treatment B"
3 = "Placebo";', SASFormat=TRUE)
> AddUserDict("sex", codes = c("F", "M"),
labels = c("Female", "Male"))
> UCODELST
codelst clcode cllabel
1 MyDict 1 Treatment A
2 MyDict 2 Treatment B
3 MyDict 3 Placebo
4 sex F Female
5 sex M Male
Definition of exemplary dictionaries:
3
5
7
Metadata - example
> SetVarAttributes(data$vlt, label = "Very long text", textWidth = 15, sasFormat = "$15.")
> SetVarAttributes(data$dv, label = "Double value", decimPlaces = 2, sasFormat = "8.2")
> SetVarAttributes(data$pct, label = "Percentage", decimPlaces = 1, asPercent = TRUE)
> SetSVarAttributes("data$int", label = "Integer") # variable name passed as a literal
> SetVarAttributes(data$dat, label = "Date", dateFormat = "%d%b%Y", sasFormat = "yymmdd10.")
> SetVarAttributes(data$dt, label = "Date & Time (ISO 8601)", dateFormat = "%Y-%m-%d %H:%M:%S",
sasFormat = "e8601dt19.")
> SetVarAttributes(data$tim, label = "Time", dateFormat = "%H:%M")
> SetVarAttributes(data$trt, label = "Translated", translDict = "MyDict")
> SetVarAttributes(data, label = "My data set")
> attributes(data$dt)
$class
[1] "POSIXct" "POSIXt"
$tzone
[1] ""
$comment
[1] "Date & Time (ISO 8601)"
$user.date.format
[1] "%Y-%m-%d %H:%M:%S"
$user.sas.format
[1] "e8601dt19."
Add some metadata:
Attributes bound to
a column of a data.frame
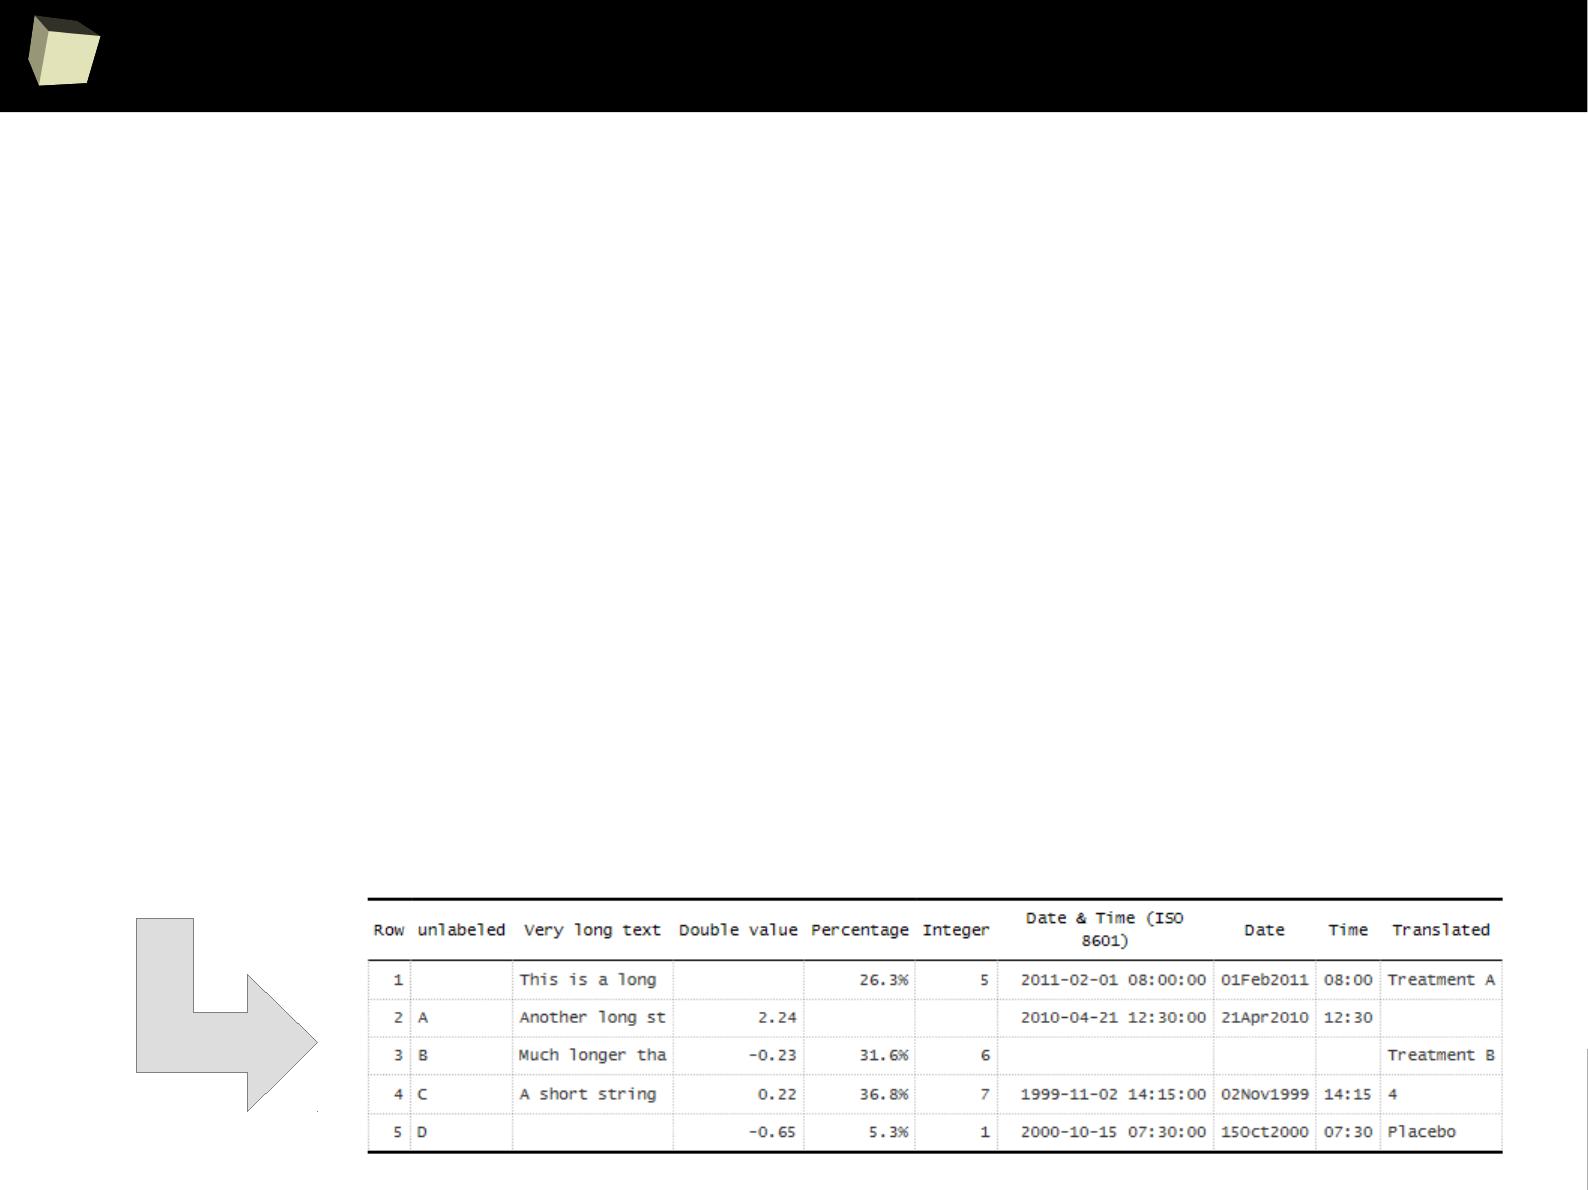
3
5
8
Metadata - example
# Raw data
> data
unlabeled vlt dv pct int dt dat tim trt
1 <NA> This is a long string NA 0.26315789 5 2011-02-01 08:00:00 2011-02-01 08:00:00 2011-02-01 08:00:00 1
2 A Another long string -1.4286644 NA NA 2010-04-21 12:30:00 2010-04-21 12:30:00 2010-04-21 12:30:00 NA
3 B Much longer than previous 1.5035051 0.31578947 6 <NA> <NA> <NA> 2
4 C A short string -1.3464709 0.36842105 7 1999-11-02 14:15:00 1999-11-02 14:15:00 1999-11-02 14:15:00 4
5 D <NA> -0.7571589 0.05263158 1 2000-10-15 07:30:00 2000-10-15 07:30:00 2000-10-15 07:30:00 3
# Data with metadata overlapped (output is in RMarkdown format)
> PrintDataFrame(data, sourceOfMetadata = data)
| Row|unlabeled |Very long text | Double value| Percentage| Integer| Date & Time (ISO 8601)| Date| Time|Translated |
|---:|:---------|:---------------|------------:|----------:|-------:|----------------------:|---------:|-----:|:-----------|
| 1| |This is a long | | 26.3%| 5| 2011-02-01 08:00:00| 01Feb2011| 08:00|Treatment A |
| 2|A |Another long st | -1.43| | | 2010-04-21 12:30:00| 21Apr2010| 12:30| |
| 3|B |Much longer tha | 1.50| 31.6%| 6| | | |Treatment B |
| 4|C |A short string | -1.35| 36.8%| 7| 1999-11-02 14:15:00| 02Nov1999| 14:15|4 |
| 5|D | | -0.76| 5.3%| 1| 2000-10-15 07:30:00| 15Oct2000| 07:30|Placebo |
Display the data with metadata applied:

3
5
9
Metadata - example
> DescribeTable(data) # simple, default form
My data set
_______________________________________________________________________________________________________________________________________________________
Rows: 5
dat* DAT maxL: 19 W: D: T: N: 4 NA: 1 U: 5 | 01Feb2011, 21Apr2010, NA, 02Nov1999, 15Oct2000
dt* DAT maxL: 19 W: D: T: N: 4 NA: 1 U: 5 | 2011-02-01 08:00:00, 2010-04-21 12:30:00, NA, 1999-11-02 14:15:00, 2000-10-15 07:30:00
dv* dbl maxL: 18 W: D:2 T: N: 4 NA: 1 U: 5 | Min -1.43, Q1 -1.39, Me -1.05, Q3 0.37, Max 1.5 | NA, -1.42866436243726, 1.50350508808 ...
int* int maxL: 2 W: D:0 T: N: 4 NA: 1 U: 5 | Min 1, Q1 3, Me 5.5, Q3 6.5, Max 7 | 5, NA, 6, 7, 1
pct* dbl maxL: 18 W: D:1 T: N: 4 NA: 1 U: 5 | Min 0.05, Q1 0.16, Me 0.29, Q3 0.34, Max 0.37 | 0.263157894736842, NA, 0.3157894736842 ...
tim* DAT maxL: 19 W: D: T: N: 4 NA: 1 U: 5 | 08:00, 12:30, NA, 14:15, 07:30
trt* dbl maxL: 2 W: D:2 T:Y N: 4 NA: 1 U: 5 | Min 1, Q1 1.5, Me 2.5, Q3 3.5, Max 4 | (MyDict) Treatment A, NA, Treatment B, 4, Placebo
unlabeled txt maxL: 2 W: D: T: N: 4 NA: 1 U: 5 | NA, A, B, C, D
vlt* txt maxL: 25 W: 15 D: T: N: 4 NA: 1 U: 5 | This is a long string, Another long string, Much longer than previous, A short string, NA
> DescribeTable(data, displayLabels=TRUE, displaySASFormats = TRUE) # more detailed
My data set
_______________________________________________________________________________________________________________________________________________________
Rows: 5
dat [Date] DAT maxL: 19 W: D: SASf: yymmdd10. T: N: 4 NA: 1 U: 5 | 01Feb2011, 21Apr2010, NA, 02Nov1999, 15Oct2000
dt [Date & Time (ISO 8601)]DAT maxL: 19 W: D: SASf:e8601dt19. T: N: 4 NA: 1 U: 5 | 2011-02-01 08:00:00, 2010-04-21 12:30:00, NA, 1 ...
dv [Double value] dbl maxL: 18 W: D:2 SASf: 8.2 T: N: 4 NA: 1 U: 5 | Min -1.43, Q1 -1.39, Me -1.05, Q3 0.37, Max 1.5 ...
int [Integer] int maxL: 2 W: D:0 SASf: T: N: 4 NA: 1 U: 5 | Min 1, Q1 3, Me 5.5, Q3 6.5, Max 7 | 5, NA, 6, ...
pct [Percentage] dbl maxL: 18 W: D:1 SASf: T: N: 4 NA: 1 U: 5 | Min 0.05, Q1 0.16, Me 0.29, Q3 0.34, Max 0.37 | ...
tim [Time] DAT maxL: 19 W: D: SASf: T: N: 4 NA: 1 U: 5 | 08:00, 12:30, NA, 14:15, 07:30
trt [Translated] dbl maxL: 2 W: D:2 SASf: T:Y N: 4 NA: 1 U: 5 | Min 1, Q1 1.5, Me 2.5, Q3 3.5, Max 4 | (MyDict) ...
unlabeled txt maxL: 2 W: D: SASf: T: N: 4 NA: 1 U: 5 | NA, A, B, C, D
vlt [Very long text] txt maxL: 25 W: 15 D: SASf: $15. T: N: 4 NA: 1 U: 5 | This is a long string, Another long string, Muc ...
Describe dataset with metadata attached:
3
6
0
Metadata - example
> newData <- sqldf("SELECT * FROM data") # sqldf wipes out attributes
> DescribeTable(newData, displayLabels=TRUE, displaySASFormats = TRUE)
Rows: 5
dat DAT maxL: 19 W: D: SASf: T: N: 4 NA: 1 U: 5 | 2011-02-01 08:00:00, 2010-04-21 12:30:00, NA, 1999-11-02 14:15:00, 2000-10-15 07 ...
dt DAT maxL: 19 W: D: SASf: T: N: 4 NA: 1 U: 5 | 2011-02-01 08:00:00, 2010-04-21 12:30:00, NA, 1999-11-02 14:15:00, 2000-10-15 07 ...
dv dbl maxL: 18 W: D:2 SASf: T: N: 4 NA: 1 U: 5 | Min -0.65, Q1 -0.44, Me 0, Q3 1.23, Max 2.24 | NA, 2.24243108561811, -0.22569800 ...
int int maxL: 2 W: D:0 SASf: T: N: 4 NA: 1 U: 5 | Min 1, Q1 3, Me 5.5, Q3 6.5, Max 7 | 5, NA, 6, 7, 1
pct dbl maxL: 18 W: D:2 SASf: T: N: 4 NA: 1 U: 5 | Min 0.05, Q1 0.16, Me 0.29, Q3 0.34, Max 0.37 | 0.263157894736842, NA, 0.3157894 ...
tim DAT maxL: 19 W: D: SASf: T: N: 4 NA: 1 U: 5 | 2011-02-01 08:00:00, 2010-04-21 12:30:00, NA, 1999-11-02 14:15:00, 2000-10-15 07 ...
trt dbl maxL: 2 W: D:2 SASf: T: N: 4 NA: 1 U: 5 | Min 1, Q1 1.5, Me 2.5, Q3 3.5, Max 4 | 1, NA, 2, 4, 3
unlabeled txt maxL: 2 W: D: SASf: T: N: 4 NA: 1 U: 5 | NA, A, B, C, D
vlt txt maxL: 25 W: D: SASf: T: N: 4 NA: 1 U: 5 | This is a long string, Another long string, Much longer than previous, A short s ...
> CopyUserAttributes(srcDS = data, destDS = newData, env=environment())
Copied table attribute: [newData]@comment = My data set
Copied column attribute: [vlt]@comment = Very long text
Copied column attribute: [vlt]@user.str.len = 15
Copied column attribute: [vlt]@user.sas.format = $15.
...
Copied column attribute: [trt]@comment = Translated
Copied column attribute: [trt]@user.transl.dict = MyDict
> DescribeTable(newData, displayLabels=TRUE, displaySASFormats = TRUE)
My data set
_______________________________________________________________________________________________________________________________________________________
Rows: 5
dat [Date] DAT maxL: 19 W: D: SASf: yymmdd10. T: N: 4 NA: 1 U: 5 | 01Feb2011, 21Apr2010, NA, 02Nov1999, 15Oct2000
dt [Date & Time (ISO 8601)]DAT maxL: 19 W: D: SASf:e8601dt19. T: N: 4 NA: 1 U: 5 | 2011-02-01 08:00:00, 2010-04-21 12:30:00, NA, 1 ...
dv [Double value] dbl maxL: 18 W: D:2 SASf: 8.2 T: N: 4 NA: 1 U: 5 | Min -0.65, Q1 -0.44, Me 0, Q3 1.23, Max 2.24 | ...
int [Integer] int maxL: 2 W: D:0 SASf: T: N: 4 NA: 1 U: 5 | Min 1, Q1 3, Me 5.5, Q3 6.5, Max 7 | 5, NA, 6, ...
pct [Percentage] dbl maxL: 18 W: D:1 SASf: T: N: 4 NA: 1 U: 5 | Min 0.05, Q1 0.16, Me 0.29, Q3 0.34, Max 0.37 | ...
tim [Time] DAT maxL: 19 W: D: SASf: T: N: 4 NA: 1 U: 5 | 08:00, 12:30, NA, 14:15, 07:30
trt [Translated] dbl maxL: 2 W: D:2 SASf: T:Y N: 4 NA: 1 U: 5 | Min 1, Q1 1.5, Me 2.5, Q3 3.5, Max 4 | (MyDict) ...
unlabeled txt maxL: 2 W: D: SASf: T: N: 4 NA: 1 U: 5 | NA, A, B, C, D
vlt [Very long text] txt maxL: 25 W: 15 D: SASf: $15. T: N: 4 NA: 1 U: 5 | This is a long string, Another long string, Muc ...
Transfer attributes between two datasets.

3
6
1
Metadata - example
keep.attr <- function(x)
{
a <- attributes(x)
a[c('names','row.names','class','dim','dimnames')] <- NULL
a
}
keep <- function(.Data, ..., .Attr=NULL)
{
cl <- union('keep', class(.Data))
do.call('structure', c(list(.Data, class=cl, ...), .Attr))
}
'[.keep' <- function(.Data, ...)
keep(NextMethod(), .Attr=keep.attr(.Data))
'[<-.keep' <- function(.Data, ...)
keep(NextMethod(), .Attr=keep.attr(.Data))
> newData <- data # dataset “data” has attributes which will be copied
> DescribeTable(newData, displayLabels=TRUE, displaySASFormats = TRUE)
My data set
_______________________________________________________________________________________________________________________________________________________
Rows: 5
dat [Date] DAT maxL: 19 W: D: SASf: yymmdd10. T: N: 4 NA: 1 U: 5 | 01Feb2011, 21Apr2010, NA, 02Nov1999, 15Oct2000
dt [Date & Time (ISO 8601)]DAT maxL: 19 W: D: SASf:e8601dt19. T: N: 4 NA: 1 U: 5 | 2011-02-01 08:00:00, 2010-04-21 12:30:00, NA, 1 ...
dv [Double value] dbl maxL: 18 W: D:2 SASf: 8.2 T: N: 4 NA: 1 U: 5 | Min -0.65, Q1 -0.44, Me 0, Q3 1.23, Max 2.24 | ...
int [Integer] int maxL: 2 W: D:0 SASf: T: N: 4 NA: 1 U: 5 | Min 1, Q1 3, Me 5.5, Q3 6.5, Max 7 | 5, NA, 6, ...
pct [Percentage] dbl maxL: 18 W: D:1 SASf: T: N: 4 NA: 1 U: 5 | Min 0.05, Q1 0.16, Me 0.29, Q3 0.34, Max 0.37 | ...
tim [Time] DAT maxL: 19 W: D: SASf: T: N: 4 NA: 1 U: 5 | 08:00, 12:30, NA, 14:15, 07:30
trt [Translated] dbl maxL: 2 W: D:2 SASf: T:Y N: 4 NA: 1 U: 5 | Min 1, Q1 1.5, Me 2.5, Q3 3.5, Max 4 | (MyDict) ...
unlabeled txt maxL: 2 W: D: SASf: T: N: 4 NA: 1 U: 5 | NA, A, B, C, D
vlt [Very long text] txt maxL: 25 W: 15 D: SASf: $15. T: N: 4 NA: 1 U: 5 | This is a long string, Another long string, Muc ...
Transfer attributes when datasets are copied via <- or =

3
6
2
Metadata – reading *.sasXmlMap
# Quick and dirty reading labels from the *.sasXmlMap file. This can be easily extended.
ApplyLabelsFromSasXmlMap <- function(collectionOfTables, pathToSasXmlMap) {
nameOfTablesCollection <- deparse(substitute(collectionOfTables))
if(file.exists(pathToSasXmlMap)) {
DOM <- xmlParse(pathToSasXmlMap)
for(tab in names(collectionOfTables)) {
for(col in toupper(colnames(collectionOfTables[[tab]]))) {
labelList <- xpathApply(DOM, paste0("//TABLE[@name = '", tab, "']/COLUMN[@name = '", col,
"']/DESCRIPTION"), xmlValue)
if(length(labelList) > 0) {
cat(paste("Table:", tab, " Column:", col, "=", labelList[[1]], "\n"))
SetSVarAttributes(varName = paste0(nameOfTablesCollection, "$", tab, "$",
tolower(col)), label = labelList[[1]])
}
}
}
}
}
With R one can easily parse additional XML files containing definition of metadata.
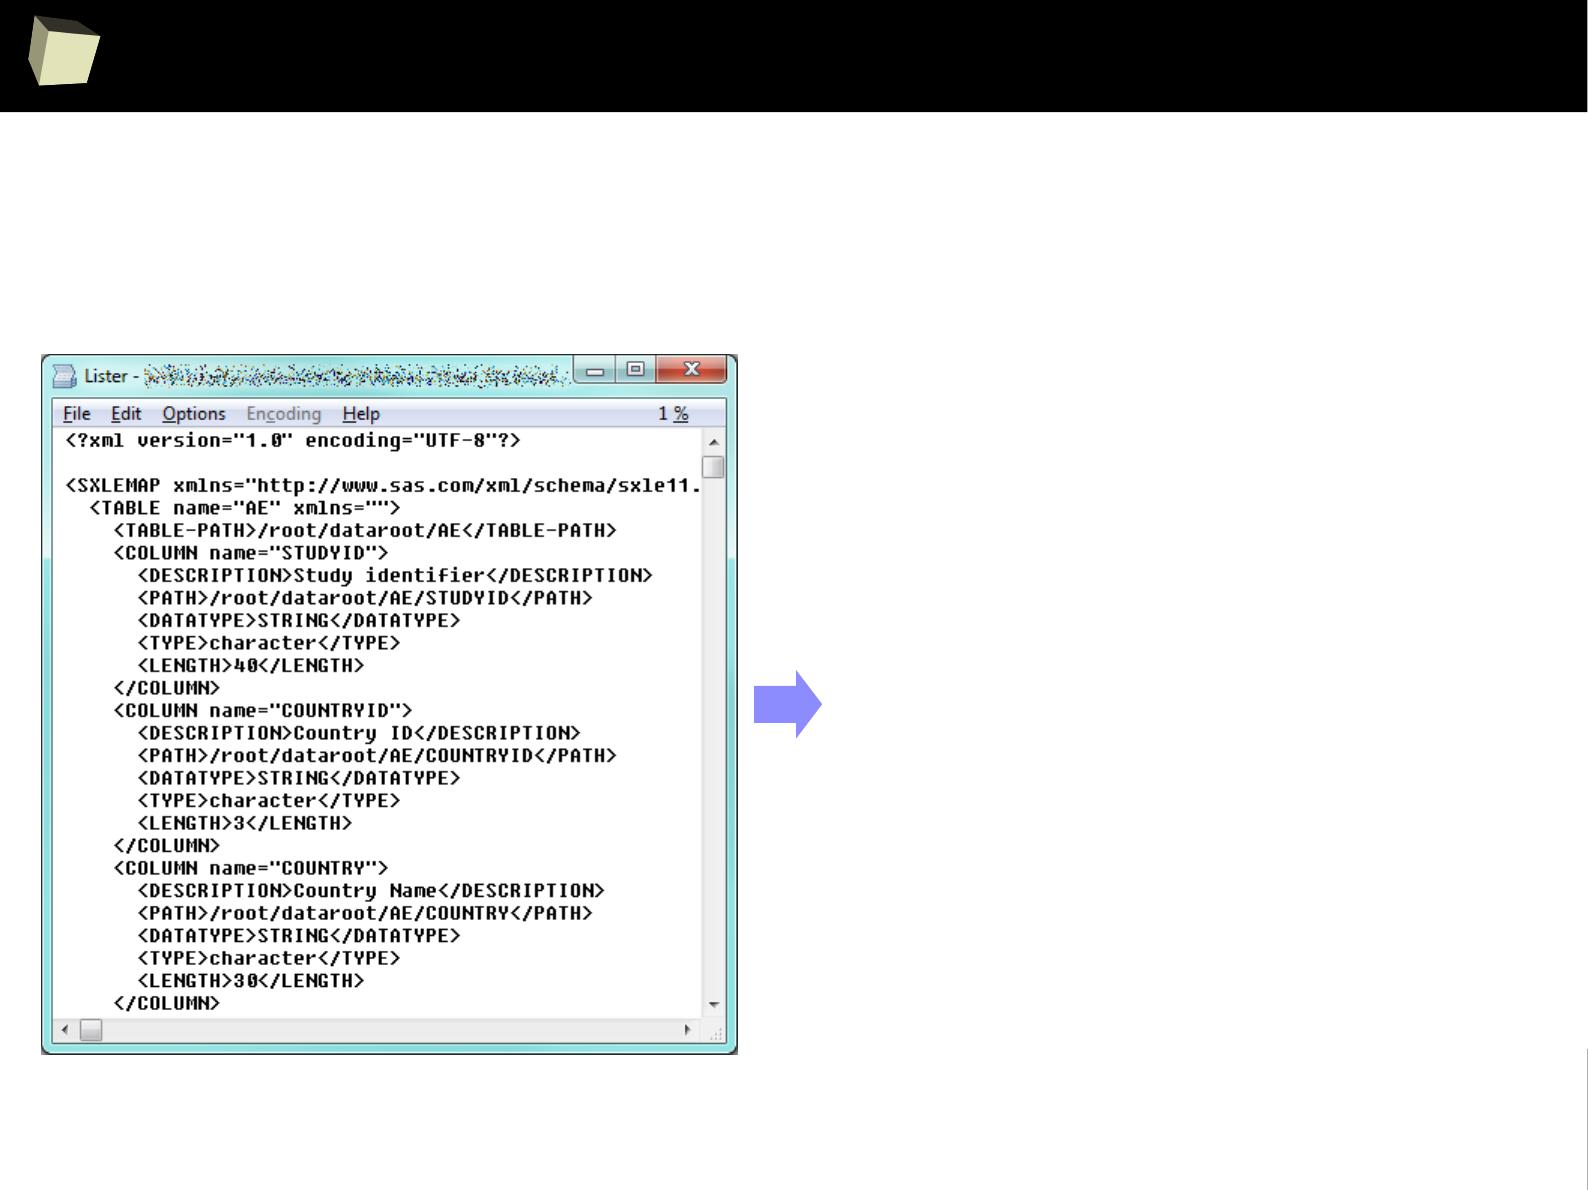
3
6
3
Metadata – reading *.sasXmlMap
With R one can easily parse additional XML files containing definition of metadata.
> # labels may be overwritten later in code
> ApplyLabelsFromSasXmlMap(cdash, "test.sasXmlMap")
Table: AE Column: STUDYID = Study identifier
Table: AE Column: COUNTRYID = Country ID
Table: AE Column: COUNTRY = Country Name
Table: AE Column: SITEID = Study site identifier
Table: AE Column: SITE = Site Name
Table: AE Column: SUBJID = Study subject identifier
Table: AE Column: RANDNO = Study subject
randomization number
Table: AE Column: AESPID = Adverse event's number
Table: AE Column: USERNAME = Login Name
Table: AE Column: USER_FULL_NAME = User Name
Table: AE Column: LAST_MODIFIED = Last Modifed
Table: AE Column: RECORD_STATUS = Record Status
Table: AE Column: AEYN = Adverse events
Table: AE Column: AETERM = Diagnosis or signs
...
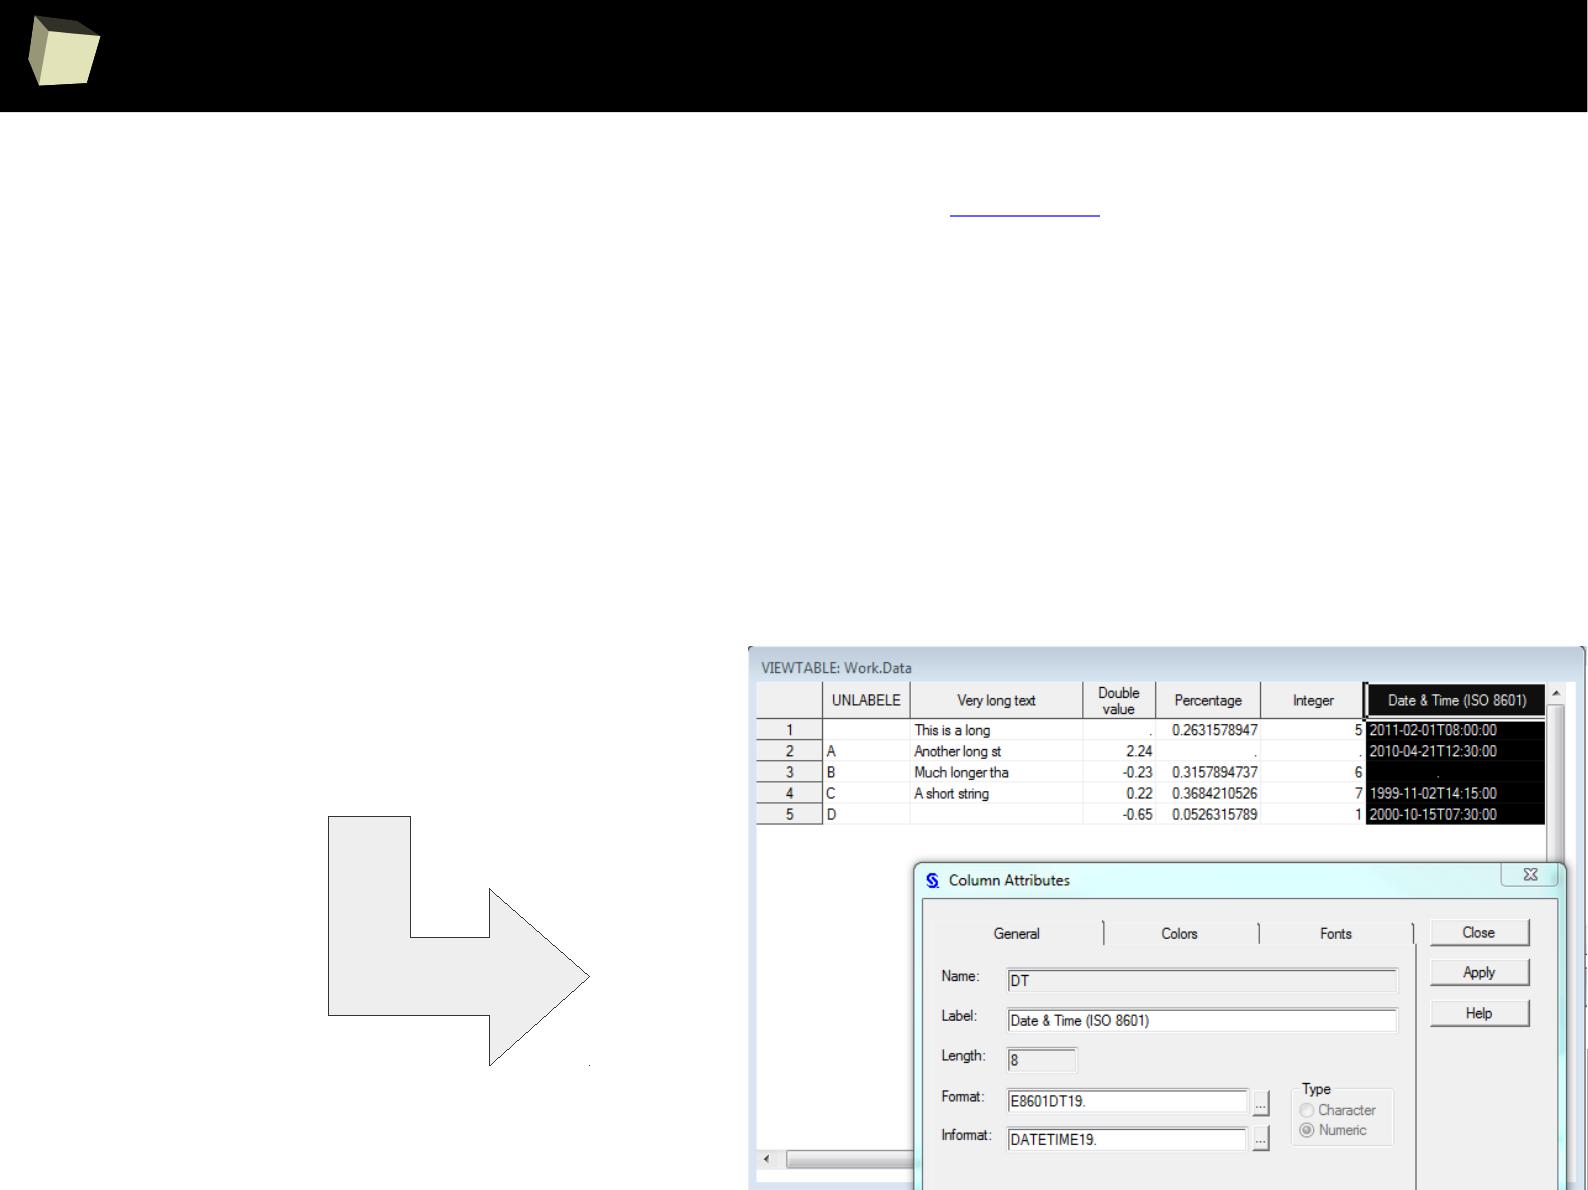
3
6
4
Metadata – creating SAS Transport File
> MakeSASTransportFile(data, "c:/tmp/test.xpt")
Processing: test.xpt
*** Setting metadata... ***
Processing column: unlabeled of class: character
Processing column: vlt of class: character | Specified width: 15 | Assigned SAS format: $15.
Processing column: dv of class: numeric | Specified decimal places: 2 | Assigned SAS format: 8.2
Processing column: pct of class: numeric | Specified decimal places: 1 | Assigned DEFAULT NUMERIC SAS format: Best12.
Processing column: int of class: integer | Assigned DEFAULT NUMERIC SAS format: Best12.
Processing column: dt of class: POSIXct | Specified format: %Y-%m-%d %H:%M:%S | Assigned SAS format: e8601dt19.
Processing column: dat of class: POSIXct | Specified format: %d%b%Y | Assigned SAS format: yymmdd10.
Processing column: tim of class: POSIXct | Specified format: %H:%M
Processing column: trt of class: numeric | Assigned DEFAULT NUMERIC SAS format: Best12.
*** Exporting the dataset into SAS transport file... ***
*** Done ***
Having metadata attached to a data.frame and using SASxport package SAS Transport
files can be created easily.

3
6
5
furtheR impoRtant issues
I Handling metadata
II Handling ODM and CDA metadata
III Issue with multilingual data
IV Differences between SAS and R
V Implementation of useful SAS functions

3
6
6
Handling ODM and CDA metadata
By using the ODMconverter package one can work with ODM and CDA formats
in R. Both formats can be reciprocally translated into each other. There are also
functions for creating R data.frames decorated with ODM metadata as well as
creating ODM definitions based on metadata bound to an existing R data.frame.
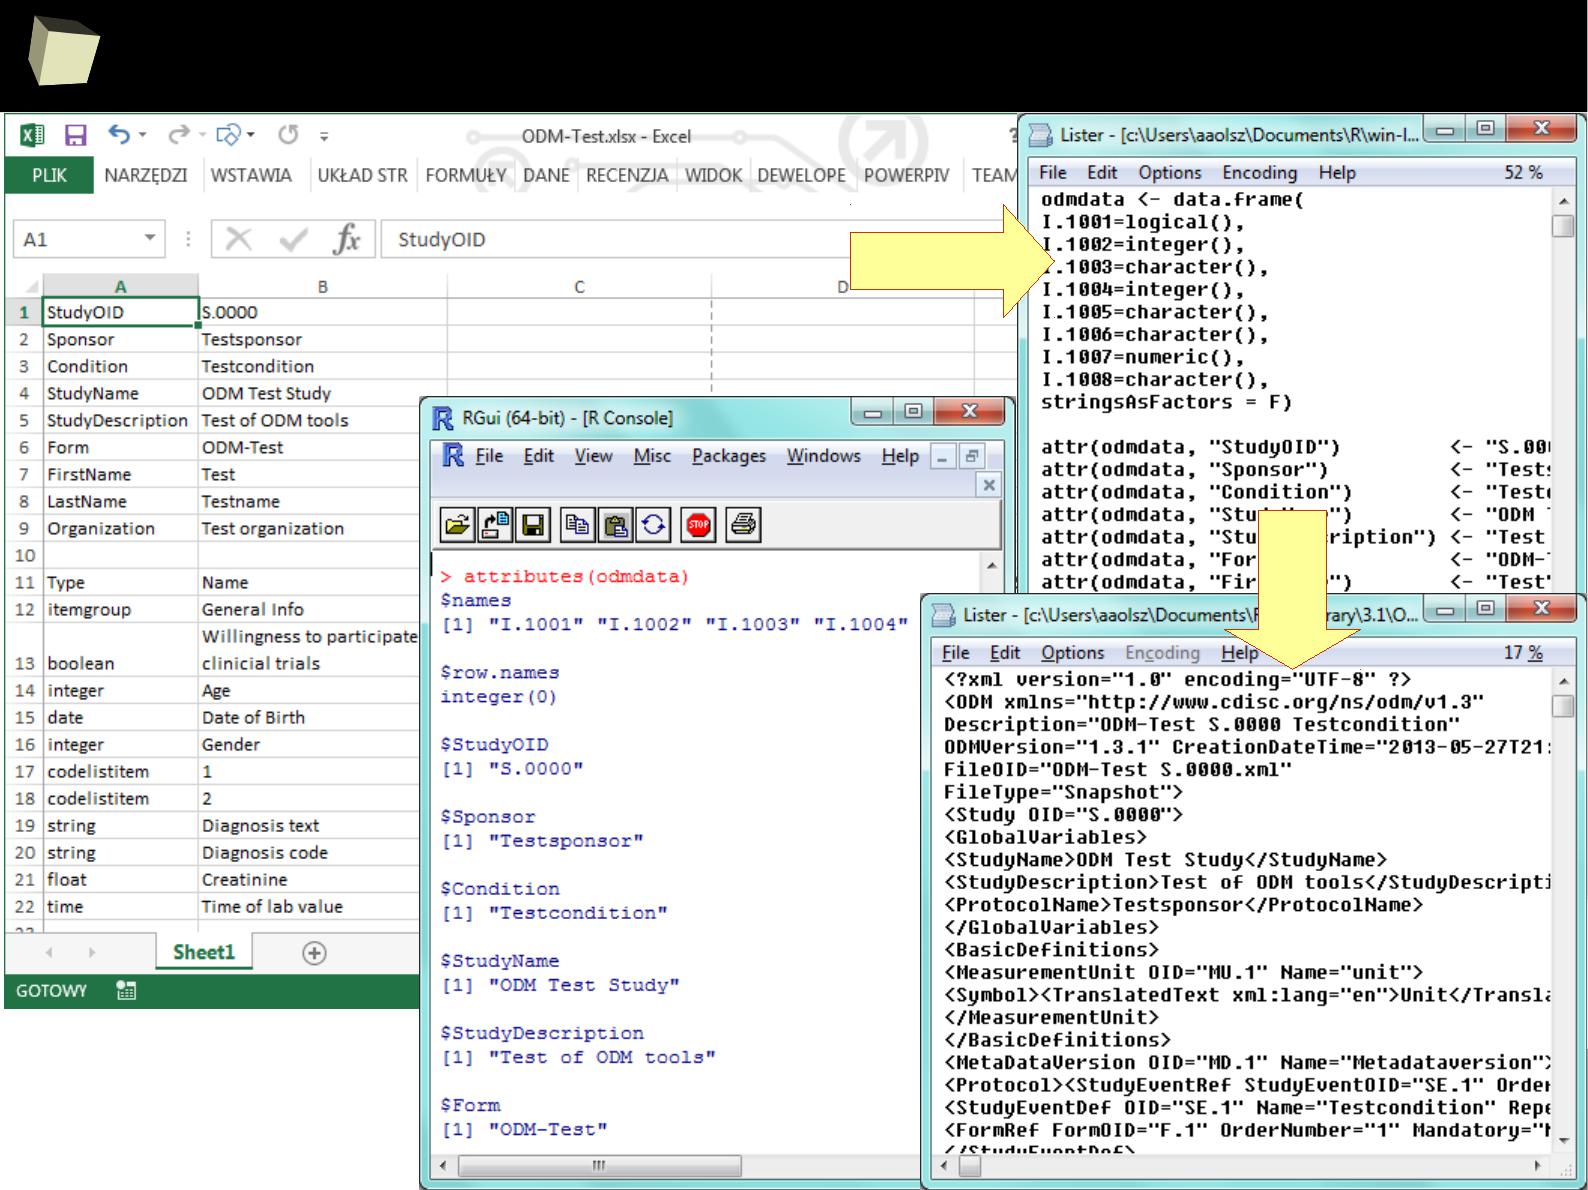
3
6
7
Handling ODM and CDA metadata
XLSx R→
R
→
ODM

3
6
8
furtheR impoRtant issues
I Handling metadata
II Handling ODM and CDA metadata
III Issue with multilingual data
IV Differences between SAS and R
V Implementation of useful SAS functions
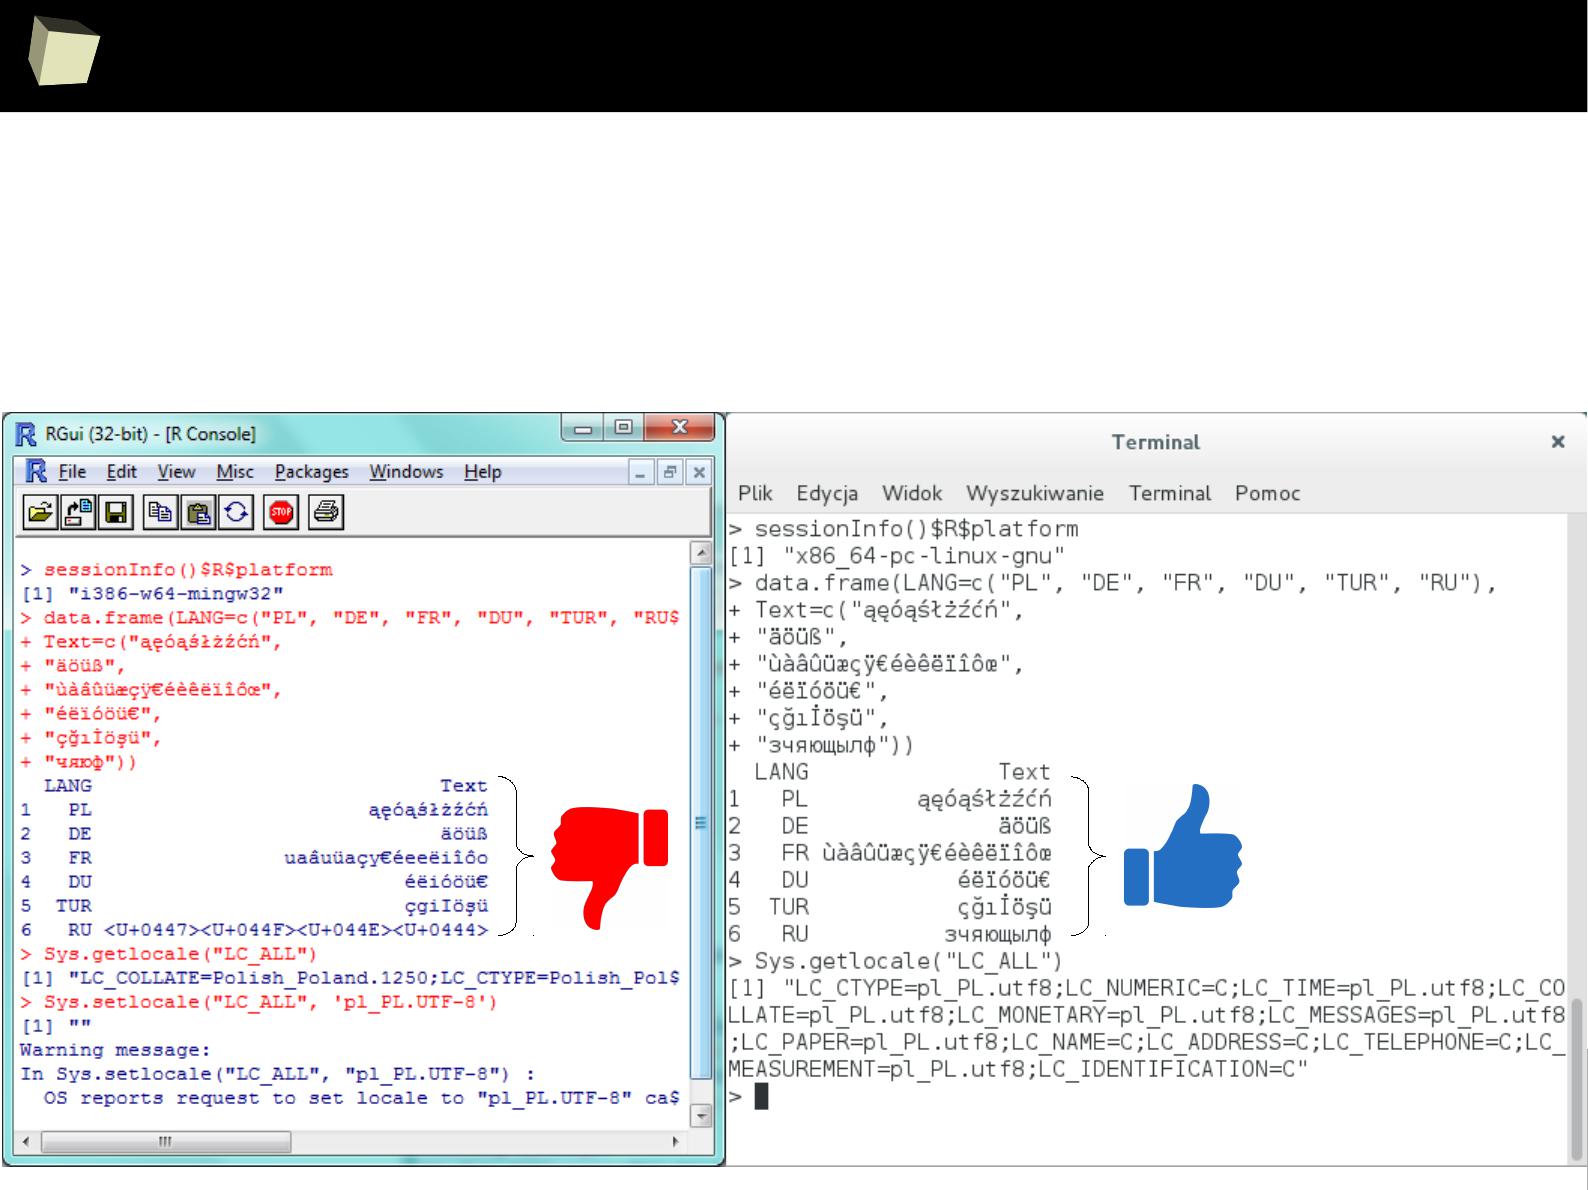
3
6
9
Issue with multilingual data
Windows Linux
If multilingual data has to be processed, the best choice is to do it under Linux
or MacOS. Both are unicode-enabled operating systems in contrast to Windows.

3
7
0
furtheR impoRtant issues
I Handling metadata
II Handling ODM and CDA metadata
III Issue with multilingual data
IV Differences between SAS and R
V Implementation of useful SAS functions

3
7
1
Differences between SAS and R
It is worth noting that:
●
R and SAS use different types of sum of square, type I and III respectively
●
R can be set to calculate SS of the same type (in fact – of any type)
●
R uses different default contrast coding than SAS
●
R can be set to use the same contrasts (contr.SAS)
●
Dates of origin of POSIX date/time differ across both packages:
●
in R: 1970-01-01 00:00:00 UTC
●
in SAS: 1960-01-01 00:00:00 GMT
●
R uses different algorithm for calculating quantiles. Luckily, SAS-compliant
algorithm is implemented (type 3)

3
7
2
furtheR impoRtant issues
I Handling metadata
II Handling ODM and CDA metadata
III Issue with multilingual data
IV Differences between SAS and R
V Implementation of useful SAS functions

3
7
3
R implementation of useful SAS functions #1
FirstRowsBy <- function(dataFrame, byColumns) {
DT <- data.table(dataFrame, key=byColumns)
as.data.frame(DT[unique(DT[, key(DT), with = FALSE]), mult = 'first'])
}
LastRowsBy <- function(dataFrame, byColumns) {
DT <- data.table(dataFrame, key=byColumns)
as.data.frame(DT[unique(DT[, key(DT), with = FALSE]), mult = 'last'])
}
MarkFirstLastBy <- function(dataFrame, byColumns) {
idName <- paste0("ID", paste0(sample(c(LETTERS, letters, 0:9), size=5), collapse=""))
dataFrame[, idName] <- seq_len(nrow(dataFrame))
firstIDs <- FirstRowsBy(dataFrame = dataFrame, byColumns = byColumns)[, idName]
lastIDs <- LastRowsBy(dataFrame = dataFrame, byColumns = byColumns)[, idName]
dataFrame$FIRST <- dataFrame[, idName] %in% firstIDs
dataFrame$LAST <- dataFrame[, idName] %in% lastIDs
dataFrame[, idName] <- NULL
return(dataFrame)
}
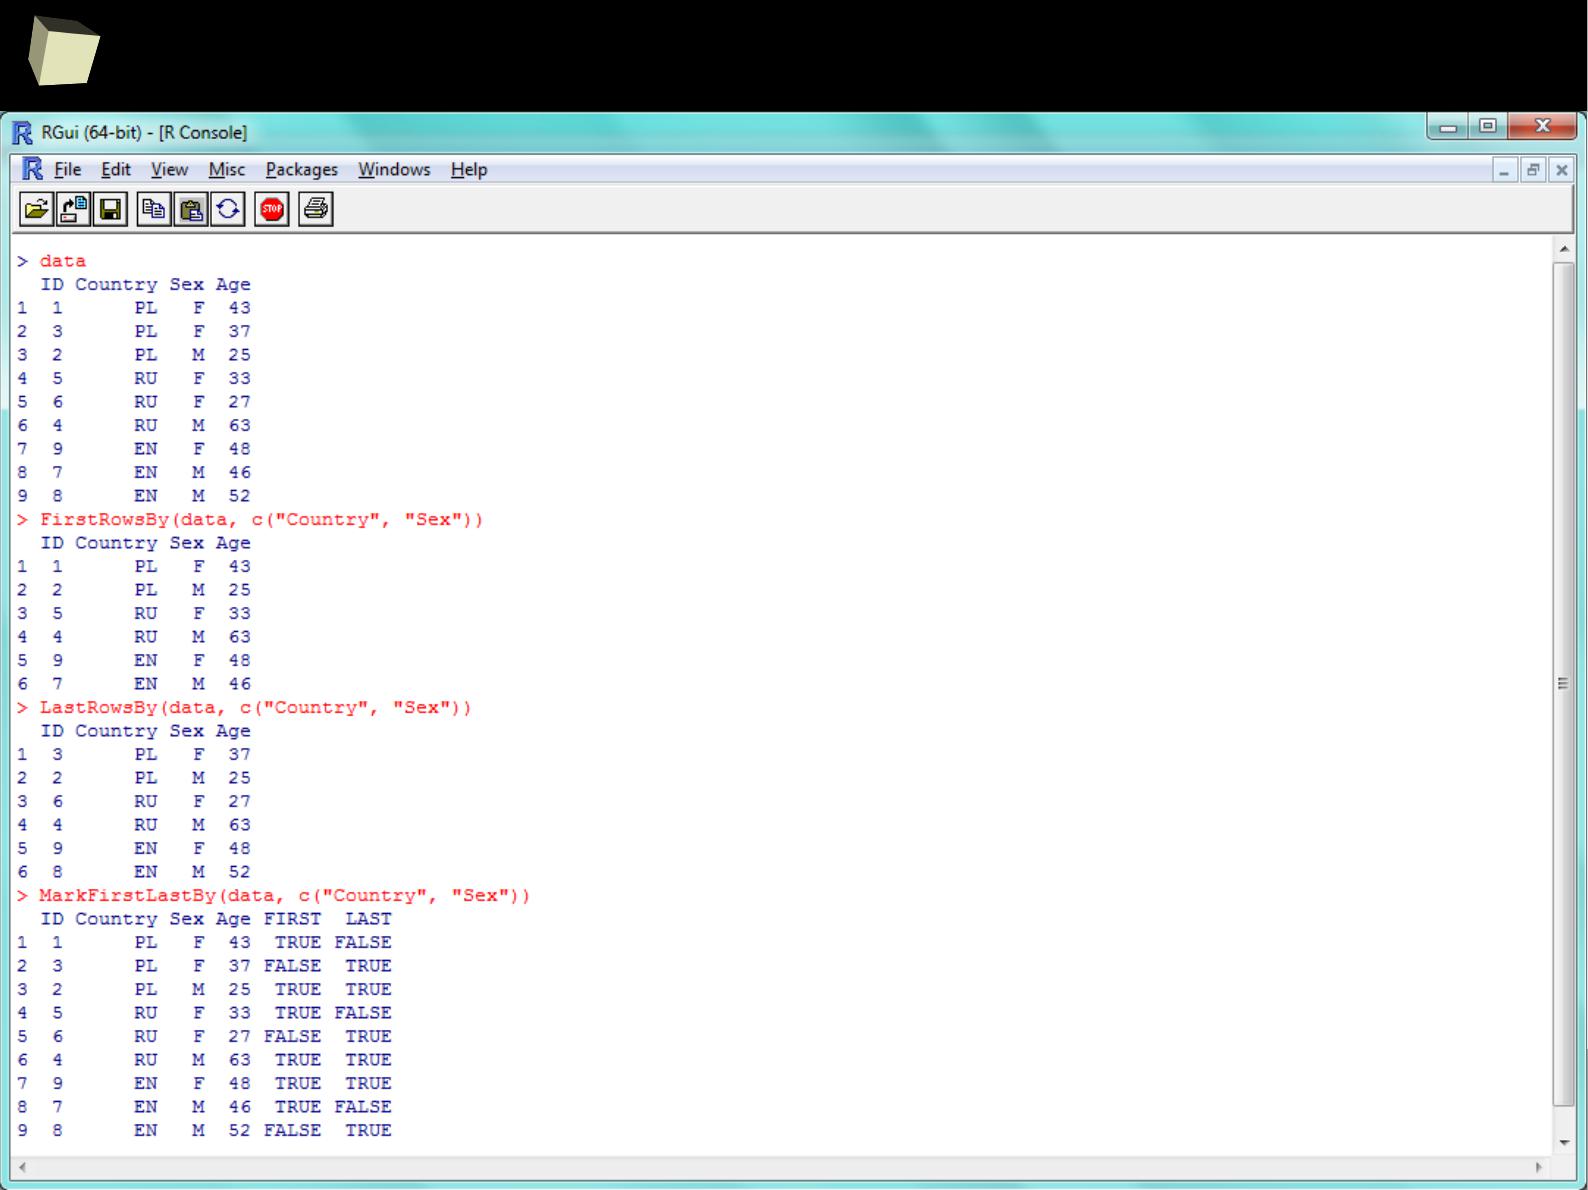
3
7
4
R implementation of useful SAS functions #1

3
7
5
Conclusion
Undoubtedly, R does meet all the requirements
involved in biostatistician's work.
It is perfectly fitted for this purpose.
R can entirely
replace SAS
as well as cooperate with.
so...

3
7
6
This presentation was published first time on Scribd on April 1
st
, 2014
Last update: 15
th
June, 2015
HTML version was created with PDF2HTML provided by Lu Wang
Please find the latest version of this document at:
http://www.scribd.com/AdrianOlszewski
or, in HTML version at:
http://www.r-clinical-research.com
Thank you for your attention!
